Order in Random Events Given random data we


 2) 3) 4) 5) 6)")
 Scatterplot is a graph comprised of points that")


 No relationship (0. 00) The Scatterplot on the")


- Slides: 24
Order in Random Events Given random data, we look for order and meaningful patterns. Are your chances better for getting dealt hand A or B? Your chances of being dealt either of these hands is precisely the same: 1 in 2, 598, 960.
Order in Random Events Given large numbers of random outcomes, a few are likely to express order. Angelo and Maria Gallina won two California lottery games on the same day.
Extraordinary events may have chance related explanations. • A one in a million miracle happens 295 times a day in America • You hear strange things, like dreaming about the death of a person and then getting a phone call about the death of that person. – Suppose 10 people you know die a year – 1 year contains 105, 120 five minute intervals during which you might think about 1 of those 10 people – Yet there are 295 million Americans that makes it 1/10, 512 x 295, 000 = 28, 063 or about 77 a day if a few make news this confirms our belief
It is human nature to find order/patterns – Superstitions • Water causes cramps • Getting cold makes someone sick • Weather changes cause arthritis pain
Think of a confounding variable + Correlation btw. Men with nice cars and wealth. Conclusion: having a nice car makes you wealthy + Correlation btw. wearing bifocals and cancer. Conclusion: wearing bifocals may lead to cancer - Correlation btw. hours spent at the tutoring center and scores on college exams. • Conclusion: Studying is bad for exam scores • -Correlation btw. Length of marriage and cancer in men. • • • – Conclusion: Woman cause cancer.
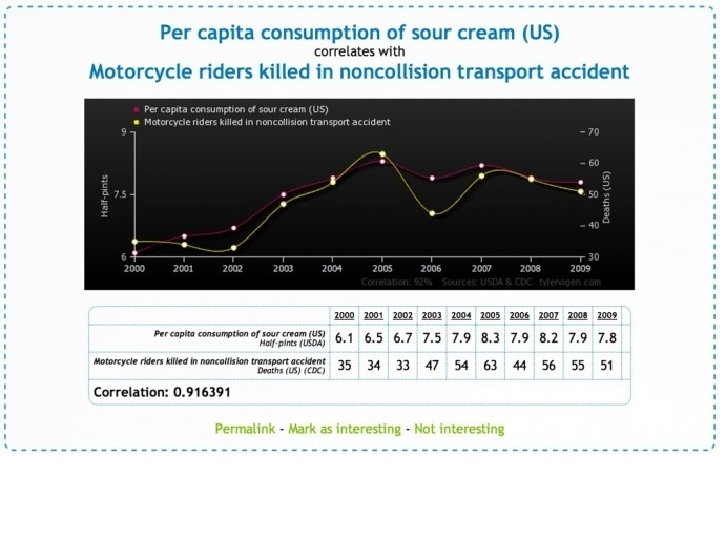
Correlational Research • Detects relationships between variables. • Does NOT say that one variable causes another. • Can be use to predict There is a positive correlation between ice cream and shark attacks. Does that mean that ice cream causes shark attacks?
Measured using a correlation coefficient. • A statistical measure of the extent to which two factors relate to one another
How to Read a Correlation Coefficient
Which of the following has the strongest relationship? 1) 2) 3) 4) 5) 6) . 5 -. 98 -. 75. 005
Scatterplots Perfect positive correlation (+1. 00) Scatterplot is a graph comprised of points that are generated by values of two variables. The slope of the points depicts the direction, while the amount of scatter depicts the strength of the relationship.
A Pick from A, B, C 1. 2. 3. B Relationship self-esteem and depression. Relationship between pairs of shoes owned and IQ score. Relationship between SAT score and first year college GPA. C Label the graph with the appropriate correlation coefficient. • 0 • +1 • +. 8 • -. 3 • -. 8 • -1 • +. 3
Create a Scatterplot with the data: Number of doors a car has 2 3 4 5 6 7 8 Average Driving Speed 73 75 60 55 50 48 45 What kind of correlation exists? Relatively Strong Negative
Scatterplots Perfect negative correlation (-1. 00) No relationship (0. 00) The Scatterplot on the left shows a negative correlation, while the on the right shows no relationship between the two variables.
Scatterplot The Scatterplot below shows the relationship between height and temperament in people. There is a moderate positive correlation of +0. 63.
Correlation and Causation or
Confounding Variables • Length of a marriage has a positive correlation with hair loss in men. • Does marriage cause hair loss? • Do balding men make better husbands? • Does another factor underline this correlation?
Positive correlation between sleeping with your shoes on and waking up with a headache. Does wearing your shoes to bed cause headaches?
Illusory Correlation The perception of a relationship where no relationship actually exists. Parents conceive children after adoption. Do not conceive Adopt Confirming evidence Disconfirming evidence Do not adopt Disconfirming evidence Confirming evidence Michael Newman Jr. / Photo Edit Conceive
Confounding Variables Reading Level • There is a strong positive correlation between shoe size and reading skill Shoe Size
Describe the relationship
Describe the relationship.
Correlational Research • Correlation is the relationship between two variables. • Positive correlation – both values increase • Negative correlation – One variable increases, while the other decreases. • Correlational Coefficient – strength of the relationship 0= no relationship +1 or – 1 = perfect relationship Examples: SAT scores and success in college; Red wine and heart attacks; Prejudice and age; length of marriage and hair loss, etc.