OPTIMIZING AND DEBUGGING GRAPHICS APPLICATIONS WITH AMDS GPU
OPTIMIZING AND DEBUGGING GRAPHICS APPLICATIONS WITH AMD'S GPU PERFSTUDIO 2. 5 GPG Developer Tools Gordon Selley Peter Lohrmann GDC 2011
GPU PERFSTUDIO 2 - OVERVIEW § Introduction to Perf. Studio – Quick overview of the key tools and features. § Demo Support for Multithreaded DX 11 Applications – Visualizing the structure of applications that use command lists and deferred contexts. – Debug the contents of command lists using flattening. § Demo Editing and Optimizing Shaders – The use of the shader editor and profiler to increase shader performance. 2 | GPU Perf. Studio 2. 5 | March 03, 2011 | Public
GPU PERFSTUDIO 2 - INTRODUCTION § What is GPU Perf. Studio 2? – GPU Perf. Studio 2 is AMD’s current GPU Performance Analysis & Debugging Tool for graphics applications § Key Features – Supports Open. GL 3. 0, Direct. X® 10 & 10. 1, Direct. X® 11 – Works on all vendor hardware (Profiler AMD only) – Server - Win 7, Vista (32 and 64 bit versions) – Client – Win 7, Vista, XP. – No custom driver requirements – Small footprint – no installation – No modifications to target application necessary – Free download http: //developer. amd. com/gpu/Perf. Studio 3 | GPU Perf. Studio 2. 5 | March 03, 2011 | Public 3
GPU PERFSTUDIO 2 – THE TOOLS § Frame Debugger – Select a draw call – View all game resources/state bound to the pipeline § Frame Profiler – Identify costly draw calls – Identify GPU bottlenecks, investigate at the counter level § Shader Debugger/Editor – Edit & Debug HLSL and Assembly code from inside an app – Step, breakpoints, inspect register values. § API Trace Viewer – Inspect all API calls (with arguments) – Visualize multi-threaded API usage – CPU timeline information for each API call 4 | GPU Perf. Studio 2. 5 | March 03, 2011 | Public
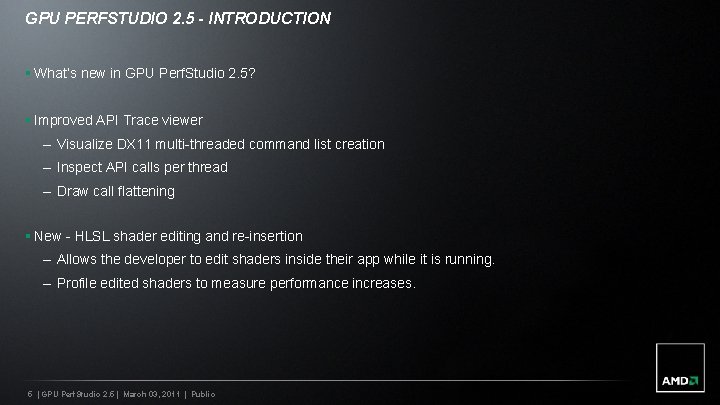
GPU PERFSTUDIO 2. 5 - INTRODUCTION § What’s new in GPU Perf. Studio 2. 5? § Improved API Trace viewer – Visualize DX 11 multi-threaded command list creation – Inspect API calls per thread – Draw call flattening § New - HLSL shader editing and re-insertion – Allows the developer to edit shaders inside their app while it is running. – Profile edited shaders to measure performance increases. 5 | GPU Perf. Studio 2. 5 | March 03, 2011 | Public
GPU PERFSTUDIO 2. 5 DEMONSTRATION § Multi. Threaded. Rendering 11 – Shader code is original – Shaders compiled with debug flags – Added some Perf. Markers 6 | GPU Perf. Studio 2. 5 | March 03, 2011 | Public
GPU PERFSTUDIO 2 AVAILABILITY § Download GPU Perf. Studio 2. 4 now from – http: //developer. amd. com/gpu/Perf. Studio/ § Perf. Studio 2. 5 available end of March 2011 § Free to all developers 7 | GPU Perf. Studio 2. 5 | March 03, 2011 | Public
OTHER AMD GPU TOOLS § Available at: http: //developer. amd. com/gpu – GPU Shader. Analyzer – GPU Perf API – AMD APP Profiler – AMD APP Kernel. Analyzer 8 | GPU Perf. Studio 2. 5 | March 03, 2011 | Public
CONTACT § Email – gputools. support@AMD. com – Gordon. Selley@AMD. com – Peter. Lohrmann@AMD. com § Developer forums – http: //forums. amd. com/devforum/ § Visit AMD Booth 924 9 | GPU Perf. Studio 2. 5 | March 03, 2011 | Public

QUESTIONS? 10 | GPU Perf. Studio 2. 5 | March 03, 2011 | Public

Trademark Attribution AMD, the AMD Arrow logo and combinations thereof are trademarks of Advanced Micro Devices, Inc. in the United States and/or other jurisdictions. Other names used in this presentation are for identification purposes only and may be trademarks of their respective owners. © 2011 Advanced Micro Devices, Inc. All rights reserved. 11 | GPU Perf. Studio 2. 5 | March 03, 2011 | Public
- Slides: 11