
Optimized TechnoEconomic Analysis of the Combined Photovoltaic and
Optimized Techno-Economic Analysis of the Combined Photovoltaic and a Novel Renewable Energy Systems for Mining Industry Applications Eduardo Vyhmeister B.
Summary Introduction Bound 4 Blue Natural Resources Fluctuation Methodology Results
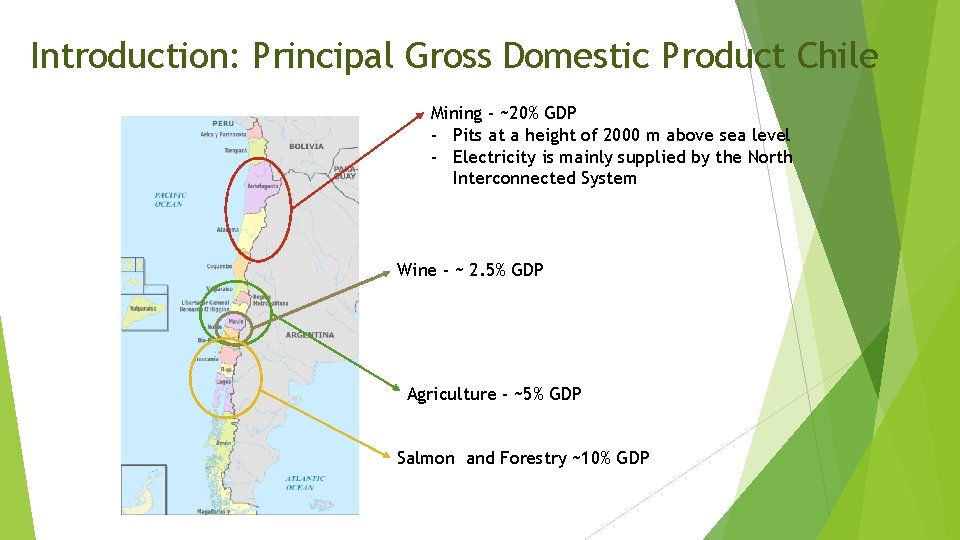
Introduction: Principal Gross Domestic Product Chile Mining - ~20% GDP - Pits at a height of 2000 m above sea level - Electricity is mainly supplied by the North Interconnected System Wine - ~ 2. 5% GDP Agriculture - ~5% GDP Salmon and Forestry ~10% GDP
Introduction: Mining in Chile Mining is the largest economic sector in Chile and the considerable energy requirements represent 20% to 50% of the operating costs. The industry is heavily dependent on other countries for the supply of this demand.
The Problems Electricity comes from coal 49%, natural gas 37%, diesel 9% and renewable energy 5% (2017) Greenhouse Gas Emission Mining location in arid sector (Regional irradiation indexes range from 5 to 12 k. Wh/m 2) Relative low wind speed velocity in the sector (Historical record of 4 m/s) Constant increase of the production (3. 8%) 3, 108. 358 k. Tons/year of fine material produced in the region (1, 453. 22 MW) ? ? ?
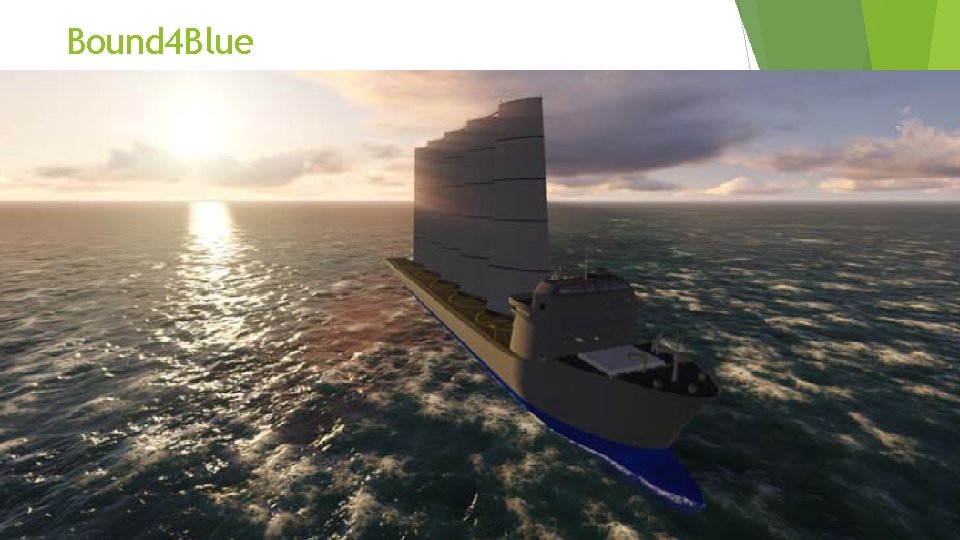
Bound 4 Blue
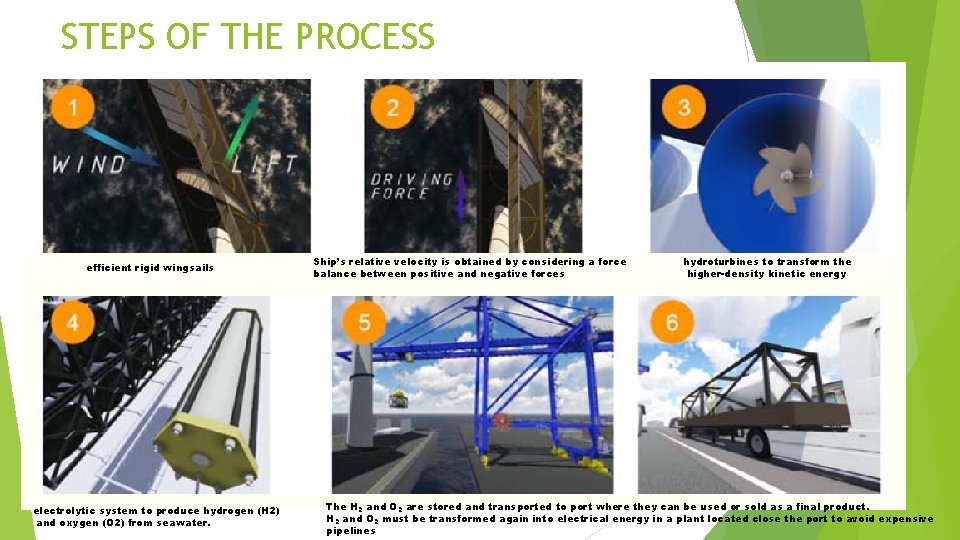
STEPS OF THE PROCESS efficient rigid wingsails electrolytic system to produce hydrogen (H 2) and oxygen (O 2) from seawater. Ship’s relative velocity is obtained by considering a force balance between positive and negative forces hydroturbines to transform the higher-density kinetic energy The H 2 and O 2 are stored and transported to port where they can be used or sold as a final product. H 2 and O 2 must be transformed again into electrical energy in a plant located close the port to avoid expensive pipelines
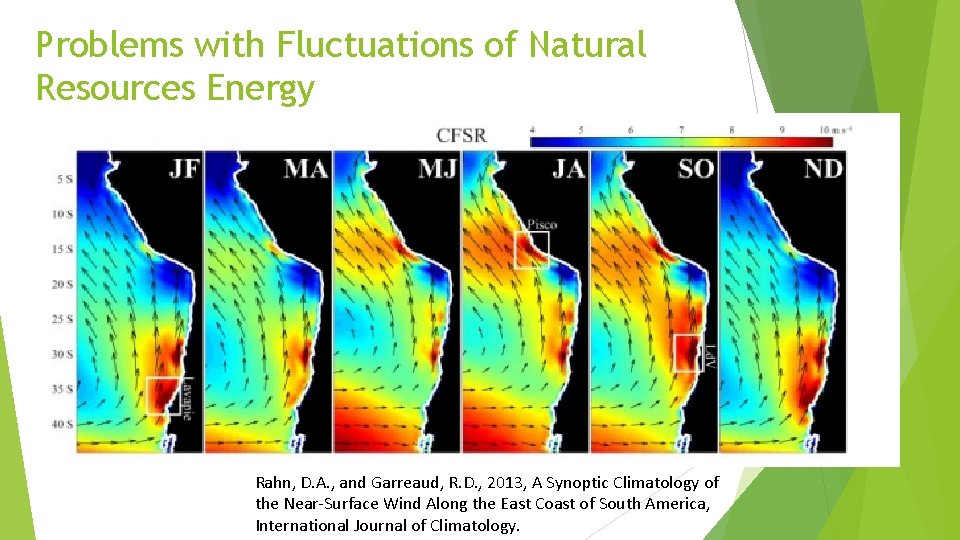
Problems with Fluctuations of Natural Resources Energy Rahn, D. A. , and Garreaud, R. D. , 2013, A Synoptic Climatology of the Near-Surface Wind Along the East Coast of South America, International Journal of Climatology.
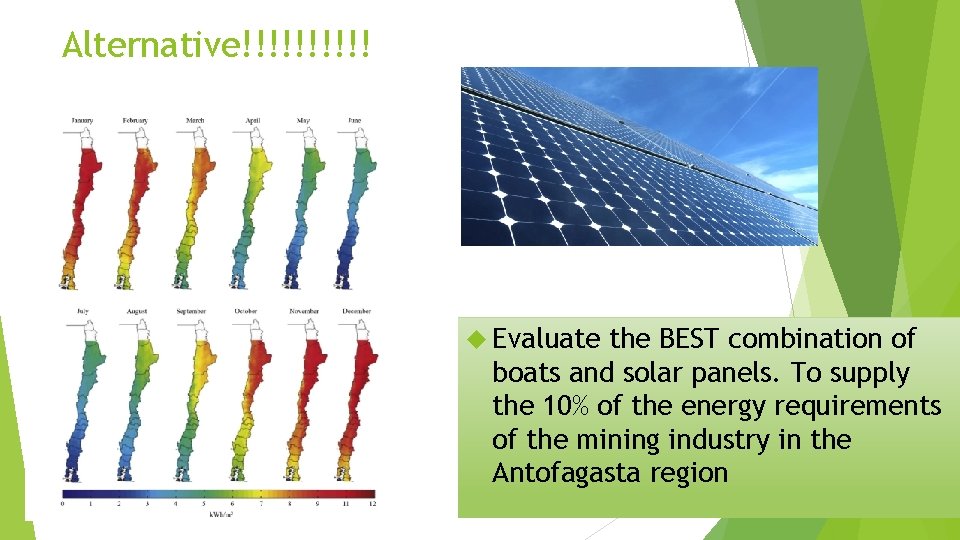
Alternative!!!!! Evaluate the BEST combination of boats and solar panels. To supply the 10% of the energy requirements of the mining industry in the Antofagasta region
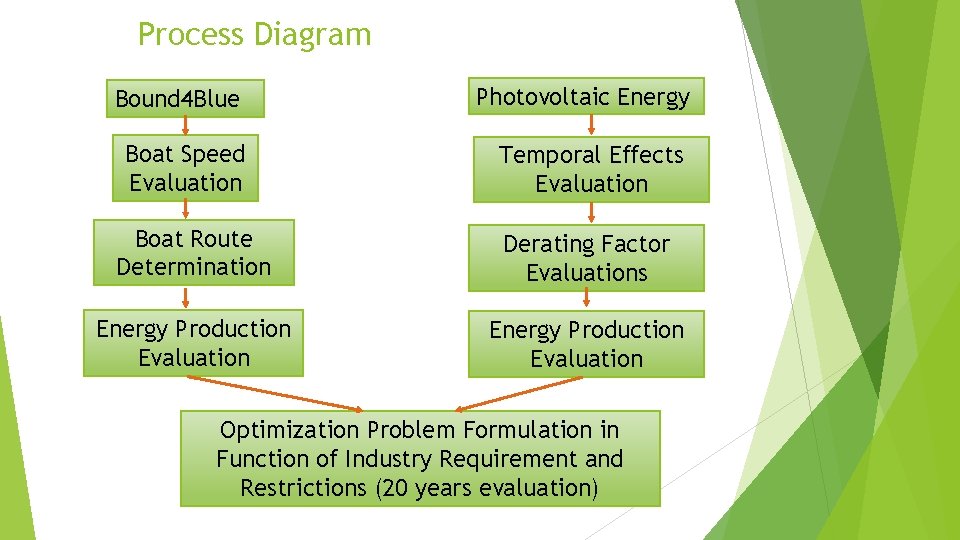
Process Diagram Bound 4 Blue Photovoltaic Energy Boat Speed Evaluation Temporal Effects Evaluation Boat Route Determination Derating Factor Evaluations Energy Production Evaluation Optimization Problem Formulation in Function of Industry Requirement and Restrictions (20 years evaluation)
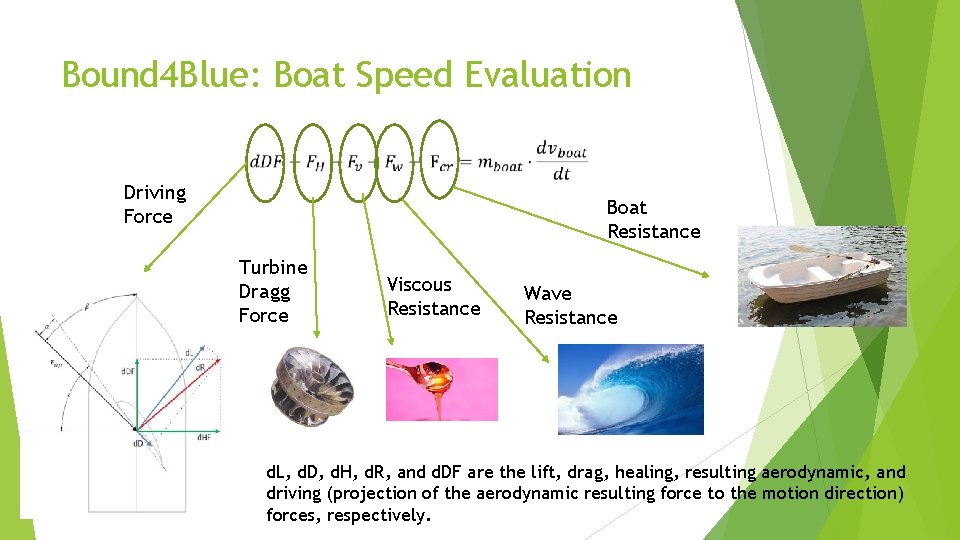
Bound 4 Blue: Boat Speed Evaluation Driving Force Boat Resistance Turbine Dragg Force Viscous Resistance Wave Resistance d. L, d. D, d. H, d. R, and d. DF are the lift, drag, healing, resulting aerodynamic, and driving (projection of the aerodynamic resulting force to the motion direction) forces, respectively.
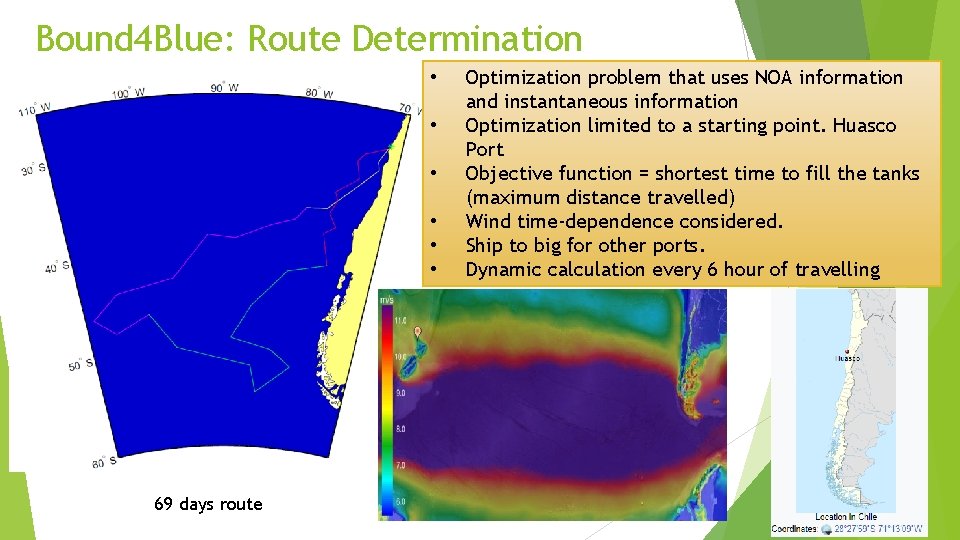
Bound 4 Blue: Route Determination • • • 69 days route Optimization problem that uses NOA information and instantaneous information Optimization limited to a starting point. Huasco Port Objective function = shortest time to fill the tanks (maximum distance travelled) Wind time-dependence considered. Ship to big for other ports. Dynamic calculation every 6 hour of travelling
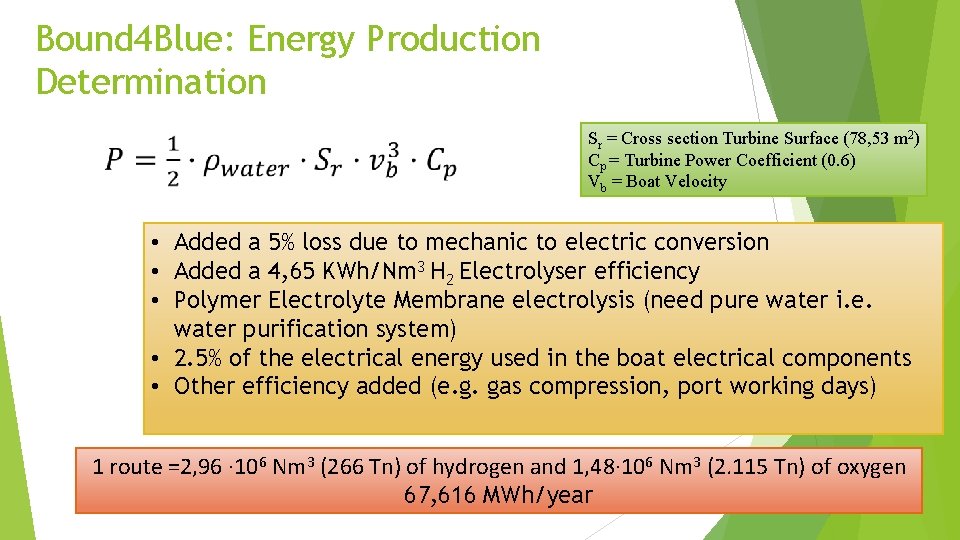
Bound 4 Blue: Energy Production Determination Sr = Cross section Turbine Surface (78, 53 m 2) Cp = Turbine Power Coefficient (0. 6) Vb = Boat Velocity • Added a 5% loss due to mechanic to electric conversion • Added a 4, 65 KWh/Nm 3 H 2 Electrolyser efficiency • Polymer Electrolyte Membrane electrolysis (need pure water i. e. water purification system) • 2. 5% of the electrical energy used in the boat electrical components • Other efficiency added (e. g. gas compression, port working days) 1 route =2, 96 · 106 Nm 3 (266 Tn) of hydrogen and 1, 48· 106 Nm 3 (2. 115 Tn) of oxygen 67, 616 MWh/year
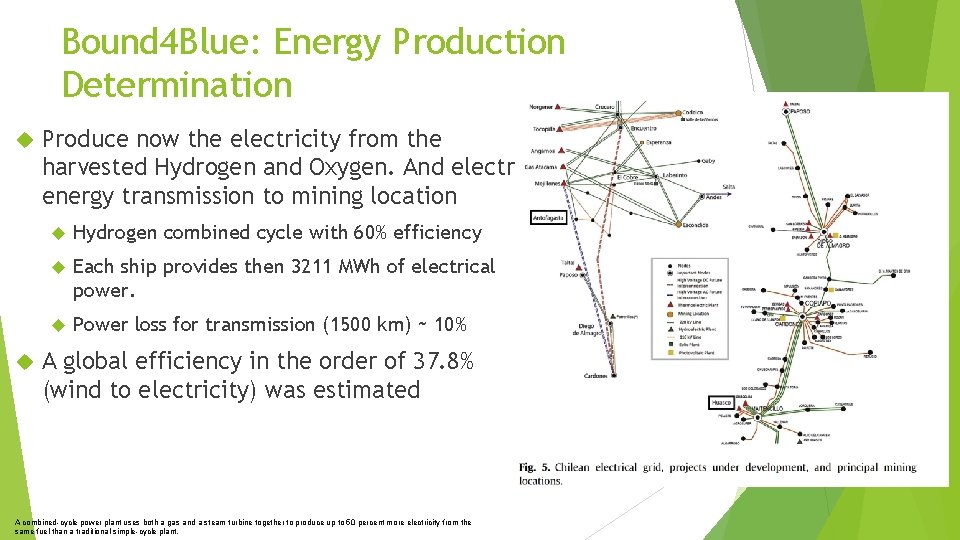
Bound 4 Blue: Energy Production Determination Produce now the electricity from the harvested Hydrogen and Oxygen. And electric energy transmission to mining location Hydrogen combined cycle with 60% efficiency Each ship provides then 3211 MWh of electrical power. Power loss for transmission (1500 km) ~ 10% A global efficiency in the order of 37. 8% (wind to electricity) was estimated A combined-cycle power plant uses both a gas and a steam turbine together to produce up to 50 percent more electricity from the same fuel than a traditional simple-cycle plant.
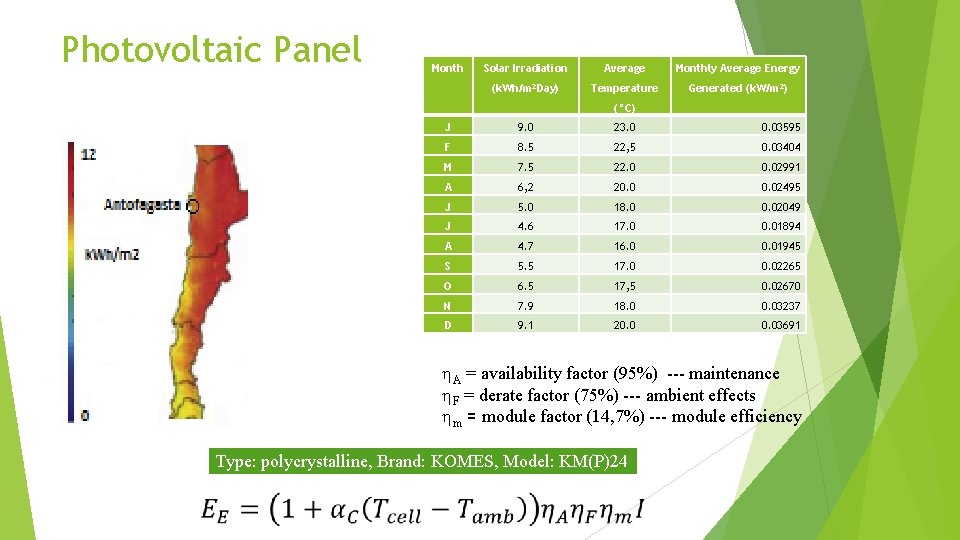
Photovoltaic Panel Month Solar Irradiation Average Monthly Average Energy (k. Wh/m 2 Day) Temperature Generated (k. W/m 2) (°C) J 9. 0 23. 0 0. 03595 F 8. 5 22, 5 0. 03404 M 7. 5 22. 0 0. 02991 A 6, 2 20. 02495 J 5. 0 18. 0 0. 02049 J 4. 6 17. 0 0. 01894 A 4. 7 16. 0 0. 01945 S 5. 5 17. 0 0. 02265 O 6. 5 17, 5 0. 02670 N 7. 9 18. 0 0. 03237 D 9. 1 20. 03691 A = availability factor (95%) --- maintenance F = derate factor (75%) --- ambient effects m = module factor (14, 7%) --- module efficiency Type: polycrystalline, Brand: KOMES, Model: KM(P)24
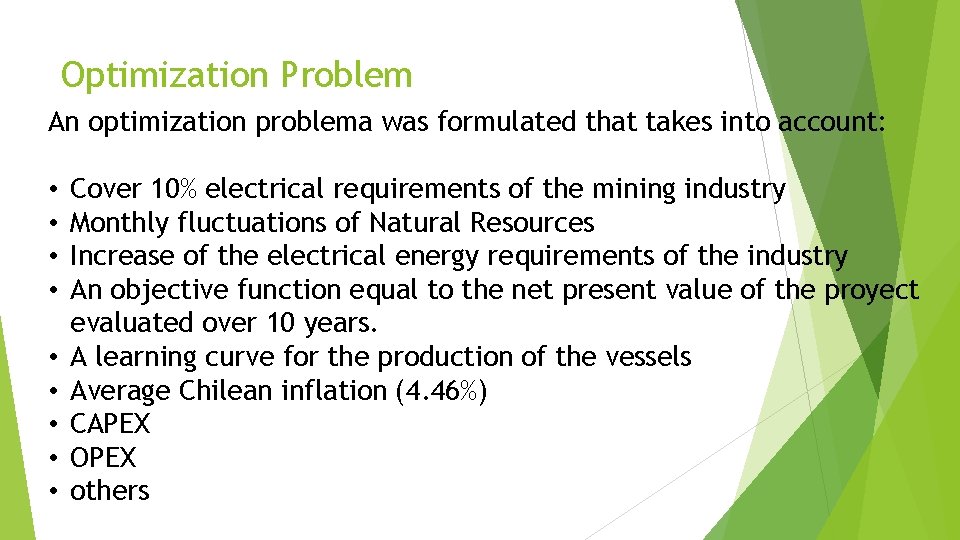
Optimization Problem An optimization problema was formulated that takes into account: • • • Cover 10% electrical requirements of the mining industry Monthly fluctuations of Natural Resources Increase of the electrical energy requirements of the industry An objective function equal to the net present value of the proyect evaluated over 10 years. A learning curve for the production of the vessels Average Chilean inflation (4. 46%) CAPEX OPEX others
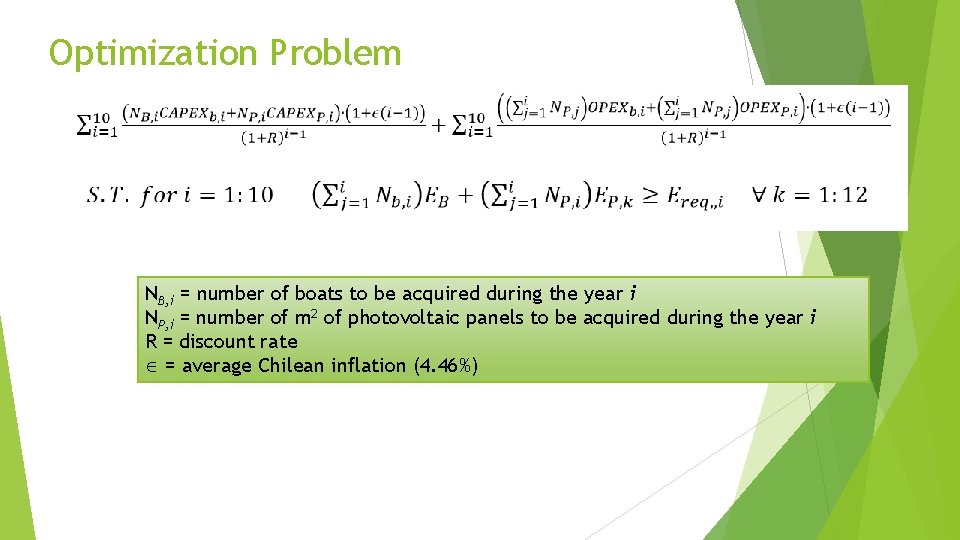
Optimization Problem NB, i = number of boats to be acquired during the year i NP, i = number of m 2 of photovoltaic panels to be acquired during the year i R = discount rate = average Chilean inflation (4. 46%)
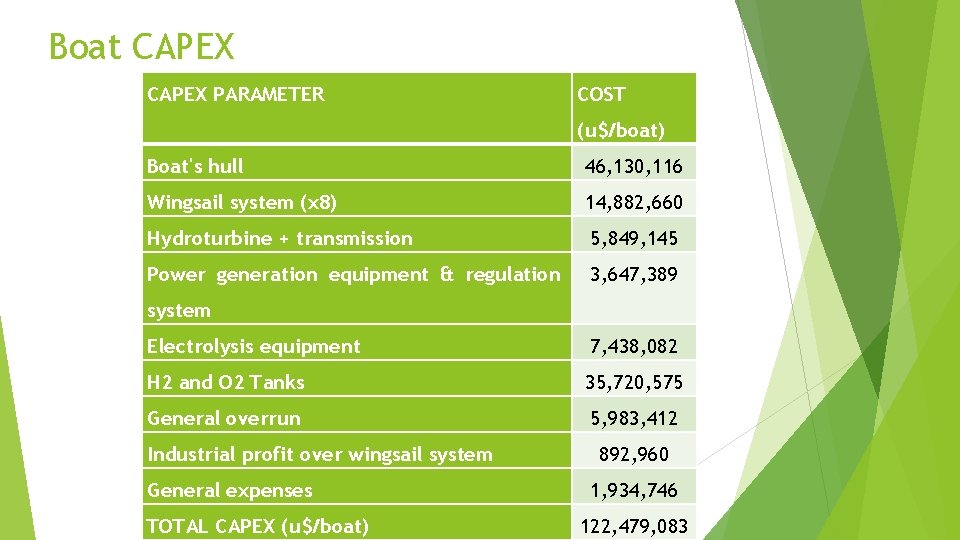
Boat CAPEX PARAMETER COST (u$/boat) Boat's hull 46, 130, 116 Wingsail system (x 8) 14, 882, 660 Hydroturbine + transmission 5, 849, 145 Power generation equipment & regulation 3, 647, 389 system Electrolysis equipment 7, 438, 082 H 2 and O 2 Tanks 35, 720, 575 General overrun 5, 983, 412 Industrial profit over wingsail system General expenses TOTAL CAPEX (u$/boat) 892, 960 1, 934, 746 122, 479, 083
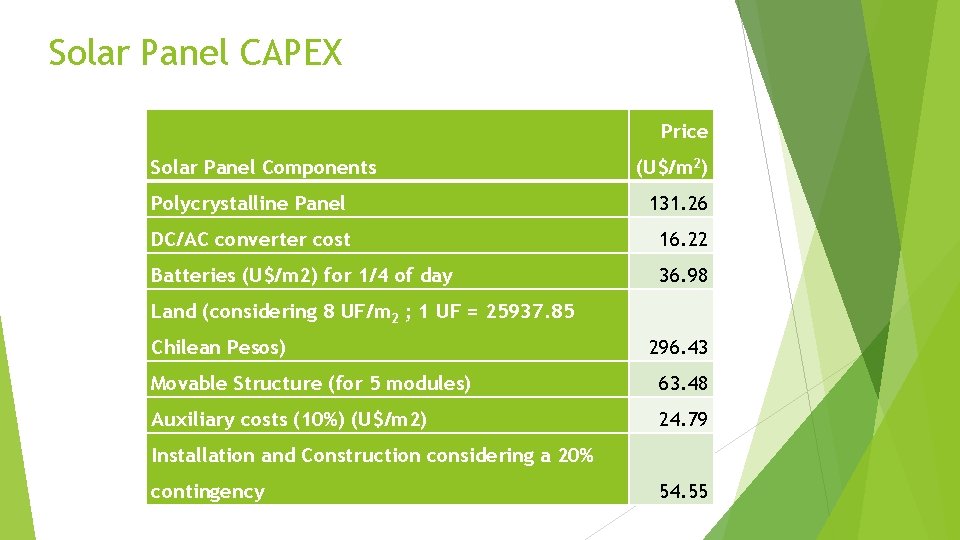
Solar Panel CAPEX Price Solar Panel Components (U$/m 2) Polycrystalline Panel 131. 26 DC/AC converter cost 16. 22 Batteries (U$/m 2) for 1/4 of day 36. 98 Land (considering 8 UF/m 2 ; 1 UF = 25937. 85 Chilean Pesos) 296. 43 Movable Structure (for 5 modules) 63. 48 Auxiliary costs (10%) (U$/m 2) 24. 79 Installation and Construction considering a 20% contingency 54. 55
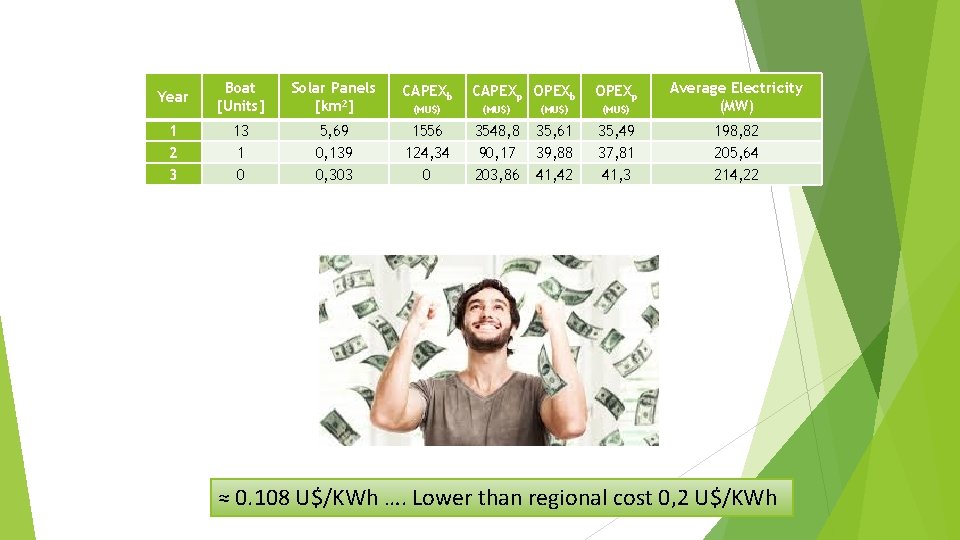
Year Boat [Units] Solar Panels [km 2] CAPEXb (MU$) Average Electricity (MW) 1 2 3 13 1 0 5, 69 0, 139 0, 303 1556 124, 34 0 3548, 8 90, 17 203, 86 35, 61 39, 88 41, 42 35, 49 37, 81 41, 3 198, 82 205, 64 214, 22 CAPEXp OPEXb OPEXp ≈ 0. 108 U$/KWh …. Lower than regional cost 0, 2 U$/KWh

Bound 4 Blue
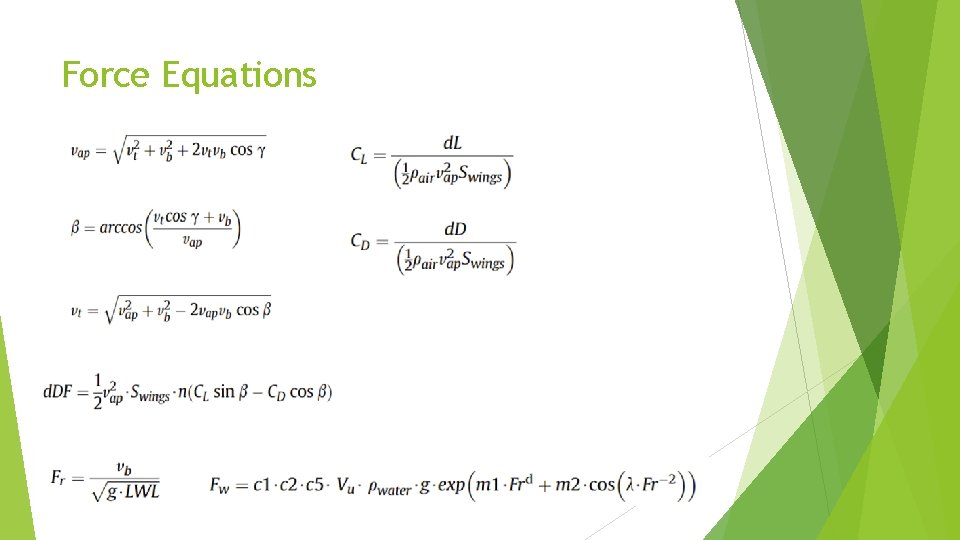
Force Equations
- Slides: 22