Optimization of Laser Deposited Rapid Tooling D Schwam


 Composite Core: Steel (H 13) Casting (A")
 Mold close, Metal Injection and Solidification")


- Slides: 31
Optimization of Laser Deposited Rapid Tooling D. Schwam and Y. Wang Case Western Reserve University NADCA DMC, Chicago – Feb. 17, 2010 1
Outline • Objectives-why laser deposit? • The POM process • Preliminary thermal fatigue results • In-plant evaluation of cores at General Die Casters • FEA optimization of laser deposited layer • Conclusions 2
Objectives – why laser deposit? • Use of high thermal conductivity alloys in cores and inserts can accelerate heat extraction, lower surface temperature reduce soldering and shorten cycle time. • Copper alloys have good thermal conductivity and are cost effective candidates for this application. • However, copper alloys dissolve in molten aluminum. High temperature and high velocity molten metal flow exacerbate dissolution. • A layer of laser deposited H 13 over the copper can prevent dissolution. 3
Washout Damage at the Corners of Cu-Ni-Sn Thermal Fatigue Specimens Tough. Met 3 Tough. Met 2 0. 5” Tough. Met 2 Copper alloys dissolve in molten aluminum
Metal Mold Material Properties
Rapid Tooling by DMD Direct Metal Deposition of H 13 on Copper - the POM Method *-Courtesy POM
H 13 / H 13 sample – as deposited/ finished H 13 / Alloy 940 sample – as deposited/ finished
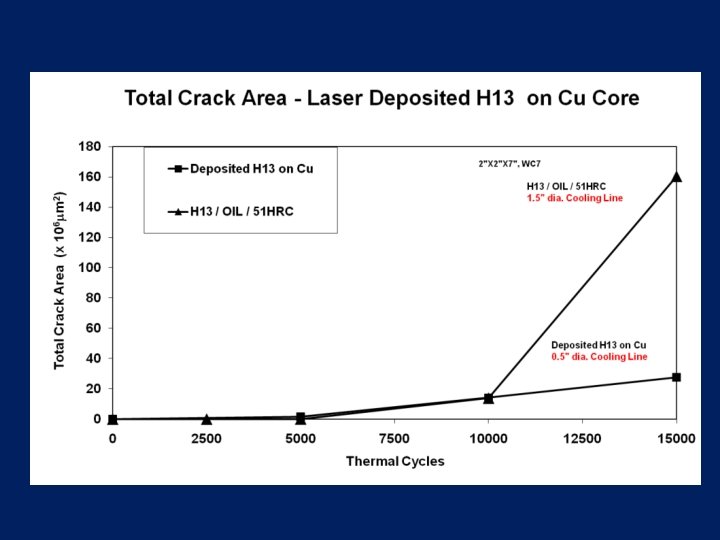
Evaluation of Laser Deposited Cores The core is surrounded by molten aluminum and has a record of overheating and soldering. Extracting heat more efficiently from the core can lower maximum temperature, prevent soldering and allow shorter cycle times. 9
Typical H 13 core with cooling line 10
Composite Core -- H 13 Deposited on Cu H 13 Cu 11
Thermal Profile of Cover Half Steel During Solidification H-13 Core Composite Core At start of a cycle 12
Thermal Profile of Section Through Cover Half at Die Opening H-13 Core Composite Core At 20 seconds • Temperature of Composite Core is lower. 13
Temperature Advantage of the Copper Core • Temperature of Composite Core is lower. 14
Creep Failure of in First Composite Core The core shows creep damage after 250 cycles due to insufficient stiffness and strength at high temperature. 15
Surface Cracks in the H 13 Layer 16
Remedial Approaches Caves in Bulges out The distortion of the core seems to originate from insufficient strength and stiffness at the operating temperature. Anviloy and H 13 cores do not suffer from this problem. Priority 1 - Increase strength: use core as deposited w/o tempering (downside-lower toughness). Priority 2 - Increase thickness of H 13 layer(downside slows down heat transfer).
Optimization of the Laser Deposited H 13 • The first core was tempered aggressively. The hardness of the laser deposited H 13 was reduced from 51 HRC to 40 HRC to improve toughness. However, this reduced the strength and caused excessive distortion. The core had to be removed after 250 shots. • A new core was made with the laser deposited H 13 in the as-deposited condition (no tempering) at 51 HRC. • This core has been in production at General Die Casters. So far it has accumulated 5, 000 shots. 18
FEA optimization of the H 13 laser deposited layer thickness • The 3 D Die Casting model was simplified to a 2 D axisymmetric FEA model and analyzed with commercial FEA software Abaqus. • The accuracy of 2 D Abaqus analysis was verified by comparing it to a 3 D Magma. Soft simulation. • Cyclic heat transfer and stress analysis was applied to study the failure mechanism of the composite core. • Composite cores with different H 13 layer thickness and hardness were compared, to optimize the design. 19
Finite Element Analysis Model Mold (H 13) Composite Core: Steel (H 13) Casting (A 389) Copper (394) 2 D Axi-symmetric model 20
Boundary Conditions Process flow chart: Preheat (40 sec) Mold close, Metal Injection and Solidification (20 sec) Mold open, Ejection, air cooling (4 sec) Spray cooling (3 sec) Air cooling (13 sec) New cycle begins, each cycle takes 40 seconds. Simulation initial conditions Casting Alloy A 389 Mold Material H 13 Furnace Temperature Material plastic behavior 1350 o. F strain rate independent isotropic hardening Material stress-strain property definition: Stress Tensile strength Yield strength 0 Strain Elongation 21
Parameters studied Parameter 1 – H 13 hardness / strength: Label of different Yield strength at room hardness temperature (ksi) UTS at room temperature (ksi) HR 40 153 183 HR 50 239 289 ( Ref: Philip D. Harvey, Engineering Properties of Steel, American Society for Metals, Metal Parks, Ohio, 1982, P 457 -462. ) Parameter 2 – Thickness of the H 13 layer: Label of different designs Thickness of H 13 in composite core Core 050 0. 05 in Core 100 0. 1 in Core 150 0. 15 in 22
Verification of Axi-symmetric FEA Heat Transfer Analysis* • Maximum temperature difference is smaller than 20 o. C. * Abaqus compared to Magma. Soft 23
Thermo-mechanical Analysis for Core 100 with H 13 -HR 40 A B C Temperature and stress fields become stable after five cycles. Edge, 1” from corner 24
Thermo-mechanical Analysis for Core 100 Dominant factors in deformation: • The thermal gradient at the surface is a key factor in deformation and failure. I. Thermal gradient Temperature II. Thermal expansion mismatch Temperature III. Thermal gradient Temperature IV. Thermal expansion mismatch Temperature • Normal stress along the hoop’direction is the largest. B 2 3 1 25
Thermo-mechanical analysis findings • The temperature and stress fields become stable in about five cycles. • The thermal gradient at the surface is the key factor to deformation and failure. • Normal stresses in the hoop direction are largest at the surface , and may cause surface cracks. • The failure mechanism depends on the maximum stress and whether it exceeds the material strength at the operating temperature. 26
Type I Failure Mechanism – Creep • When strength is low (ex. H 13 -HR 40). • Buckling occurs due to plastic deformation. • σyield << σmax ~ UTS • Improving material strength will • Plastic deformation accumulates rapidly. prevent this failure mechanism. 2 3 1 Core 100 H 13 -HR 40/ Copper Core after 250 cycles 27
Type II Failure - Low cycle fatigue • When strength is high (ex. H 13 -HR 50). • σyield <σmax < UTS • Plastic deformation accumulates slowly. • The number of cycles (N) to failure can be predicted by an empirical model: Normal stress (ksi) • Radial surface cracks occur due to low cyclic fatigue. 200 150 100 50 ΔS 0 -50 -100 0 10 20 30 40 Time (second) normal stress along hoop's direction 28
Factors that determine low cycle fatigue life Fatigue life N Stress variation ΔS Normal stress (ksi) 200 150 100 50 ΔS=σmax-σmin 0 -50 -100 Surface thermal gradient 0 10 20 30 Time (second) 40 normal stress along hoop's direction Temperature variation ΔT Detailed analysis Higher conductivity for thinner H 13 layer thickness Not linear relationship to H 13 thickness Temperature (o. F) Core thermal conductivity α 1000 900 800 700 600 500 400 300 200 100 0 ΔT 2 ΔT 1 0 10 20 Time (second) Temperature 30 40 29
The Effect of layer thickness on the low cycle fatigue life of the composite core Fatigue life for typical H 13 Core The design of composite core with 0. 05” thick H 13 -HR 50 layer offers: • Lower max temperature; • Longer fatigue life. 30
Summary • A pre-requisite to prevent premature failure is sufficient strength to avoid creep. • A 0. 050” thick H 13 -HR 50 layer provides a good balance of heat transfer and thermal fatigue resistance: – Maximizes heat flux, decreasing mold temperature, and shortening cycle time. – Reduces thermal gradient, lowering maximum stress and extending core life. 31