
Optimization for Sustainable Water Resources Management OPTIMA Presentation
Optimization for Sustainable Water Resources Management (OPTIMA) Presentation of Jordan Case Study Zarqa River Basin to the Third Management Board Meeting May 18 -19, 2006 Gumpoldskirchen, Austria
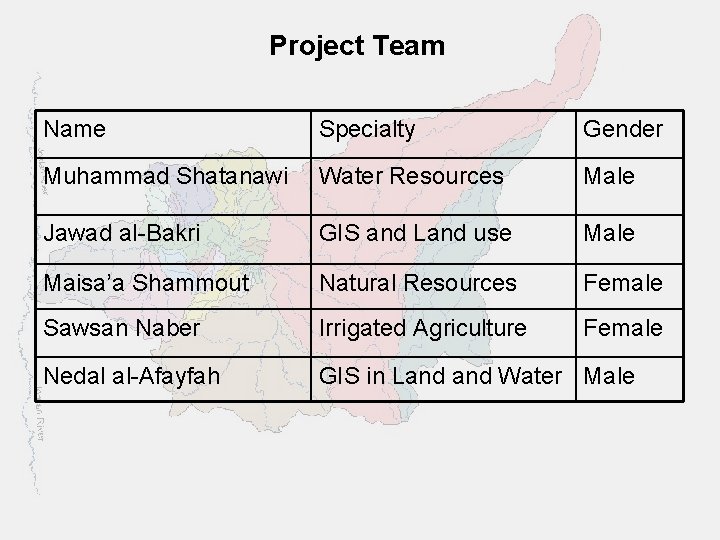
Project Team Name Specialty Gender Muhammad Shatanawi Water Resources Male Jawad al-Bakri GIS and Land use Male Maisa’a Shammout Natural Resources Female Sawsan Naber Irrigated Agriculture Female Nedal al-Afayfah GIS in Land Water Male
Contribution to WP 01 Requirements and Constraints FEEM Level of Efforts by UJO 2 m/m Activities: ü Stakeholders were identified ü Gender information were obtained ü Source of information were identified ü Data availability against requirements were defined ü Data constrains were identified Status: ü D 01 (D 1. 1 and D 1. 2) were submitted by FEEM
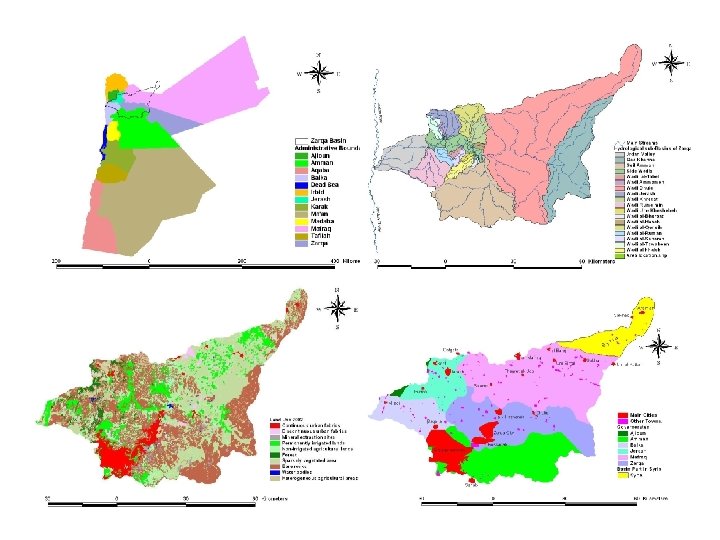
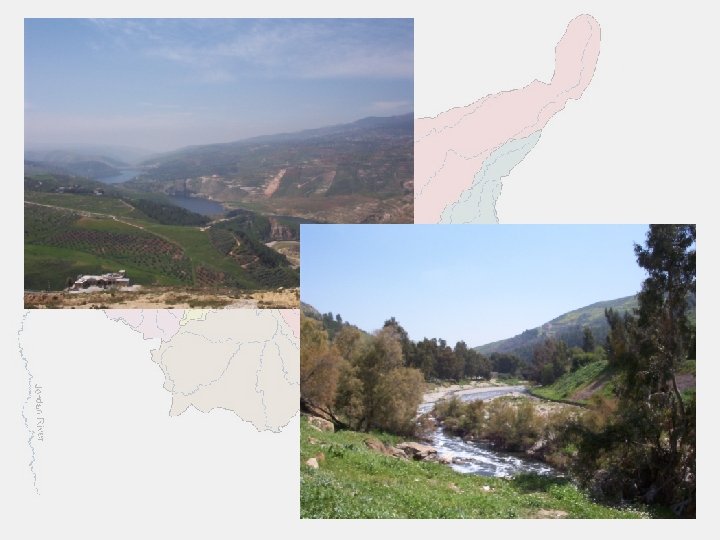
Contribution to WP 02 Socio-Economic frame work; objectives, criteria and indicators IRMCO Level of Efforts by UJO 1 m/m Activities: ü Hydrological Map, Main Cities and Towns, Land Use of 2002, The location of the Basin in Jordan and some photos were sent to IRMCO for the Poster. ü Challenges, water issues, gender issues and other related information were also sent Status: ü D 02 were submitted by IRMCO
Contribution to WP 03 Analytical tools: simulation and optimization models ESS Level of Efforts by UJO 1 m/m Activities: ü Hydrological data were collected and used to validate the WRM. ü Many problems were solved with the model using problem reporting. ü Wastewater treatment node needs to be treated not like geometry node. Status: ü D 03 were submitted by ESS
Contribution to WP 04 Techno-economic data compilation and analysis INTERGEO Level of Efforts by UJO 1 m/m Activities: ü The link to this WP has been opened ü Needs time to understand enter required data. ü Many items were found missing; need updating regarding technologies used in UJO CS. Status: ü D 04 (D 4. 1 and D 4. 2) are due in July 2006
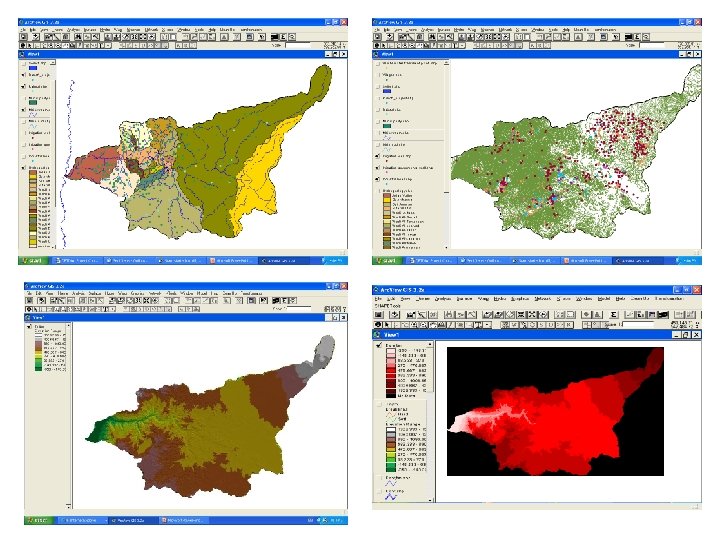
Contribution to WP 05 Land use change: remote sensing and GIS data NCRS Level of Efforts by UJO 1 m/m Activities: Ø GIS data for the followings were sent to NCRS: DEM, TIN, LU 2002, area location, contours, wells, surface water bodies, administration boundaries, cities, towns and villages, main roads, streams, soils, rainfall and metrological stations, runoff gages, wastewater treatment plants. Status: ü D 05 (D 5. 1) is due in July 2006
Contribution to WP 06 System integration and implementation ESS Level of Efforts by UJO 1 m/m Activities: ü Able to use the WRM from web server at ESS. ü Use the forum, problem reporting, access to deliverable and other tools. Status: ü D 06 (D 6. 1) is due in July 2006
Contribution to WP 10 Jordan Case study: Zarqa River Basin UJO Level of Efforts by UJO 30 m/m Activities: ü The basin was divided into 6 sub-basin considering topography, rainfall variation and urbanization. ü Water supply for each sub-basin was obtained or determined in quantity, time series and location ü Water Demand for each sub-basin was obtained or determined in time series and in quantity for each sector.
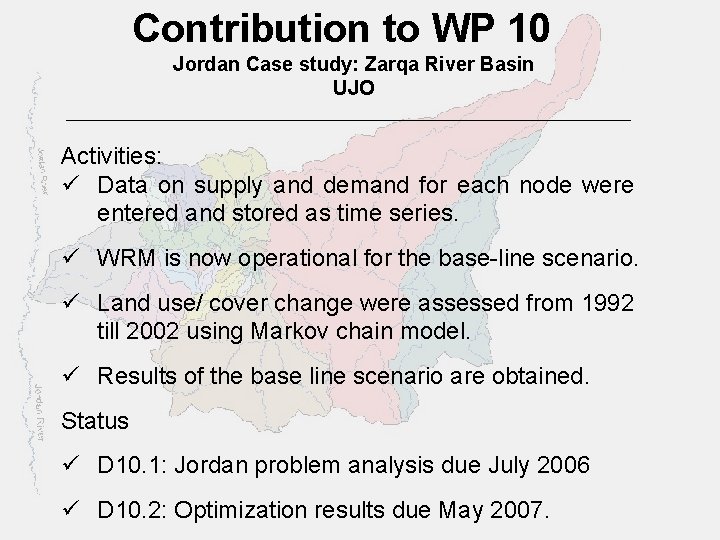
Contribution to WP 10 Jordan Case study: Zarqa River Basin UJO Activities: ü Data on supply and demand for each node were entered and stored as time series. ü WRM is now operational for the base-line scenario. ü Land use/ cover change were assessed from 1992 till 2002 using Markov chain model. ü Results of the base line scenario are obtained. Status ü D 10. 1: Jordan problem analysis due July 2006 ü D 10. 2: Optimization results due May 2007.
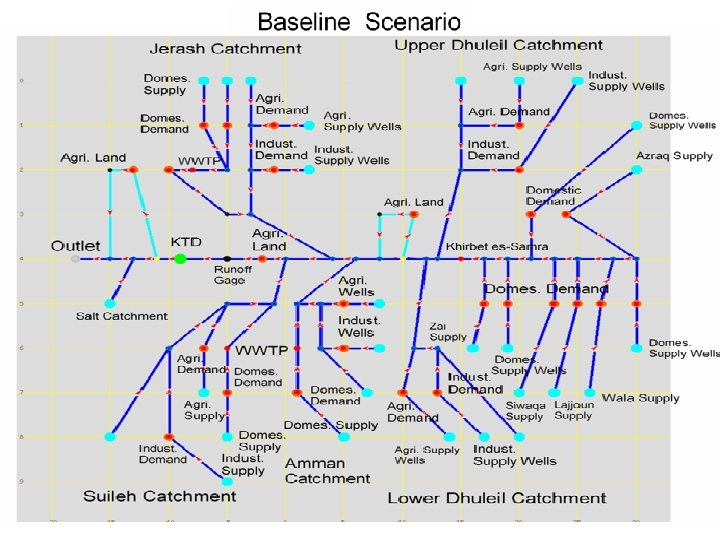
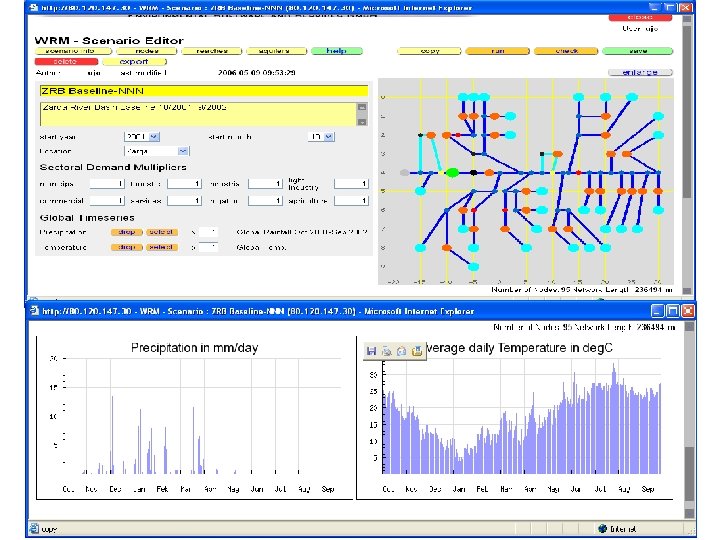
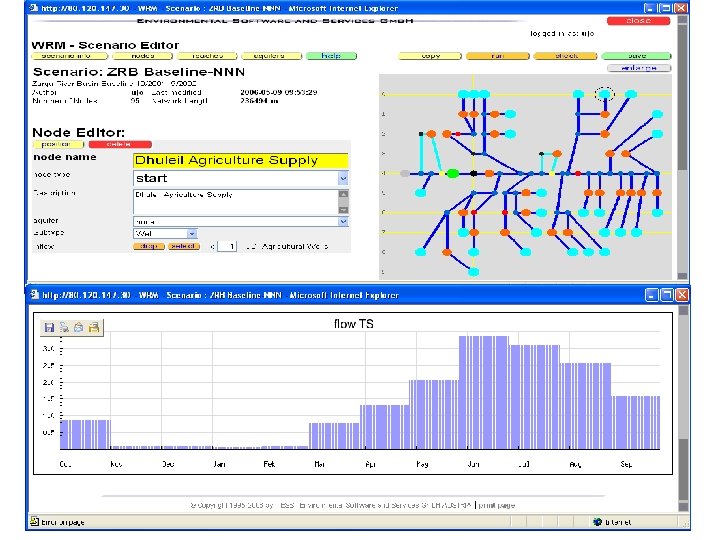
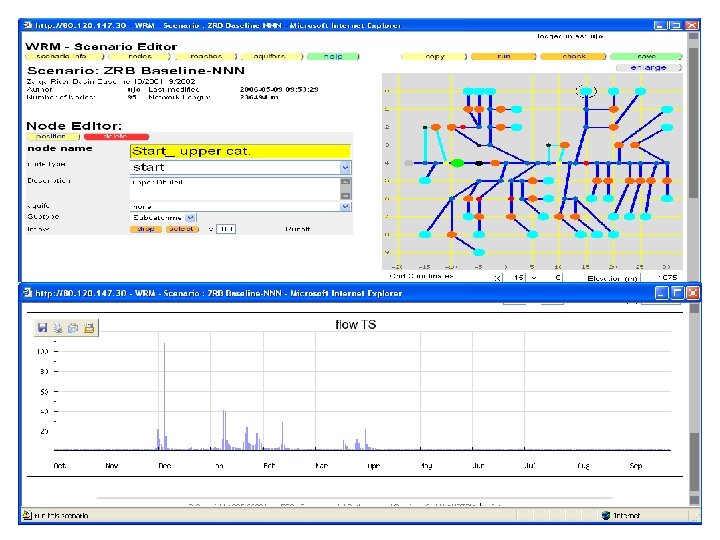
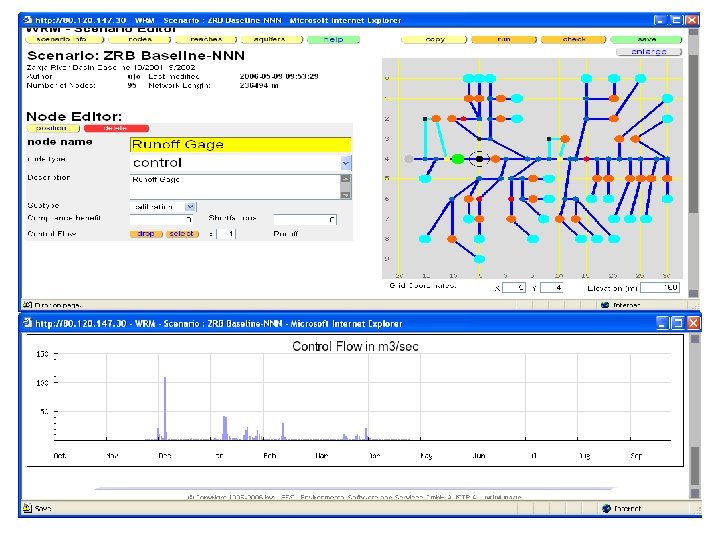
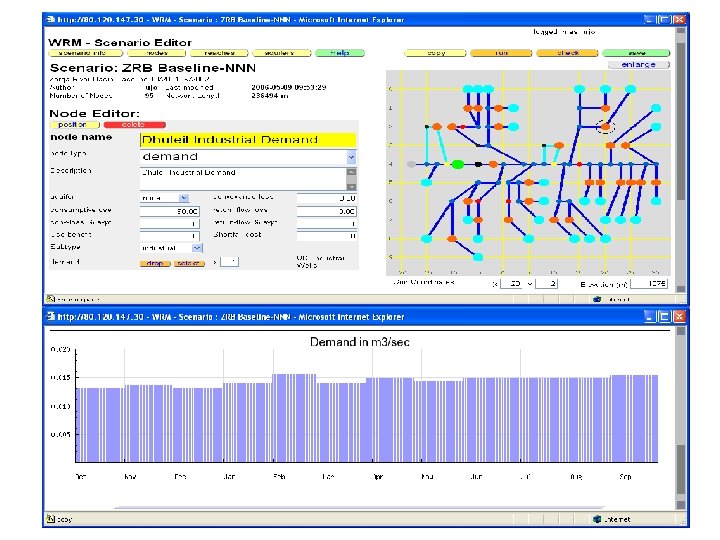
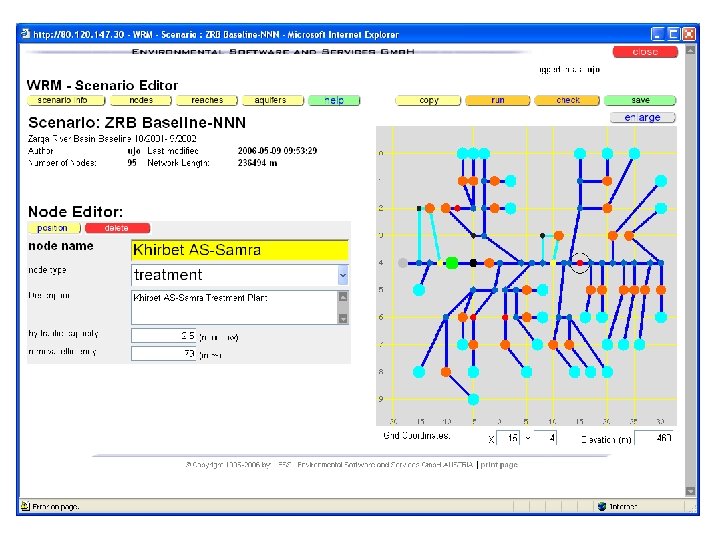
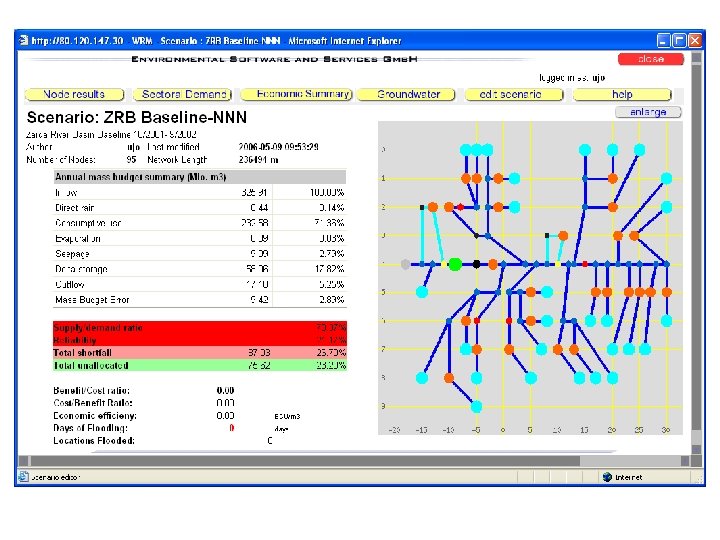
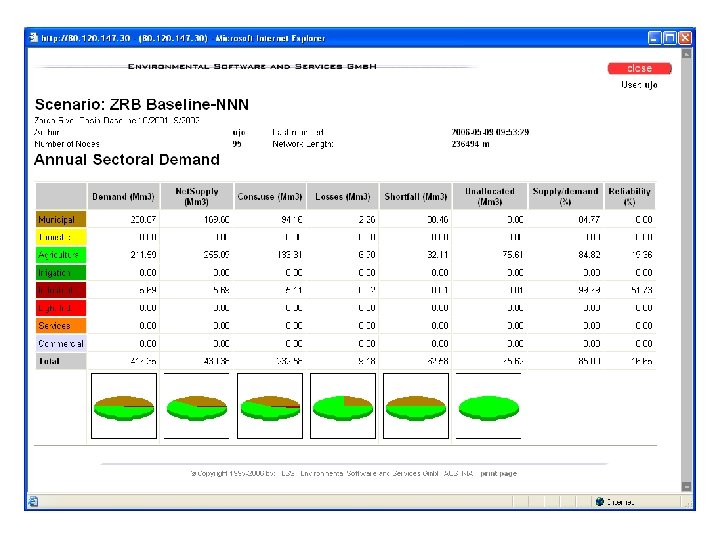
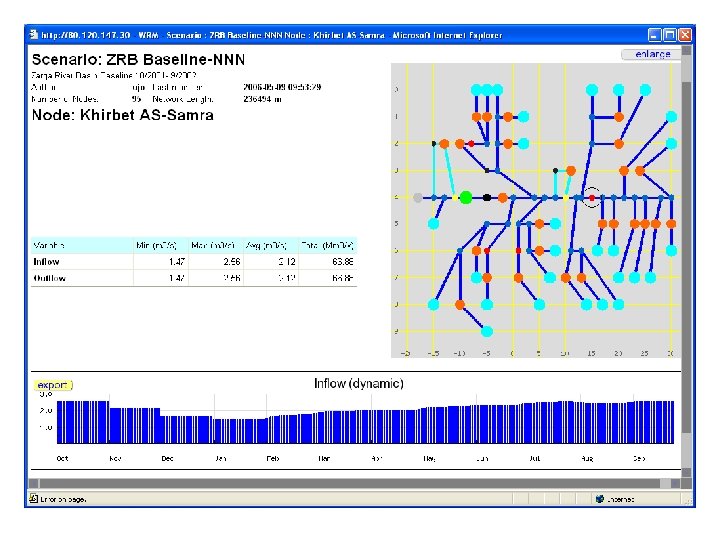
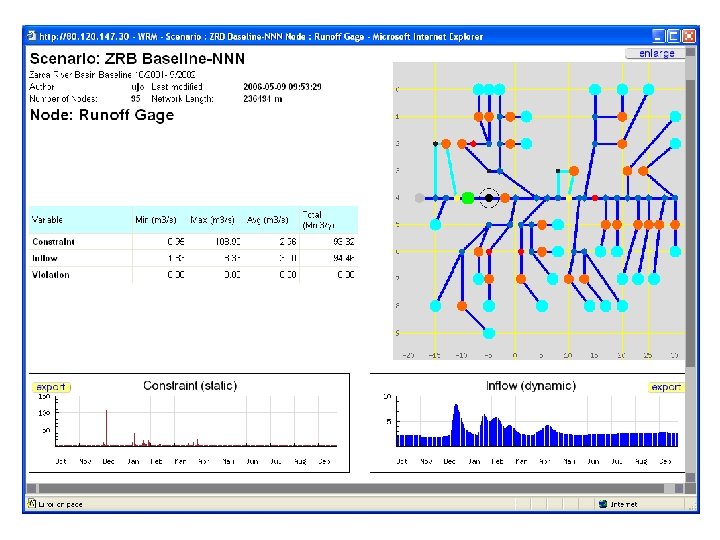
Contribution to WP 10 Case study: Zarqa River, Jordan Milestone: M 3 PM 18: • The case study have been implemented • WRM is operational for the baseline scenario • The results of the baseline scenario have been discussed with the stakeholders M 4 PM 24: • Analysis of optimization scenario will start after the 3 rd board meeting Performance: The baseline scenario has been defined based on compiling all data and operating all tools.
Contribution to WP 10 Case study: Zarqa River, Jordan Impact Indicator: ü The stakeholders expressed their satisfaction on the approach and results of the baseline scenario. ü However, some constructive remarks have been raised and will be considered in the process of updating the scenario. ü The stakeholder have suggested some guidelines to build the future scenarios to be incorporated in the optimization strategy.
Land Use Changes
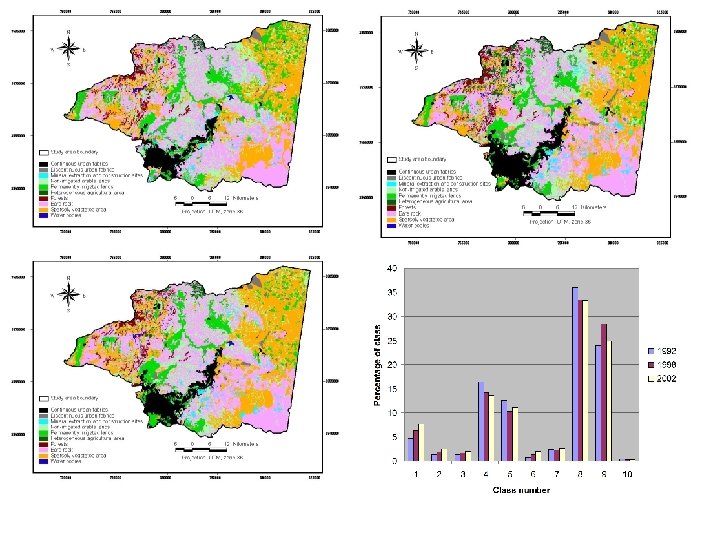
Land use/cover ü Visual interpretation of Landsat TM (1992, 1998 and 2002) following CORINE scheme ü GIS- analysis §Area of each LU/C §Transition matrices (probability of change) ü Prediction of future Land use in the basin: §Using Markov chain §Based on the rate of change in the period 19922002.
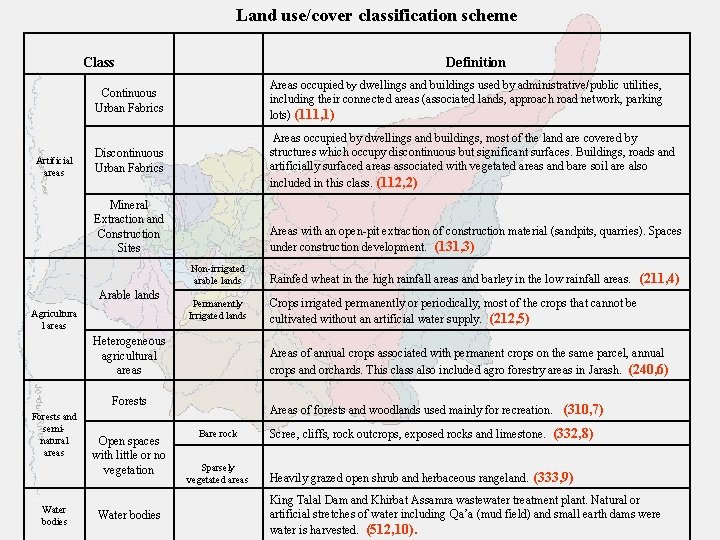
Land use/cover classification scheme Class Artificial areas Definition Continuous Urban Fabrics Areas occupied by dwellings and buildings used by administrative/public utilities, including their connected areas (associated lands, approach road network, parking lots) (111, 1) Discontinuous Urban Fabrics Areas occupied by dwellings and buildings, most of the land are covered by structures which occupy discontinuous but significant surfaces. Buildings, roads and artificially surfaced areas associated with vegetated areas and bare soil are also included in this class. (112, 2) Mineral Extraction and Construction Sites Arable lands Agricultura l areas Areas with an open-pit extraction of construction material (sandpits, quarries). Spaces under construction development. (131, 3) Non-irrigated arable lands Rainfed wheat in the high rainfall areas and barley in the low rainfall areas. (211, 4) Permanently Irrigated lands Crops irrigated permanently or periodically, most of the crops that cannot be cultivated without an artificial water supply. (212, 5) Heterogeneous agricultural areas Areas of annual crops associated with permanent crops on the same parcel, annual crops and orchards. This class also included agro forestry areas in Jarash. (240, 6) Forests and seminatural areas Water bodies Open spaces with little or no vegetation Water bodies Areas of forests and woodlands used mainly for recreation. (310, 7) Bare rock Sparsely vegetated areas Scree, cliffs, rock outcrops, exposed rocks and limestone. (332, 8) Heavily grazed open shrub and herbaceous rangeland. (333, 9) King Talal Dam and Khirbat Assamra wastewater treatment plant. Natural or artificial stretches of water including Qa’a (mud field) and small earth dams were water is harvested. (512, 10).
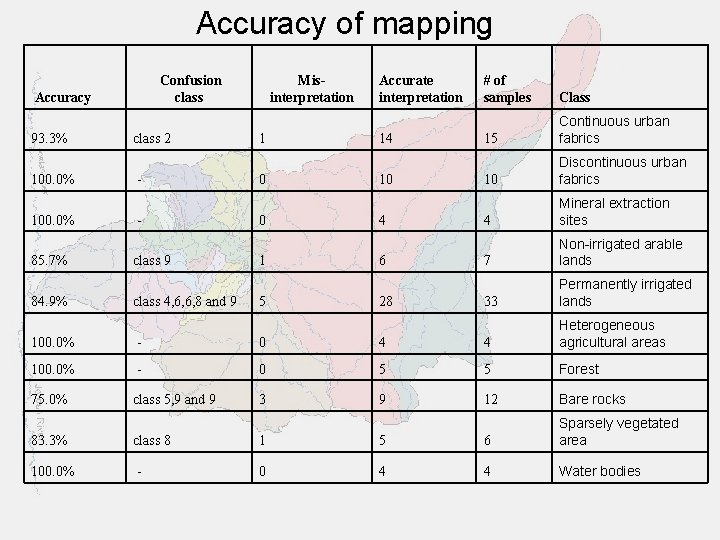
Accuracy of mapping Confusion class Accuracy 93. 3% 100. 0% 85. 7% 84. 9% class 2 class 9 class 4, 6, 6, 8 and 9 Misinterpretation 1 0 0 1 5 Accurate interpretation 14 10 4 6 28 # of samples Class 15 Continuous urban fabrics 10 Discontinuous urban fabrics 4 Mineral extraction sites 7 Non-irrigated arable lands 33 Permanently irrigated lands 100. 0% - 0 4 4 Heterogeneous agricultural areas 100. 0% - 0 5 5 Forest 75. 0% class 5, 9 and 9 3 9 12 Bare rocks 83. 3% class 8 1 5 6 Sparsely vegetated area 100. 0% - 0 4 4 Water bodies
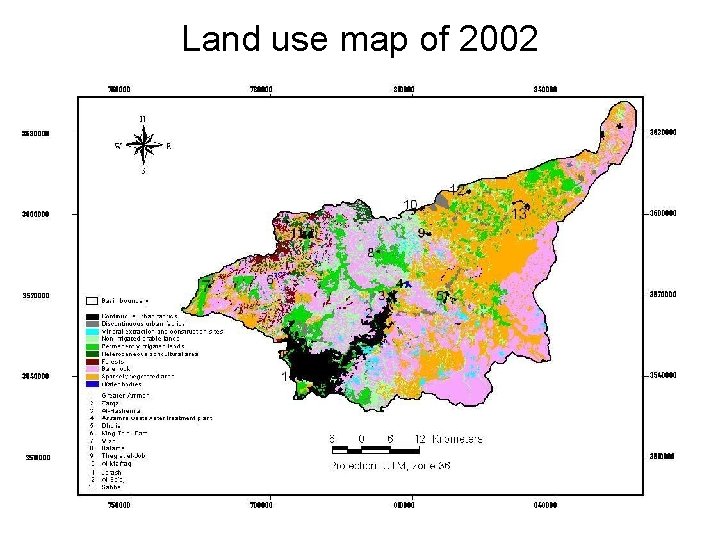
Land use map of 2002
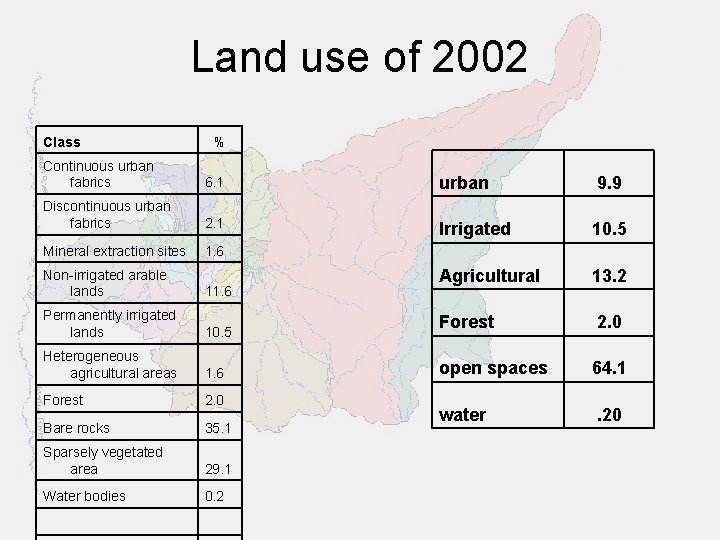
Land use of 2002 Class % Continuous urban fabrics 6. 1 urban 9. 9 Discontinuous urban fabrics 2. 1 Irrigated 10. 5 Mineral extraction sites 1. 6 Agricultural 13. 2 Forest 2. 0 open spaces 64. 1 water . 20 Non-irrigated arable lands 11. 6 Permanently irrigated lands 10. 5 Heterogeneous agricultural areas 1. 6 Forest 2. 0 Bare rocks 35. 1 Sparsely vegetated area 29. 1 Water bodies 0. 2
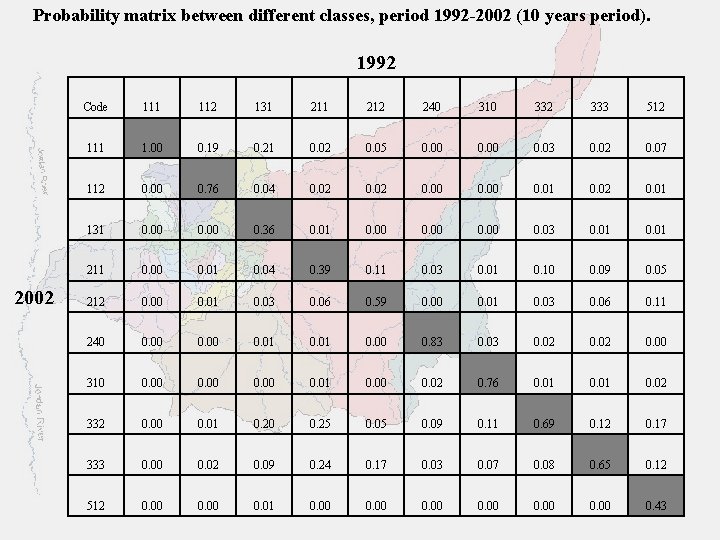
Probability matrix between different classes, period 1992 -2002 (10 years period). 1992 2002 Code 111 112 131 212 240 310 332 333 512 111 1. 00 0. 19 0. 21 0. 02 0. 05 0. 00 0. 03 0. 02 0. 07 112 0. 00 0. 76 0. 04 0. 02 0. 00 0. 01 0. 02 0. 01 131 0. 00 0. 36 0. 01 0. 00 0. 03 0. 01 211 0. 00 0. 01 0. 04 0. 39 0. 11 0. 03 0. 01 0. 10 0. 09 0. 05 212 0. 00 0. 01 0. 03 0. 06 0. 59 0. 00 0. 01 0. 03 0. 06 0. 11 240 0. 00 0. 01 0. 00 0. 83 0. 02 0. 00 310 0. 00 0. 01 0. 00 0. 02 0. 76 0. 01 0. 02 332 0. 00 0. 01 0. 20 0. 25 0. 09 0. 11 0. 69 0. 12 0. 17 333 0. 00 0. 02 0. 09 0. 24 0. 17 0. 03 0. 07 0. 08 0. 65 0. 12 512 0. 00 0. 01 0. 00 0. 43
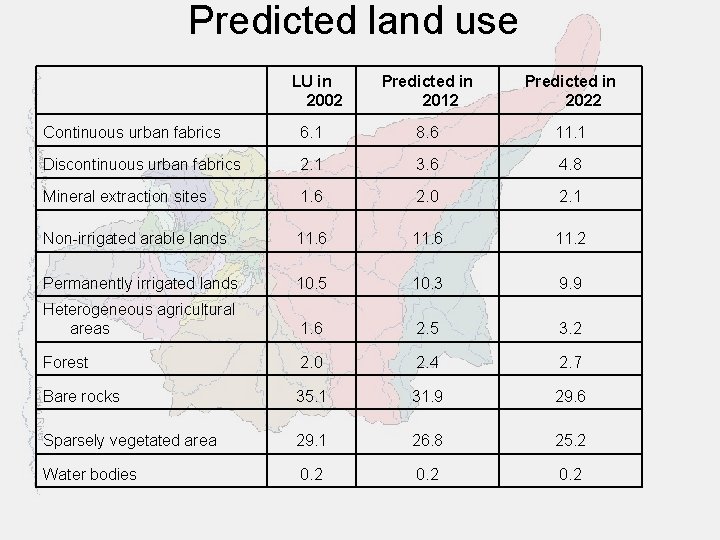
Predicted land use LU in 2002 Predicted in 2012 Predicted in 2022 Continuous urban fabrics 6. 1 8. 6 11. 1 Discontinuous urban fabrics 2. 1 3. 6 4. 8 Mineral extraction sites 1. 6 2. 0 2. 1 Non-irrigated arable lands 11. 6 11. 2 Permanently irrigated lands 10. 5 10. 3 9. 9 Heterogeneous agricultural areas 1. 6 2. 5 3. 2 Forest 2. 0 2. 4 2. 7 Bare rocks 35. 1 31. 9 29. 6 Sparsely vegetated area 29. 1 26. 8 25. 2 Water bodies 0. 2
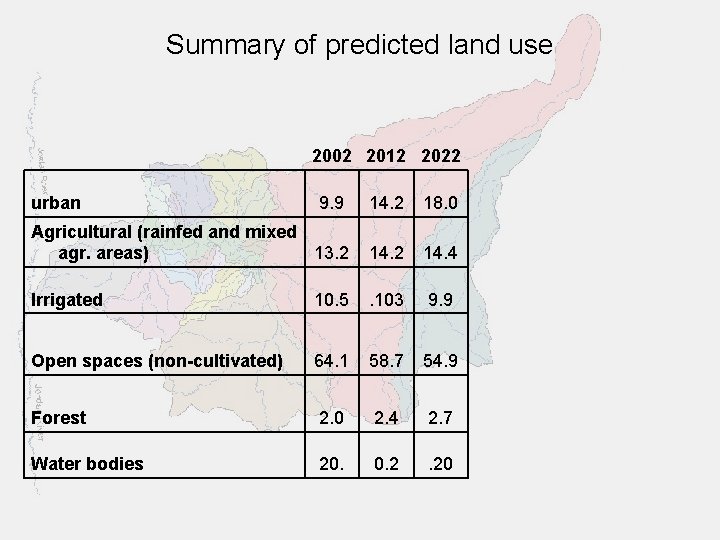
Summary of predicted land use 2002 2012 2022 urban 9. 9 14. 2 18. 0 Agricultural (rainfed and mixed agr. areas) 13. 2 14. 4 Irrigated 10. 5 . 103 9. 9 Open spaces (non-cultivated) 64. 1 58. 7 54. 9 Forest 2. 0 2. 4 2. 7 Water bodies 20. 0. 2 . 20
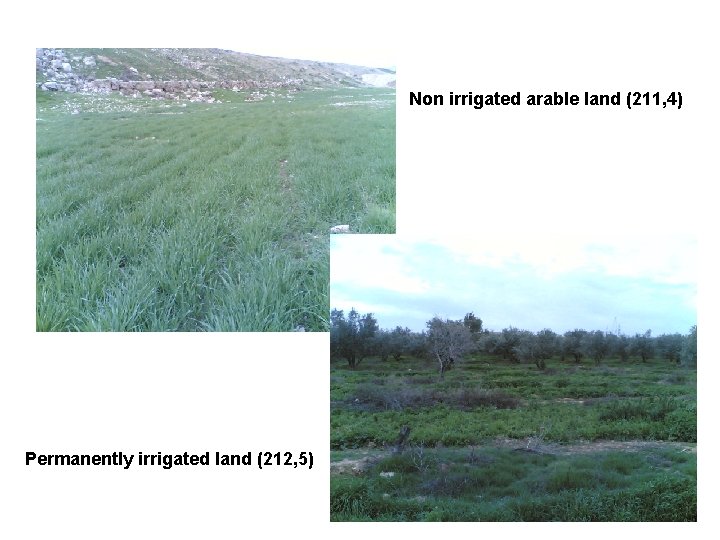
Non irrigated arable land (211, 4) Permanently irrigated land (212, 5)
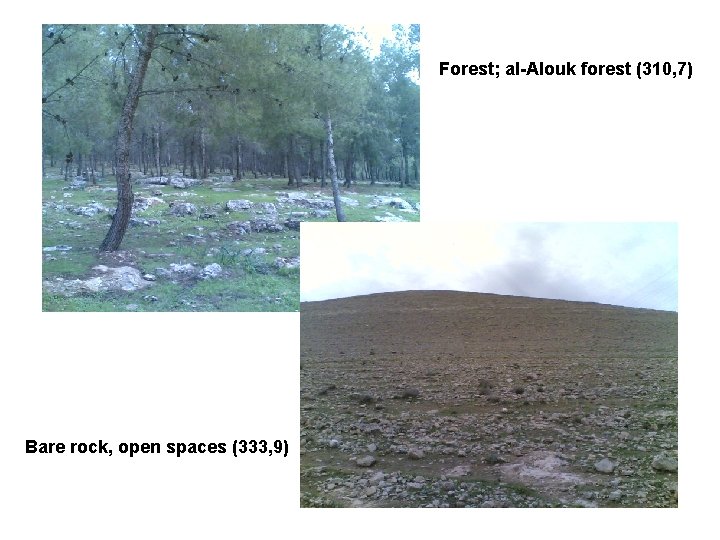
Forest; al-Alouk forest (310, 7) Bare rock, open spaces (333, 9)
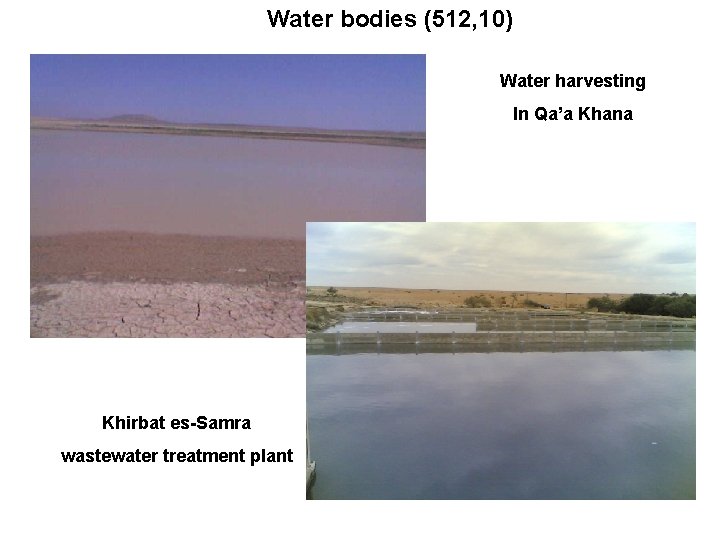
Water bodies (512, 10) Water harvesting In Qa’a Khana Khirbat es-Samra wastewater treatment plant
Structure of the Problem Analysis Report Due in July, 2006 (Deliverable No 10. 1) 1. Description of the case study 2. Water management issues 3. Stakeholder participation 4. Institutional arrangement 5. Water allocation among sector
Structure of the Problem Analysis Report Due in July, 2005 (Deliverable No 10. 1) 6. Building baseline scenario Ø identify and defining basin objects Ø Collecting input data for supply node Ø Verifying time series data Ø Incorporating inter basin transfer Ø Exporting data into the main server Ø Building the topology features of the WRM Ø Comparison of calculated results of the mass balance with that observed at control stations (nodes).
Structure of the Problem Analysis Report Due in July, 2005 (Deliverable No 10. 1) 7. Baseline evaluation and analysis: Ø direct and indirect cost Ø Cost benefit ratio Ø Constraints and instrument Ø Stakeholder view of the baseline scenario Ø Modification needed to baseline scenario
Structure of the Problem Analysis Report Due in July, 2006 (Deliverable No 10. 1) 8. Land use changes: Ø Land uses by sector Ø Evaluation of changes from 1992 -2002 Ø Prediction of changes for the next 15 years Ø Recommendation on land use 9. Next step Ø Future scenario Ø Optimization strategy Ø Water technologies
Contribution to WP 14 Evaluation post-optimal analysis COR Level of Efforts by UJO 1 m/m Activities: X Not yet Status: ü D 14. 1: Decision analysis report due May 2007 ü D 14. 2: Stakeholder involvement report due May 2007
Contribution to WP 15 Comparative analysis: generic lessons and best practice ELARD Level of Efforts by UJO 3 m/m Activities: X Not yet Ø Status: ü D 15. 1: Case study comparative analysis due May 2007 ü D 15. 2: Best practices report due May 2007
Contribution to WP 16 Dissemination, networking and exploitation IRMCO Level of Efforts by UJO 2 m/m Activities: ü Data on stakeholder were sent ü Maps and pictures were sent for poster production ü A paper on “Water Management in Zarqa Basin” was presented in WATMED 2 in Marrakech, Morocco, Nov. , 2005. ü The project has been announced under UNESCO chair web page within the University site. ü The Project has been introduced to the stakeholder in the workshop on May 16, 2006.
Contribution to WP 16 Dissemination, networking and exploitation IRMCO Status: ü ü D 16. 1: project website due June 2007 D 16. 2: Guidelines for local participation due June 2007 D 16. 3 Regional dissemination workshop due June 2007 D 16. 4 Dissemination report due June 2007
Stakeholders Workshop
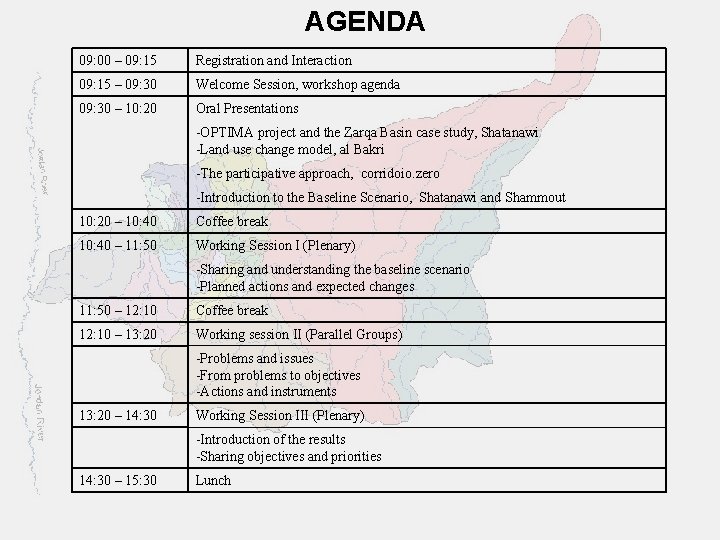
AGENDA 09: 00 – 09: 15 Registration and Interaction 09: 15 – 09: 30 Welcome Session, workshop agenda 09: 30 – 10: 20 Oral Presentations -OPTIMA project and the Zarqa Basin case study, Shatanawi -Land use change model, al Bakri -The participative approach, corridoio. zero -Introduction to the Baseline Scenario, Shatanawi and Shammout 10: 20 – 10: 40 Coffee break 10: 40 – 11: 50 Working Session I (Plenary) -Sharing and understanding the baseline scenario -Planned actions and expected changes 11: 50 – 12: 10 Coffee break 12: 10 – 13: 20 Working session II (Parallel Groups) -Problems and issues -From problems to objectives -Actions and instruments 13: 20 – 14: 30 Working Session III (Plenary) -Introduction of the results -Sharing objectives and priorities 14: 30 – 15: 30 Lunch
Thank you
- Slides: 50