OPTIMA INCOMPC Fourth Management Board Meeting December 1920

OPTIMA INCO-MPC Fourth Management Board Meeting, December 19/20 2006 Milano DDr. Kurt Fedra Environmental Software & Services Gmb. H A-2352 Gumpoldskirchen Austria kurt@ess. co. at http: //www. ess. co. at

Tuesday, December 19 09: 00 -09: 15 Welcome & agenda FEEM 09: 15 -09: 30 Project Status Review ESS 09: 30 -10: 00 Optimization tools ESS 10: 00 -10: 30 Coffee break 10: 30 -11: 30 WP 14 Decision Analysis, C. z. 11: 30 -12: 30 WP 15, Comparative Analysis, ELARD 12: 30 -14: 00 Lunch break

WP 7 -13: case studies 1. One or more baseline scenarios with “complete” economic assessment; 2. Case study specific INSTRUMENTS added to the water technology data base; 3. Optimization scenarios with CONSTRAINTS and INSTRUMENTS defined; 4. Optimization scenarios post-processed with the DMC tool, stakeholder involvement (proxies ? ) 5. Structure inputs for – – – WP 14 post-optimal analysis WP 15 comparative analysis WP 16 dissemination 3

Water resource MC optimization Design or select policies to • Maximize the benefits • Minimize the costs Using multiple criteria in parallel: 1. physical/hydrological 2. monetary (socio-economic) 3. environmental Economic (participatory) approach: Assumes that (rational) individuals maximize welfare (individual and collective utility) as they conceive it, forward looking and consistently. G. Becker, 1993 4
 in sufficient")
Multi criteria optimization 1. Model the behavior of the system (river basin) in sufficient detail (distributed, dynamic, nonlinear) to generate meaningful criteria 2. Generate large sets of feasible alternatives that meet all a priori constraints (minimum or maximum allowable values for key criteria) 3. Select optimal (compromise) solution from the set of non-dominate feasible alternatives by trading of conflicting objectives with multiple criteria (of different units) simultaneously. 5
 modeled")
A topological model: nodes and reaches The river basins (or interconnected hydraulic system) modeled as: NODES produce, consume, store, and change water quality; REACHES transport it between nodes AQUIFERS underlying the network • Costs • Benefits to supply water, damages, shortfall from satisfied demand, compliance 6
: – Investment (annualized):")
Benefits and Costs Nodes are described by Cost functions (direct monetary): – Investment (annualized): • Life time of project/structure • Discount rates – Operating cost (OMR) Benefits per unit water supplied and used. All computations on an annual basis 7
 Non-monetary: based")
Benefits and Costs Direct monetary: • Investment, operations, damage, producer benefits (irrigation) Non-monetary: based on (contingent) valuation (hypothetical markets): • Shortfall costs, penalties, benefits of compliance (in stream use, environmental use) 8

9

10

11

Optimization: STEP 1 CONSTRAINTS: Specify an acceptable system performance in terms of lower and upper bounds of criteria: • Minimum amount of water available • Maximum costs acceptable • Minimum Benefits expected 12

Water resources systems optimization: Definition of optimality: • Acceptability, satisficing • Requires a participatory approach: – Identification and involvement of major actors, stakeholders – Shared information basis – Easy access, intuitive understanding – Web based, local workshops 13

Water resources systems optimization: Acceptability, satisficing: Easier for stakeholders to define several fixed targets as constraints than multiple objectives and trade offs, weights, preferences, etc. 14

Constraints: The constraints are formulated as • minimum or maximum values of System performance criteria These describe: • Hydrological criteria • Economic criteria • Suggestions for social criteria such as equity or performance for domestic demand ? 15

System performance criteria: • Supply/Demand ratio: the ratio of demand (summed over all DEMAND NODES) to supply; if all demand is met, that value can reach a maximum of 1. 0. • Reliability of Supply (%): the percentage of all "events" (summed over all demand nodes and days) where the demand is met; 16
: the percentage of all \"events\" (summed over")
System performance criteria: • Reservoir performance (%): the percentage of all "events" (summed over all reservoirs and all days) where the release targets is met; • Diversion performance (%): the percentage of all "events" (summed over all diversion nodes and days) where the diversion target can be met; 17
: the percentage of supply diverted to supply")
System performance criteria: • Allocation efficiency (%): the percentage of supply diverted to supply nodes that matches demands; all supply beyond demand is "wasted" and decreases allocation efficiency, • Unallocated (%): the total amount of water that is unallocated at reservoirs (spilled), diversions (beyond diversion and downstream targets), control nodes (exceeding a minimum flow constraint), expressed as a percentage of the total amount of water the passes through these nodes. 18

System performance criteria: • Water Shortfall: the total amount of water "missing" from the total demand, summed overall reservoir, demand, diversion, recharge and control nodes, over all days, expressed as a percentage of all stated "demands" including releases, diversions, and in-stream flow constraints. 19

System performance criteria: • Content Change: change of water value, expressed as a percentage from the initial state at the beginning of the current (water) simulation year: measure of sustainability • Flooding days: days of flooding; a flood occurs if at any control node the flow exceeds a maximum flow constraint. • Flooding extent: the percentage of all "floods" (summed over all control nodes with a maximum flow constraint and days) as a percentage of all "events"; 20

System performance criteria: • Economic efficiency: the total benefit per water available/supplied in €/m 3 • Economic efficiency, direct: the direct, monetary benefit per unit water available/supplied 21

System performance criteria: • Benefit/Cost: ratio of all benefits divided by all costs accounted, including nontangible elements and penalties. • Benefit/Cost, direct: ratio of all direct monetary benefits over all direct monetary costs. • Net benefit: Total benefit minus total cost, per capita. • Total Benefit: Sum of all benefits, per capita. 22

System performance criteria: • Total Cost: Sum of all costs, per capita. • Direct net benefits: Sum of all direct monetary benefits minus sum of all direct monetary costs, per capita. • Direct benefit: Sum of all direct monetary benefits, per capita. • Total Cost, direct. : Sum of all direct monetary costs, per capita. 23

System performance criteria: • Water Cost: Total cost of water, per m 3: Sum of all costs divided by the total amount of water supplied against demands at demand nodes, (diversions, control nodes) • Water Cost, direct: Total direct monetary costs of water: as above, but considering only direct monetary costs. 24

Optimization STEP 1: CONSTRAINTS: GLOBAL: apply to some general, aggregate measure for the entire basin SECTORAL: apply to a sector like agriculture industry, domestic, environment only LOCAL (node specific): At LOCATION node FROM day – TO day CONCEPT (flow, cost, benefit, ratio) Must be between MIN – MAX 25

26

27

28

29

30

31

32

33

34

35
 Reference point approach: criterion 2 utopia A 4 A 5 A")
Decision Support (multi-attribute) Reference point approach: criterion 2 utopia A 4 A 5 A 2 A 6 dominated nadir efficient point A 1 A 3 criterion 1 better
 constraints • Add or")
Finding a compromise solution: Direct stakeholder involvement: • Introduce (secondary) constraints • Add or delete criteria • Change the reference point: default is UTOPIA 37

38

39

40

41

42

43

44

Optimization and simulation: • • From any non-dominated solution shown in the DMC tool , a link is available directly back to the WRM simulation to re -run and explore detailed outputs from that scenario; After modifications, that scenario can again be made the starting point of another round of optimization

46

47

Optimization targets: • • • Complete economic assessment, include all reasonable COSTS and BENEFITS plausible results Input for WP 14 and 15 (comparative analysis – consistency !) Use alternative scenarios, a rich set of – CONSTRAINTS – INSTRUMENTS

Optimization targets: Scenario editing support tools: Check the completeness of data with the check/analysis button for WRM scenarios:
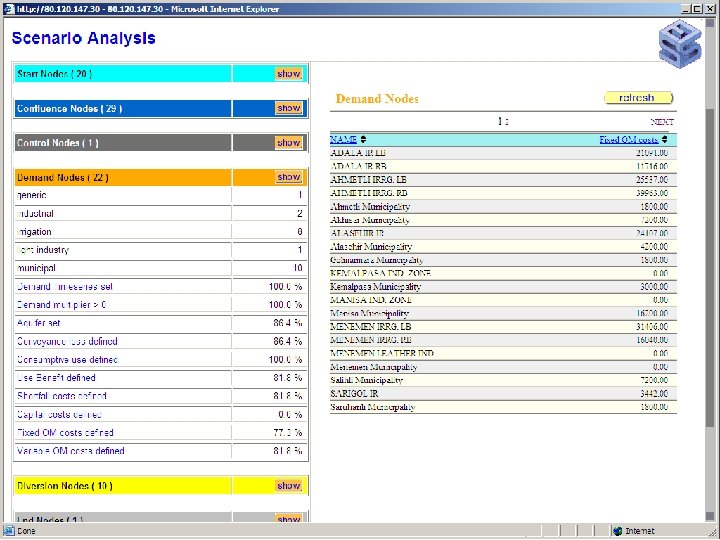
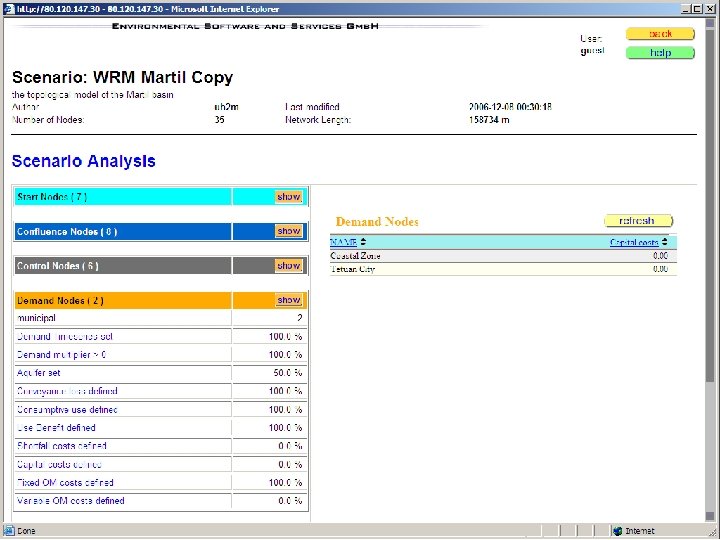

Tuesday, December 19 09: 00 -09: 15 Welcome & agenda FEEM 09: 15 -09: 30 Project Status Review ESS 09: 30 -10: 00 Optimization tools ESS 10: 00 -10: 30 Coffee break 10: 30 -11: 30 WP 14 Decision Analysis, C. z. 11: 30 -12: 30 WP 15, Comparative Analysis, ELARD 12: 30 -14: 00 Lunch break
- Slides: 52