Optical Time Projection Chamber for radon and thoron

Optical Time Projection Chamber for radon and thoron detection Wojciech Dominik Zenon Janas Krzysztof Miernik Marek Pfützner Institute of Experimental Physics Warsaw University

Optical Time Projection Chamber 1 ms/cm visible light PMT CCD Gate 1 atm. gas: 49 % He 49 % Ar 1 % N 2 1 % CH 4 M. Ćwiok et al. , IEEE TNS, 52 (2005) 2895

OTPC at Warsaw Chamber active volume: 20 x 15 cm 3 Materials used: Stesalit fibreglass PCB plates Pyrex optical window

Registration of a particle CCD PMT

Principle of 3 D track reconstruction z vdt 2 a vdt 1 Lxy Total track length: Inclination angle: vd– electron drift velocity 10 mm/ms

What one can measure with OTPC ? - length and position on XY plane (from camera picture) - length of projection on Z axis (from the length of the PMT signal) - no Z coordinate - energy (from the total track length) - charge of the particle (from the energy loss) - time and position correlation between succesive a-decays - no sensitivity for electrons

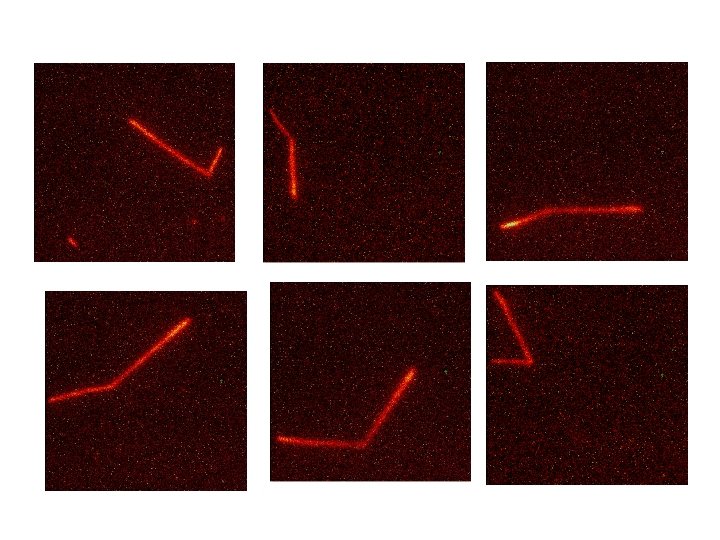
Example: 214 Po a-decay CCD Dt= 5 ms Lxy=115 mm PMT

Example: energy loss along the particle track fit of Bethe-Bloch formula projection of CCD picture

Example: correlation between succesive a-decays T= 0 min T= 3 min a 222 Rn a 218 Po - tracks originate from the same XY position - track lengths compatible with the 222 Rn and 218 Po a energies

OTPC background measurement - 5 hours measurement - circles mark the beginning of the tracks Y - position Total of 260 tracks most of them start from the walls 14 tracks starting from the center X - position

Tracks starting from the central region (16 x 15 cm 3 gas volume ? ) Background activity estimate

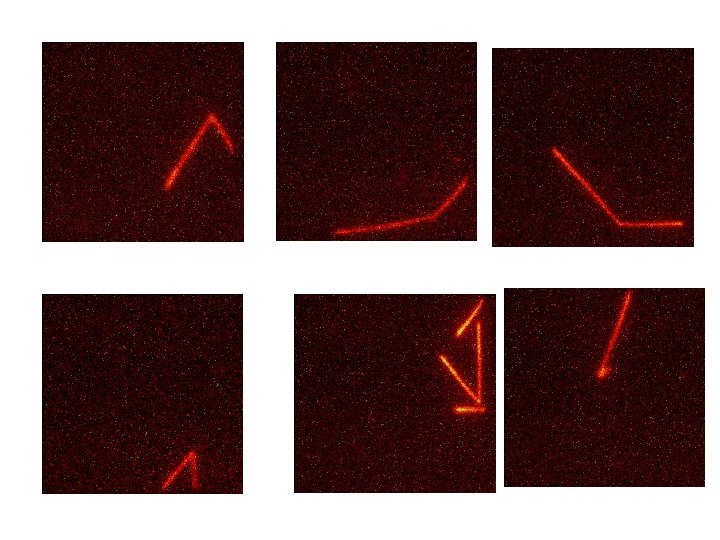
Search for 220 Rn - a - 216 Po - a decay - two triggers within 300 ms gate 2161 155 ms 216 Po 9 cm 220 Rn 5 ms
 + He (50%) gas 1 atm 216 Po")
Range of a particles in Ar(50%) + He (50%) gas 1 atm 216 Po 220 Rn
")
Decays in the center (thoron gate)
")
Decays from the walls (thoron gate)

Time correlation between two a particles

Background thoron activity estimate
/(1 m. Bq/m")
Super-Kamiokande radon detector 16 x 16 mm 2 S = 2 (counts/day)/(1 m. Bq/m 3) Background – 2. 4 ± 1. 3 counts/day Y. Takeuchi et al. . NIM A 421 (1999) 334

OTPC for radon detection 100 cm 15 cm 20 cm 50 cm V = 6· 10 -3 m 3 V = 0. 25 m 3 S = 6· 10 -3 m 3 1 m. Bq/m 3 24 h S = 0. 25 m 3 1 m. Bq/m 3 24 h = 0. 5 (counts/day) / (1 m. Bq/m 3) = 21. 6 (counts/day) / (1 m. Bq/m 3) Background: 200 m. Bq/m 3 radon 20 m. Bq/m 3 thoron

220 Rn decay products 220 Rn 56 s 6. 29 216 Po 212 Po 145 ms 6. 78 300 ns 212 Bi 61 m 212 Pb 10. 6 h 6. 1 208 Tl 3 m 8. 78 208 Pb stable

222 Rn decay products 222 Rn 3. 8 d 5. 49 218 Po 214 Po 3. 1 m 6. 00 164 ms 214 Bi 20 m 214 Pb 27 m 210 Po 5. 45 210 Tl 1. 3 m 7. 69 210 Pb 22. 3 y 138 d 210 Bi 5 d 4. 65 206 Tl 4. 2 m 5. 30 206 Pb stable

819
- Slides: 24