
Optical Fibers Piotr Turowicz Poznan Supercomputing and Networking
Optical Fibers Piotr Turowicz Poznan Supercomputing and Networking Center piotrek@man. poznan. pl . http: //www. porta-optica. org 1
Content Ø Basics of optical fiber transmission Ø FO connetcors Ø Fiber Types, Fiber standards Ø Optical Power, Optical budget Ø WDM technology Ø PIONIER and POZMAN Optical Network Ø FO testing 2
Introduction Optical communication is as old as humanity itself, since from time immemorial optical messages have been exchanged, e. g. in the form of: Ø hand signals Ø smoke signals Ø by optical telegraph To the optical information technology as we know it today - two developments were crucial: Ø The transmission of light over an optically transparent matter (1870 first attempts by Mister Tyndall, 1970 first FO by Fa. Corning) Ø Availability of the LASER, in 1960 3
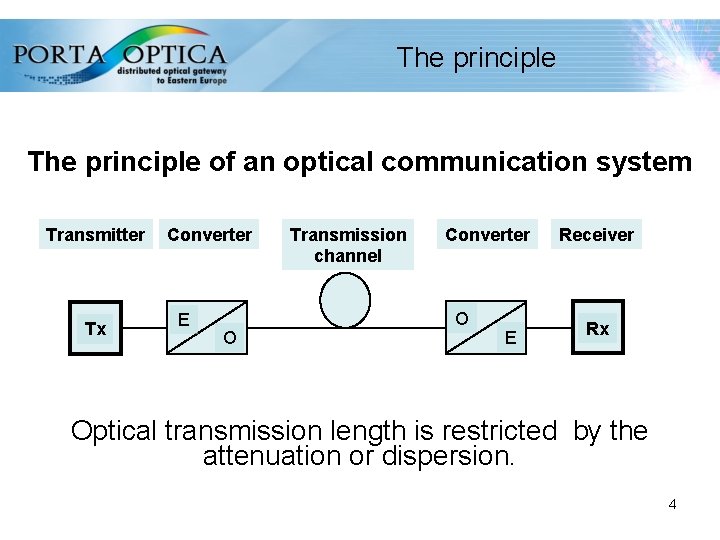
The principle of an optical communication system Transmitter Tx Converter E O Transmission channel Converter O E Receiver Rx Optical transmission length is restricted by the attenuation or dispersion. 4
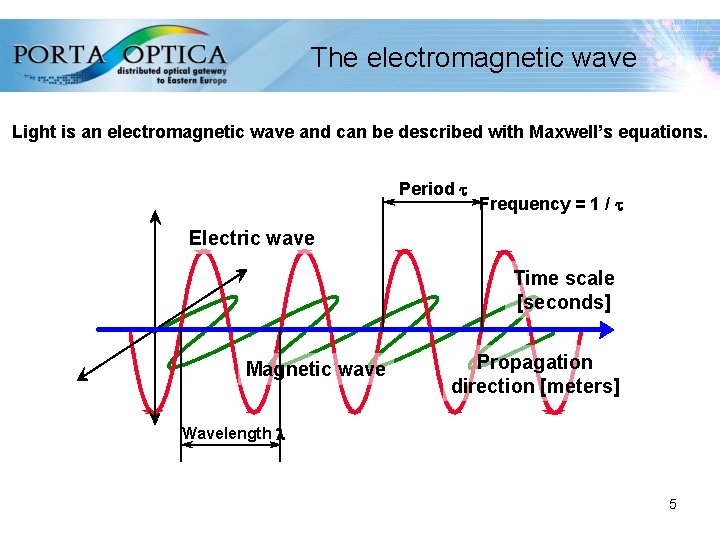
The electromagnetic wave Light is an electromagnetic wave and can be described with Maxwell’s equations. Period t Frequency = 1 / t Electric wave Time scale [seconds] Magnetic wave Propagation direction [meters] Wavelength l 5
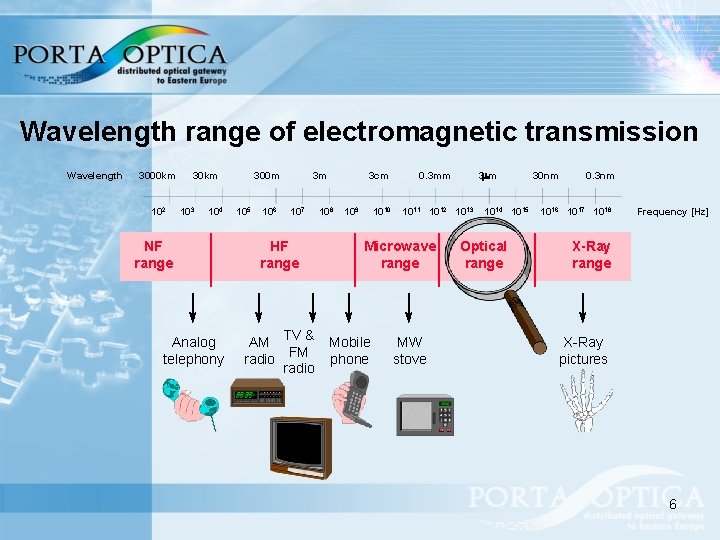
Wavelength range of electromagnetic transmission Wavelength 3000 km 102 30 km 103 104 NF range Analog telephony 300 m 105 106 3 m 107 HF range TV & AM FM radio 3 cm 108 109 1010 1011 1012 1013 Microwave range Mobile phone 3 mm 0. 3 mm MW stove 1014 1015 Optical range 30 nm 0. 3 nm 1016 1017 1018 Frequency [Hz] X-Ray range X-Ray pictures 6
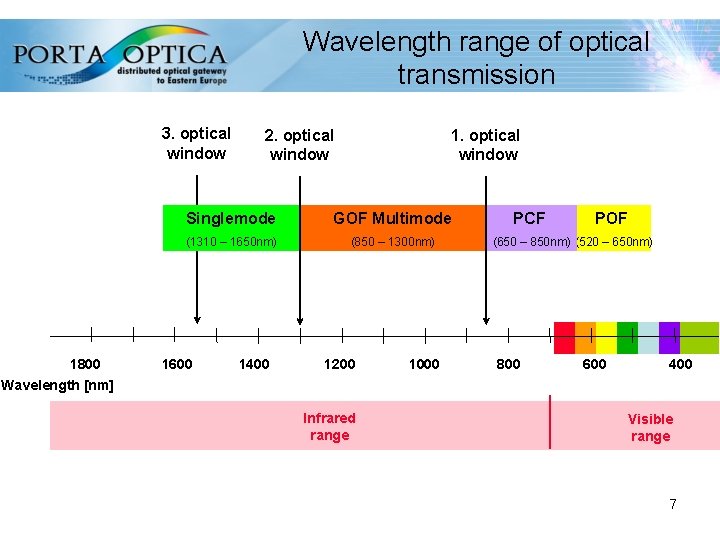
Wavelength range of optical transmission 3. optical window 1800 2. optical window 1. optical window Singlemode GOF Multimode (1310 – 1650 nm) (850 – 1300 nm) 1600 1400 1200 1000 PCF POF (650 – 850 nm) (520 – 650 nm) 800 600 400 Wavelength [nm] Infrared range Visible range 7
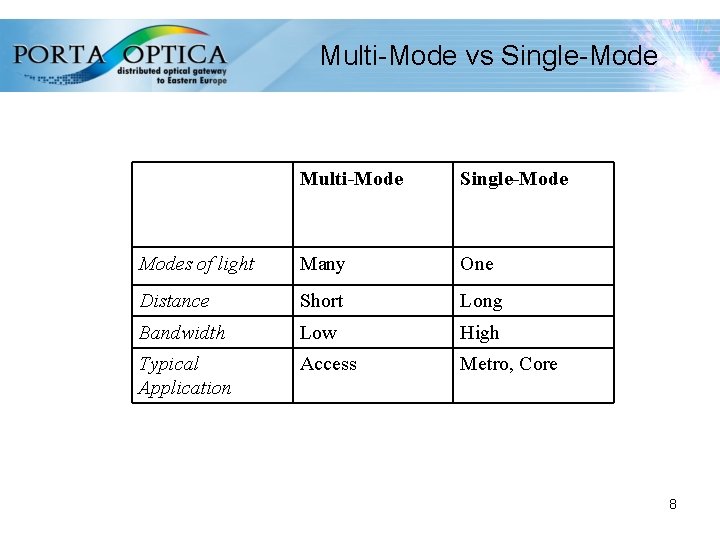
Multi-Mode vs Single-Mode Multi-Mode Single-Modes of light Many One Distance Short Long Bandwidth Low High Typical Application Access Metro, Core 8
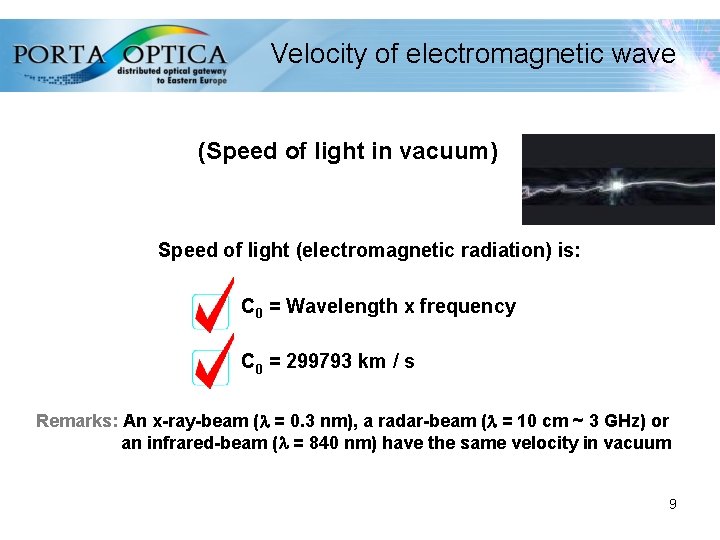
Velocity of electromagnetic wave (Speed of light in vacuum) Speed of light (electromagnetic radiation) is: C 0 = Wavelength x frequency C 0 = 299793 km / s Remarks: An x-ray-beam (l = 0. 3 nm), a radar-beam (l = 10 cm ~ 3 GHz) or an infrared-beam (l = 840 nm) have the same velocity in vacuum 9
Refractive index (Change of velocity of light in matter) Velocity of light (electromagnetic radiation) is: always smaller than in vacuum, it is Cn (Velocity of Light in Matter) n = C 0 / Cn n is defined as refractive index (n = 1 in Vacuum) n is dependent on density of matter and wavelength Remarks: n. Air= 1. 0003; ncore= 1. 5000 or nssugar Water= 1. 8300 10
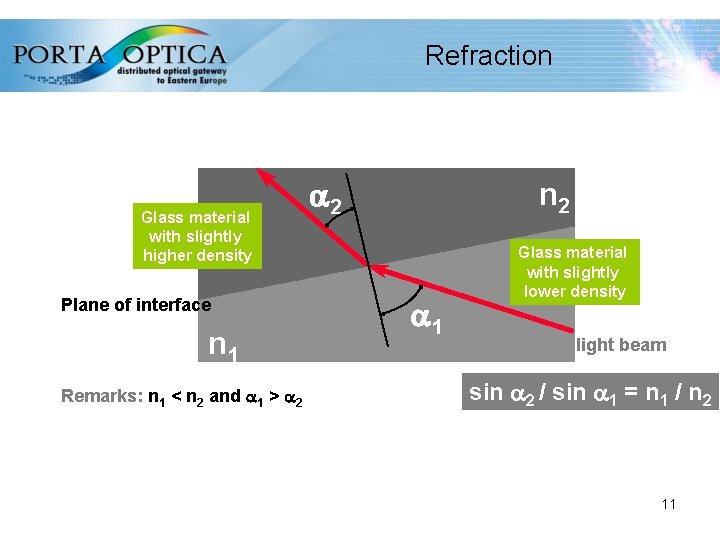
Refraction Glass material with slightly higher density Plane of interface n 1 Remarks: n 1 < n 2 and a 1 > a 2 n 2 a 1 Glass material with slightly lower density light beam sin a 2 / sin a 1 = n 1 / n 2 11
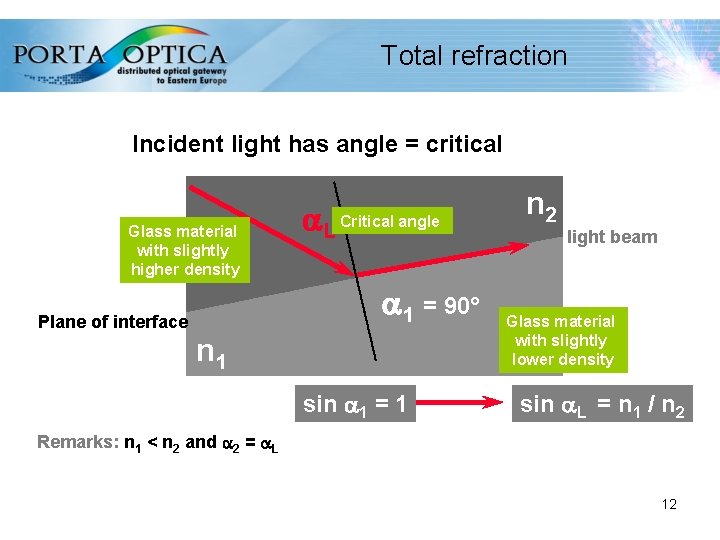
Total refraction Incident light has angle = critical Glass material with slightly higher density a. L Critical angle a 1 = 90° Plane of interface n 1 sin a 1 = 1 n 2 light beam Glass material with slightly lower density sin a. L = n 1 / n 2 Remarks: n 1 < n 2 and a 2 = a. L 12
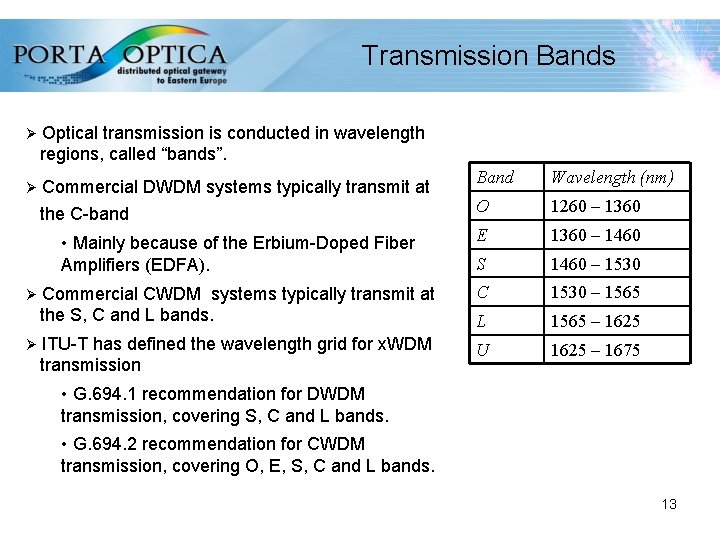
Transmission Bands Ø Optical transmission is conducted in wavelength regions, called “bands”. Ø Commercial DWDM systems typically transmit at the C-band Ø Ø Band Wavelength (nm) O 1260 – 1360 • Mainly because of the Erbium-Doped Fiber Amplifiers (EDFA). E 1360 – 1460 S 1460 – 1530 Commercial CWDM systems typically transmit at the S, C and L bands. C 1530 – 1565 L 1565 – 1625 ITU-T has defined the wavelength grid for x. WDM transmission U 1625 – 1675 • G. 694. 1 recommendation for DWDM transmission, covering S, C and L bands. • G. 694. 2 recommendation for CWDM transmission, covering O, E, S, C and L bands. 13
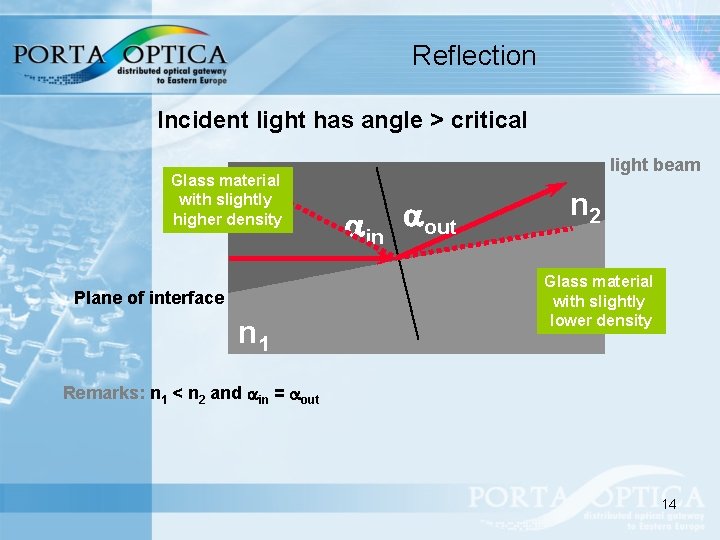
Reflection Incident light has angle > critical Glass material with slightly higher density Plane of interface n 1 light beam ain aout n 2 Glass material with slightly lower density Remarks: n 1 < n 2 and ain = aout 14
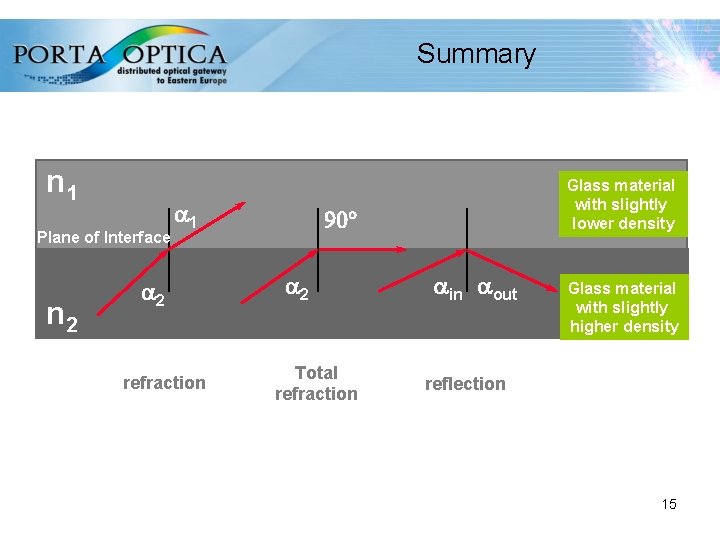
Summary n 1 Plane of Interface n 2 a 1 a 2 refraction Glass material with slightly lower density 90° a 2 Total refraction ain aout Glass material with slightly higher density reflection 15
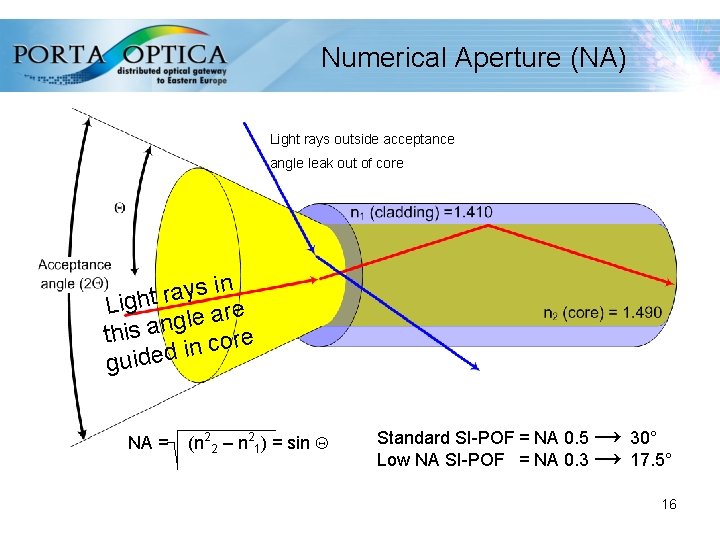
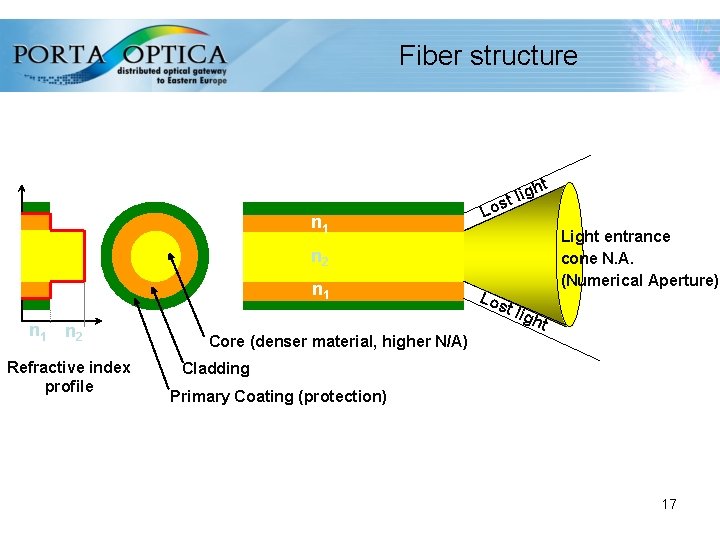
Numerical Aperture (NA) Light rays outside acceptance angle leak out of core in s y a r Light re a e l g this an core in d e d i u g NA = (n 22 – n 21) = sin Standard SI-POF = NA 0. 5 → 30° Low NA SI-POF = NA 0. 3 → 17. 5° 16
Fiber structure t n 1 igh l t Los Light entrance cone N. A. (Numerical Aperture) n 2 n 1 n 2 Refractive index profile Los t ligh t Core (denser material, higher N/A) Cladding Primary Coating (protection) 17
Cutoff wavelength It’s the minimum wavelength above which the SM fiber propagates only one mode. Cutoff wavelength depends on: • Length • Bending radius • Cable manufacturing process 18
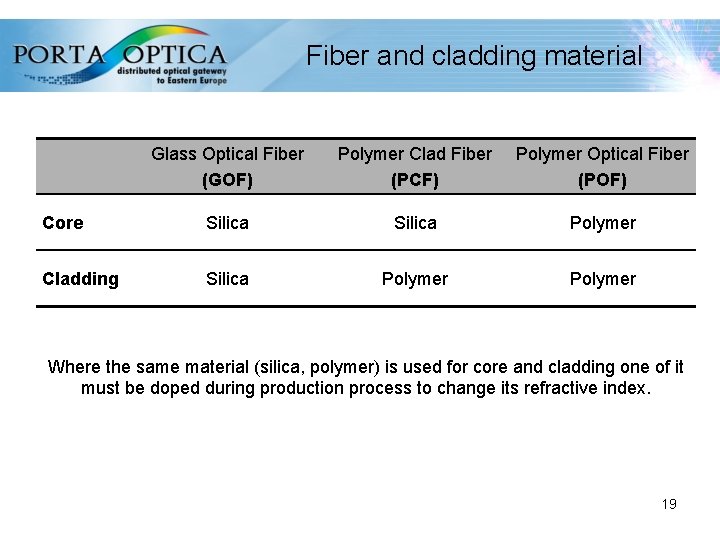
Fiber and cladding material Glass Optical Fiber (GOF) Polymer Clad Fiber (PCF) Polymer Optical Fiber (POF) Core Silica Polymer Cladding Silica Polymer Where the same material (silica, polymer) is used for core and cladding one of it must be doped during production process to change its refractive index. 19
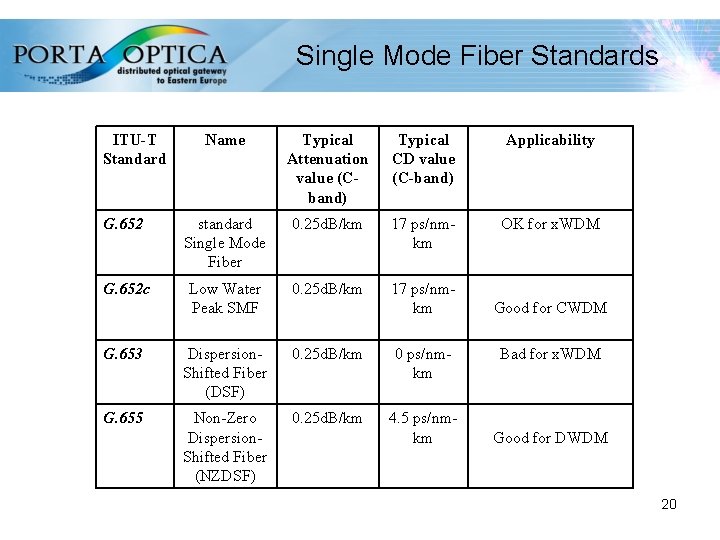
Single Mode Fiber Standards ITU-T Standard Name Typical Attenuation value (Cband) Typical CD value (C-band) Applicability G. 652 standard Single Mode Fiber 0. 25 d. B/km 17 ps/nmkm OK for x. WDM G. 652 c Low Water Peak SMF 0. 25 d. B/km 17 ps/nmkm G. 653 Dispersion. Shifted Fiber (DSF) 0. 25 d. B/km 0 ps/nmkm G. 655 Non-Zero Dispersion. Shifted Fiber (NZDSF) 0. 25 d. B/km 4. 5 ps/nmkm Good for CWDM Bad for x. WDM Good for DWDM 20
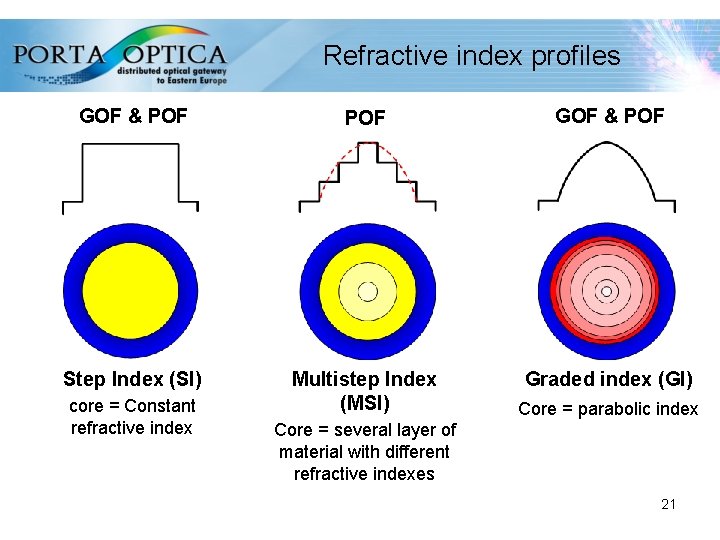
Refractive index profiles GOF & POF Step Index (SI) Multistep Index (MSI) Graded index (GI) core = Constant refractive index Core = parabolic index Core = several layer of material with different refractive indexes 21
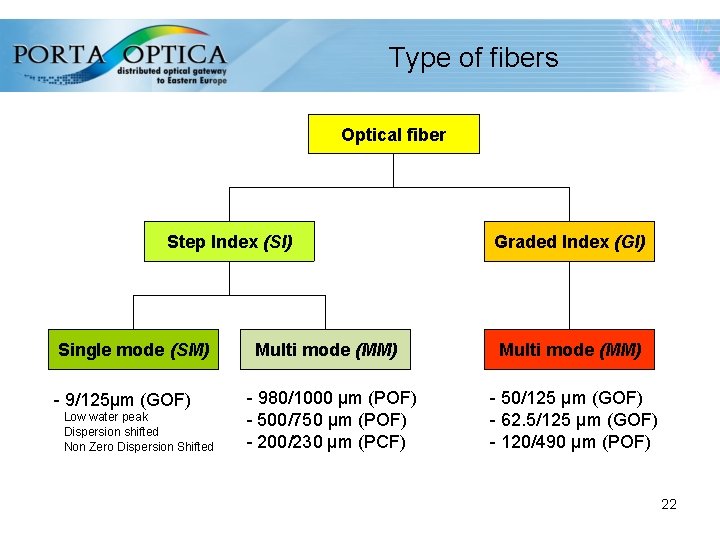
Type of fibers Optical fiber Step Index (SI) Single mode (SM) - 9/125µm (GOF) Low water peak Dispersion shifted Non Zero Dispersion Shifted Multi mode (MM) - 980/1000 µm (POF) - 500/750 µm (POF) - 200/230 µm (PCF) Graded Index (GI) Multi mode (MM) - 50/125 µm (GOF) - 62. 5/125 µm (GOF) - 120/490 µm (POF) 22
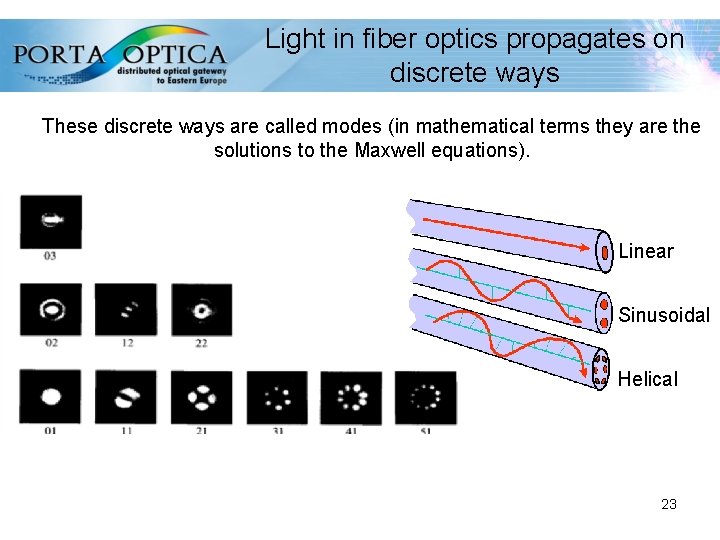
Light in fiber optics propagates on discrete ways These discrete ways are called modes (in mathematical terms they are the solutions to the Maxwell equations). Linear Sinusoidal Helical 23
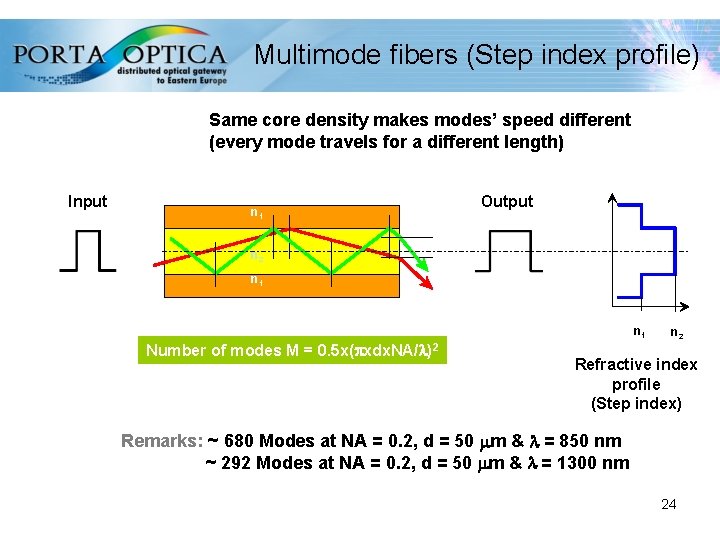
Multimode fibers (Step index profile) Same core density makes modes’ speed different (every mode travels for a different length) Input Output n 1 n 2 n 1 Number of modes M = 0. 5 x(pxdx. NA/l)2 n 2 Refractive index profile (Step index) Remarks: ~ 680 Modes at NA = 0. 2, d = 50 mm & l = 850 nm ~ 292 Modes at NA = 0. 2, d = 50 mm & l = 1300 nm 24
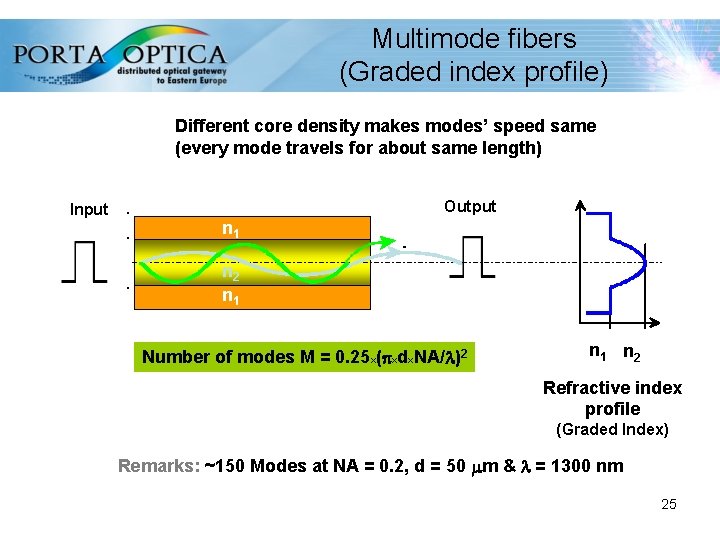
Multimode fibers (Graded index profile) Different core density makes modes’ speed same (every mode travels for about same length) Input Output n 1 n 2 n 1 Number of modes M = 0. 25 x(pxdx. NA/l)2 n 1 n 2 Refractive index profile (Graded Index) Remarks: ~150 Modes at NA = 0. 2, d = 50 mm & l = 1300 nm 25
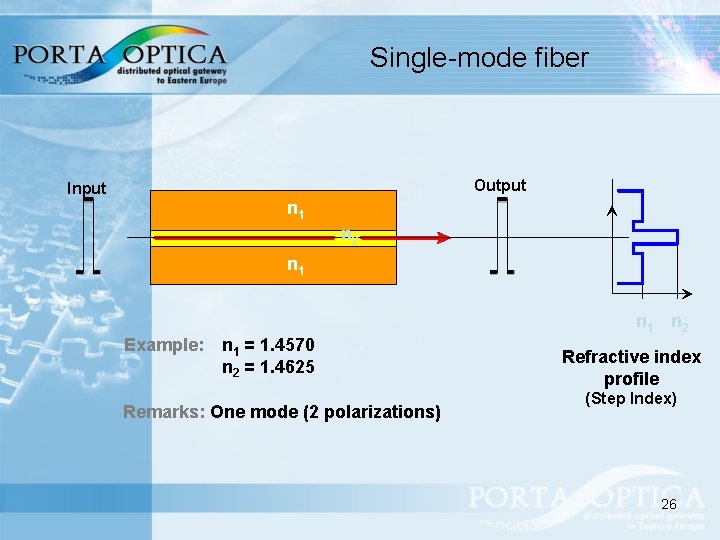
Single-mode fiber Output Input n 1 n 2 Example: n 1 = 1. 4570 n 2 = 1. 4625 Remarks: One mode (2 polarizations) Refractive index profile (Step Index) 26
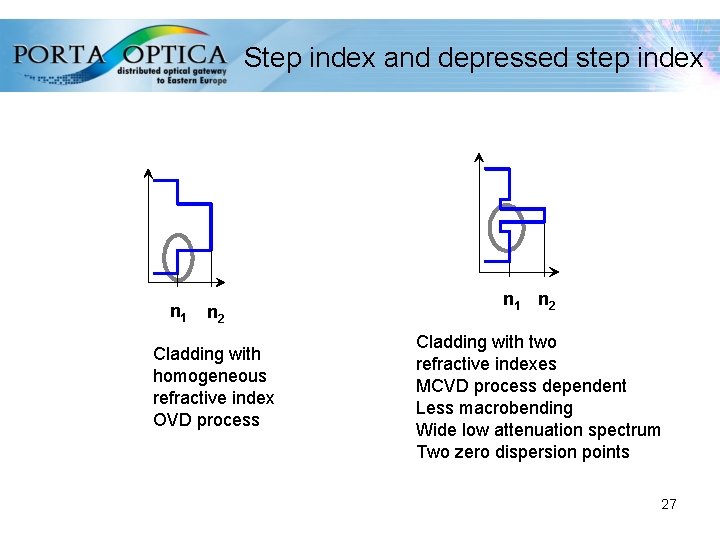
Step index and depressed step index n 1 n 2 Cladding with homogeneous refractive index OVD process n 1 n 2 Cladding with two refractive indexes MCVD process dependent Less macrobending Wide low attenuation spectrum Two zero dispersion points 27
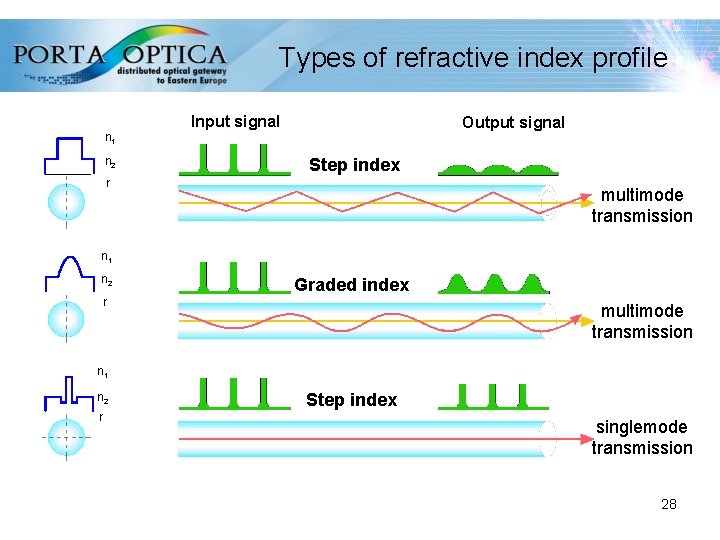
Types of refractive index profile n 1 n 2 Input signal Output signal Step index r multimode transmission n 1 n 2 Graded index r multimode transmission n 1 n 2 r Step index singlemode transmission 28
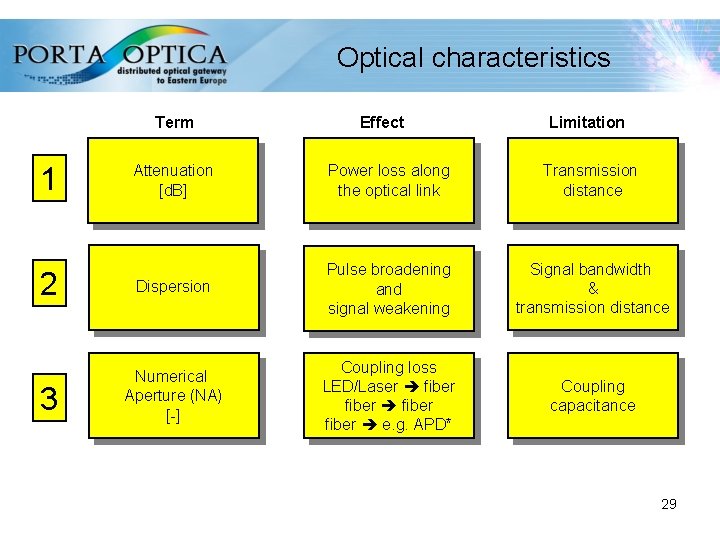
Optical characteristics Term 1 Effect Limitation Attenuation [d. B] Power loss along the optical link Transmission distance 2 Dispersion Pulse broadening and signal weakening Signal bandwidth & transmission distance 3 Numerical Aperture (NA) [-] Coupling loss LED/Laser fiber e. g. APD* Coupling capacitance 29
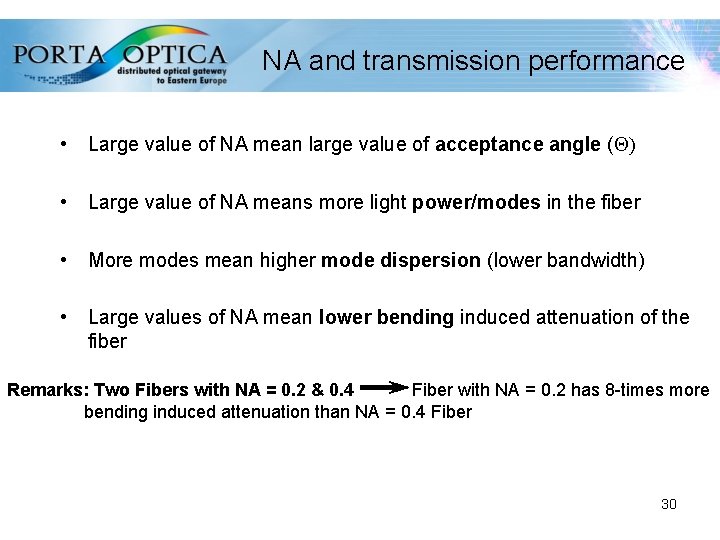
NA and transmission performance • Large value of NA mean large value of acceptance angle ( ) • Large value of NA means more light power/modes in the fiber • More modes mean higher mode dispersion (lower bandwidth) • Large values of NA mean lower bending induced attenuation of the fiber Remarks: Two Fibers with NA = 0. 2 & 0. 4 Fiber with NA = 0. 2 has 8 -times more bending induced attenuation than NA = 0. 4 Fiber 30
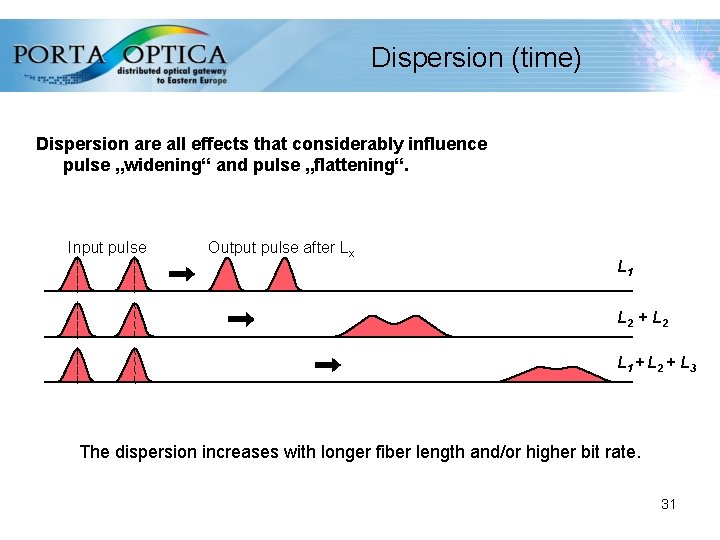
Dispersion (time) Dispersion are all effects that considerably influence pulse „widening“ and pulse „flattening“. Input pulse Output pulse after Lx L 1 L 2 + L 2 L 1 + L 2 + L 3 The dispersion increases with longer fiber length and/or higher bit rate. 31
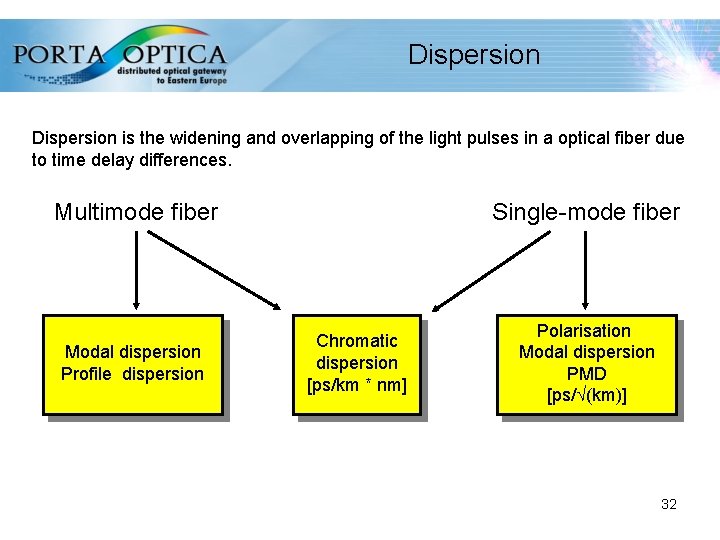
Dispersion is the widening and overlapping of the light pulses in a optical fiber due to time delay differences. Multimode fiber Modal dispersion Profile dispersion Single-mode fiber Chromatic dispersion [ps/km * nm] Polarisation Modal dispersion PMD [ps/ (km)] 32
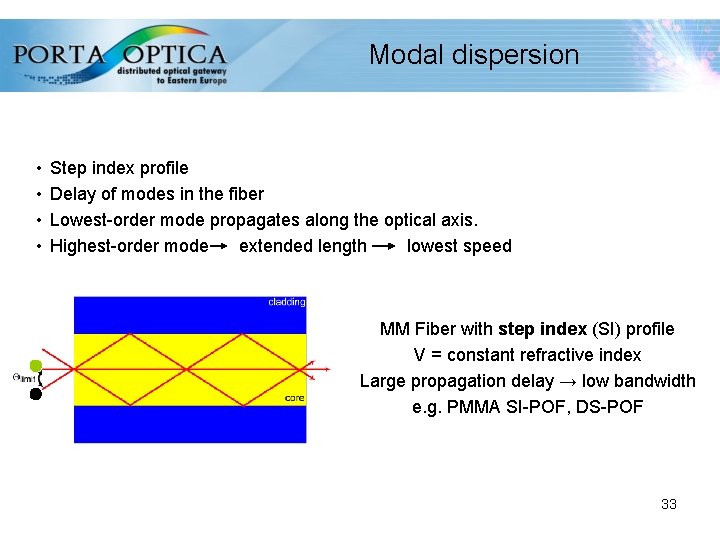
Modal dispersion • • Step index profile Delay of modes in the fiber Lowest-order mode propagates along the optical axis. Highest-order mode extended length lowest speed MM Fiber with step index (SI) profile V = constant refractive index Large propagation delay → low bandwidth e. g. PMMA SI-POF, DS-POF 33
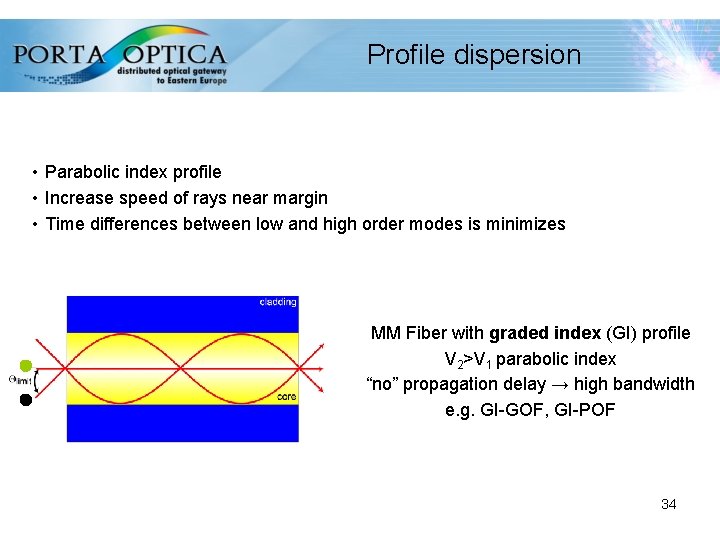
Profile dispersion • Parabolic index profile • Increase speed of rays near margin • Time differences between low and high order modes is minimizes MM Fiber with graded index (GI) profile V 2>V 1 parabolic index “no” propagation delay → high bandwidth e. g. GI-GOF, GI-POF 34
Non linear characteristics • SPM - self phase modulation predominant in SM and power dependent • XFM - cross phase modulation similar to NEXT but occurring in WDM with adjacent channels • FWM - Four-Wave Mixing intermodulation between three wavelength creating a fourth one (WDM) • SRS - stimulated Raman scattering • SRB - stimulated Brillouin scattering 35
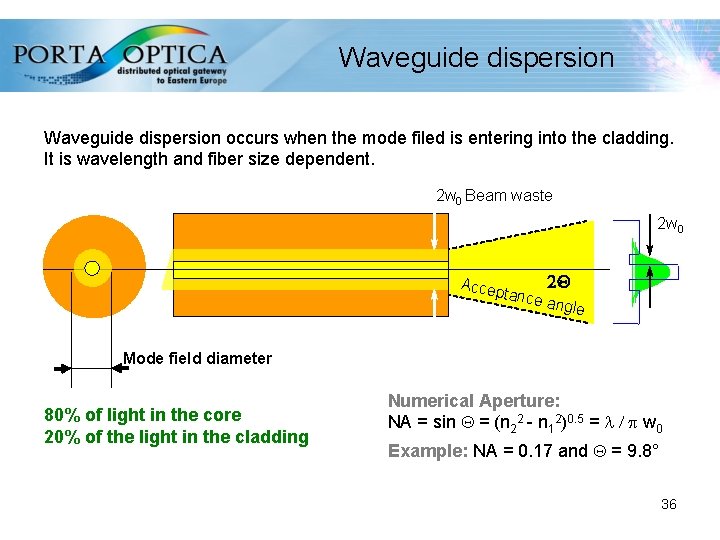
Waveguide dispersion occurs when the mode filed is entering into the cladding. It is wavelength and fiber size dependent. 2 w 0 Beam waste 2 w 0 Accep tance 2 Q angle Mode field diameter 80% of light in the core 20% of the light in the cladding Numerical Aperture: NA = sin = (n 22 - n 12)0. 5 = l / p w 0 Example: NA = 0. 17 and = 9. 8° 36
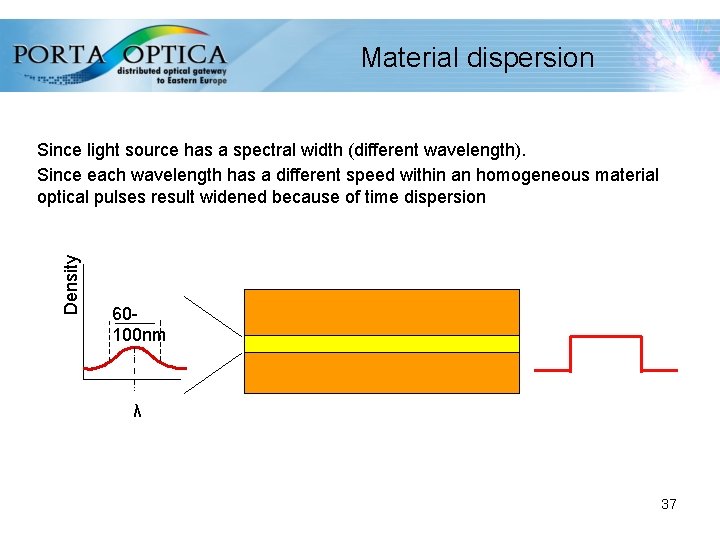
Material dispersion Density Since light source has a spectral width (different wavelength). Since each wavelength has a different speed within an homogeneous material optical pulses result widened because of time dispersion 60100 nm λ 37
Chromatic dispersion Singlemode chromatic dispersion Dominant type of dispersion in SM fibers and is caused by wavelength dependent effects. Chromatic dispersion is the cumulative effect of material and waveguide dispersion Multimode chromatic dispersion As waveguide dispersion is very low compared to material dispersion it can be disregarded. 38
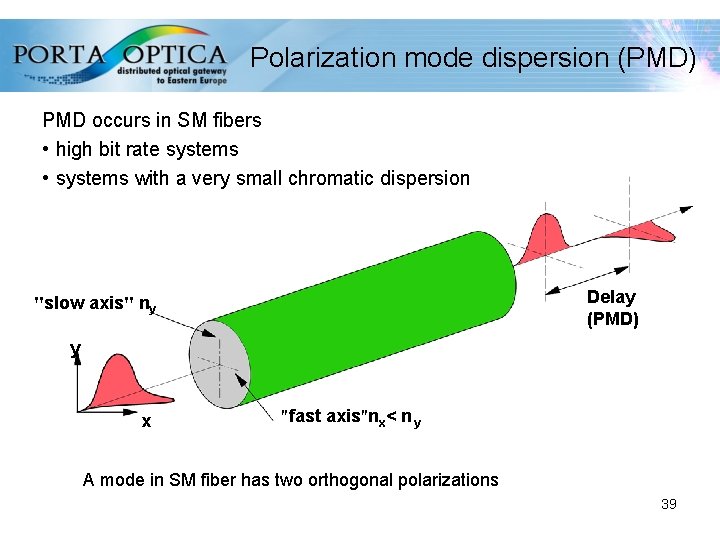
Polarization mode dispersion (PMD) PMD occurs in SM fibers • high bit rate systems • systems with a very small chromatic dispersion Delay (PMD) "slow axis" ny y x "fast axis"nx< n y A mode in SM fiber has two orthogonal polarizations 39
Bandwidth length product Bandwidth describes the usable frequency range within a channel Bandwidth is length dependent because of signal widening (dispersion) • Pulse widening limits bandwidth B and the maximum transmission rate Mbps • Pulse widening is approx. proportional to the fiber length L 40
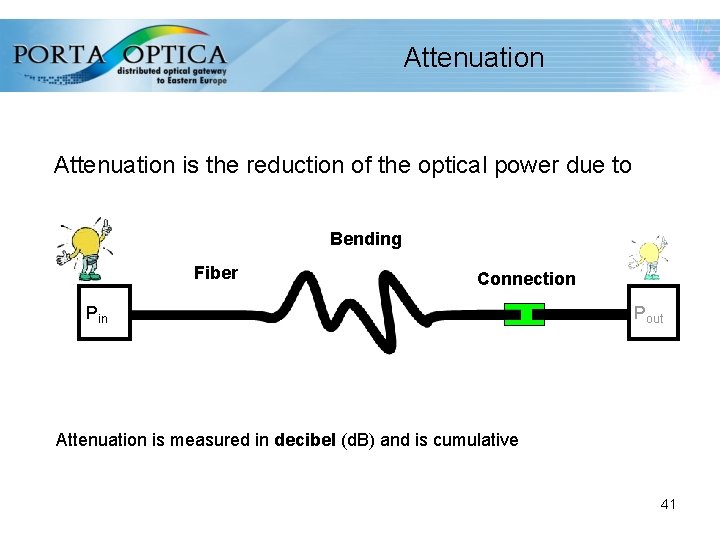
Attenuation is the reduction of the optical power due to Bending Fiber Connection Pin Pout Attenuation is measured in decibel (d. B) and is cumulative 41
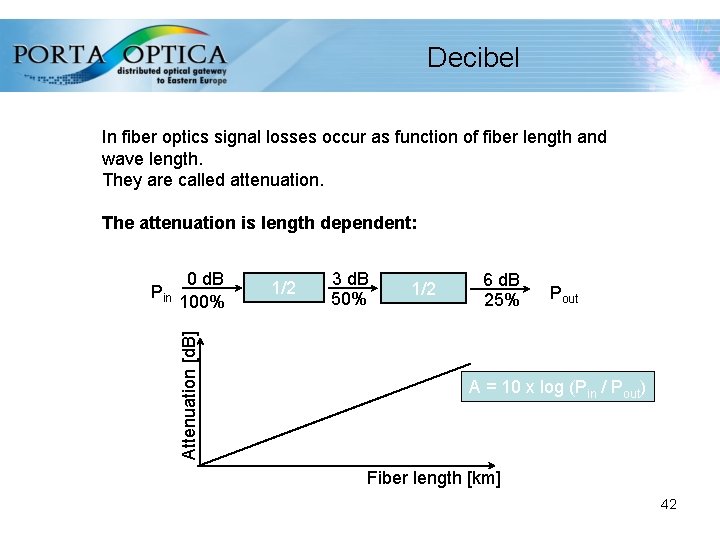
Decibel In fiber optics signal losses occur as function of fiber length and wave length. They are called attenuation. The attenuation is length dependent: 0 d. B 100% Attenuation [d. B] Pin 1/2 3 d. B 50% 1/2 6 d. B 25% Pout A = 10 x log (Pin / Pout) Fiber length [km] 42
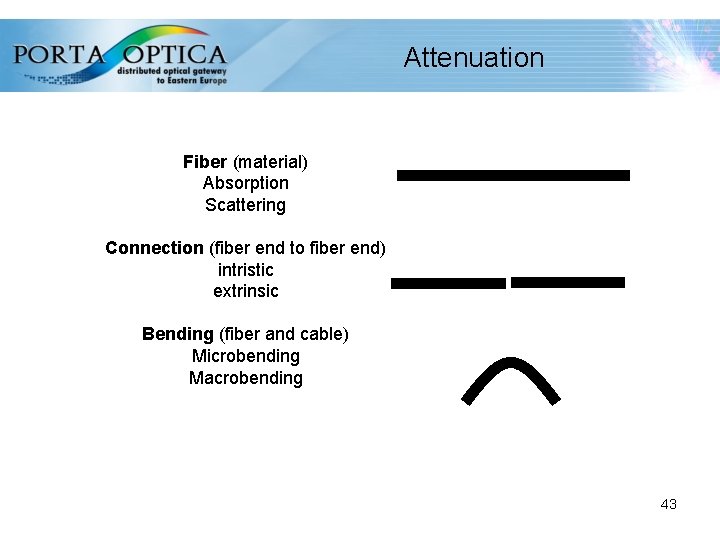
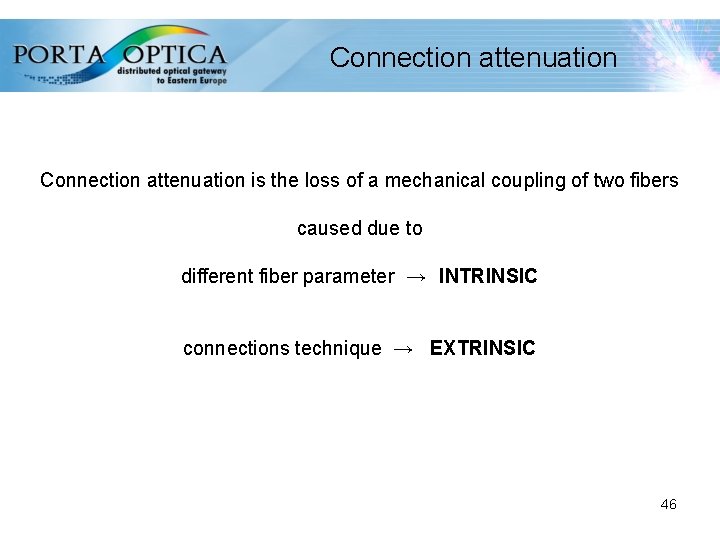
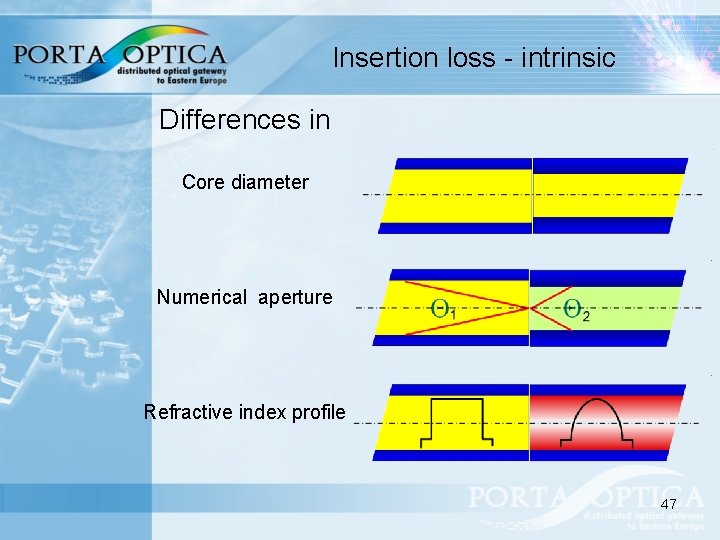
Attenuation Fiber (material) Absorption Scattering Connection (fiber end to fiber end) intristic extrinsic Bending (fiber and cable) Microbending Macrobending 43
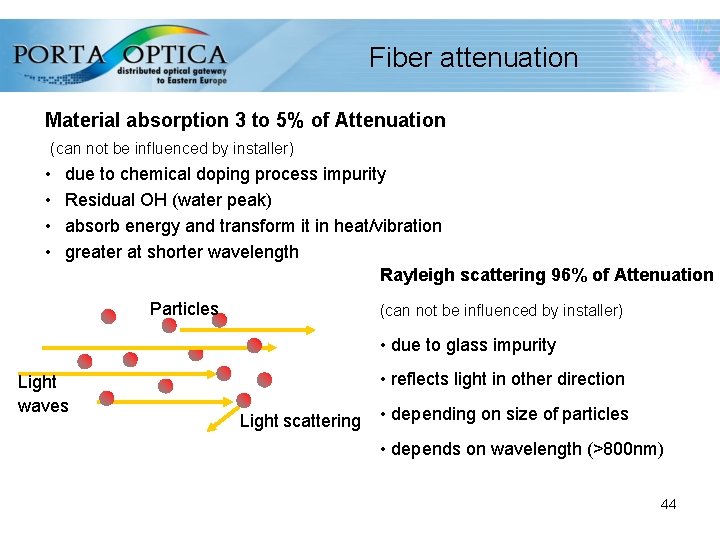
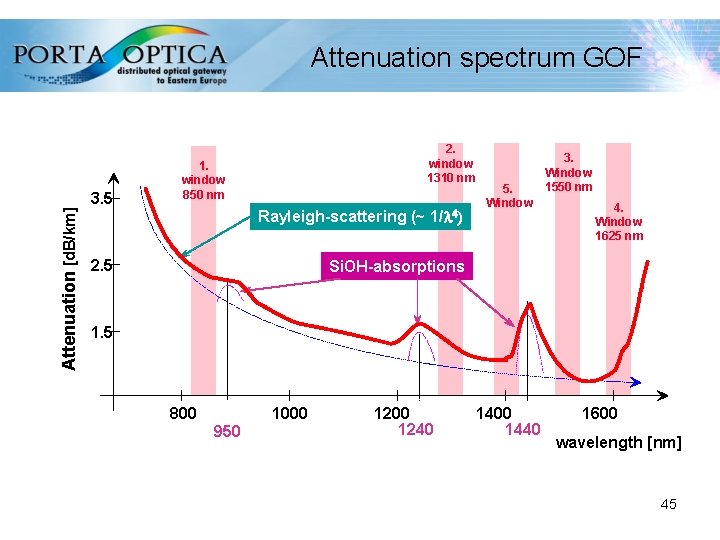
Fiber attenuation Material absorption 3 to 5% of Attenuation (can not be influenced by installer) • • due to chemical doping process impurity Residual OH (water peak) absorb energy and transform it in heat/vibration greater at shorter wavelength Rayleigh scattering 96% of Attenuation Particles (can not be influenced by installer) • due to glass impurity Light waves • reflects light in other direction Light scattering • depending on size of particles • depends on wavelength (>800 nm) 44
Attenuation [d. B/km] Attenuation spectrum GOF 3. 5 2. window 1310 nm 1. window 850 nm Rayleigh-scattering (~ 1/l 4) 2. 5 5. Window 3. Window 1550 nm 4. Window 1625 nm Si. OH-absorptions 1. 5 800 1000 950 1200 1240 1400 1440 1600 wavelength [nm] 45
Connection attenuation is the loss of a mechanical coupling of two fibers caused due to different fiber parameter → INTRINSIC connections technique → EXTRINSIC 46
Insertion loss - intrinsic Differences in Core diameter Numerical aperture Refractive index profile 47
Insertion loss - extrinsic Due to Lateral offset Axial separation Axial tilt 48
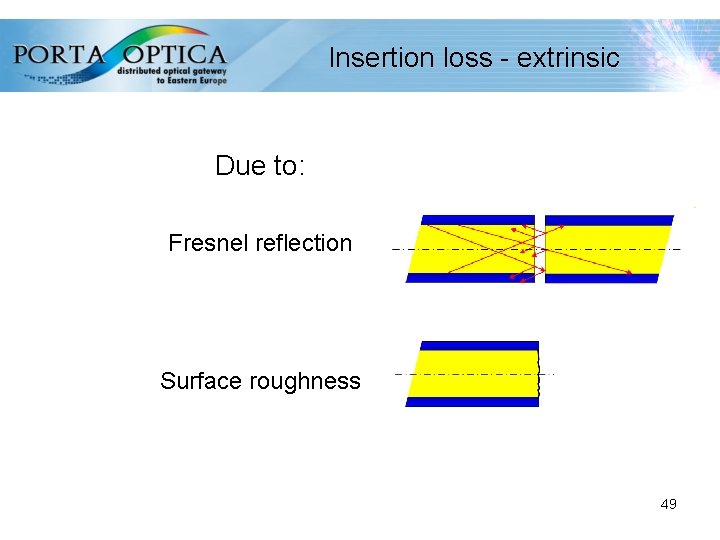
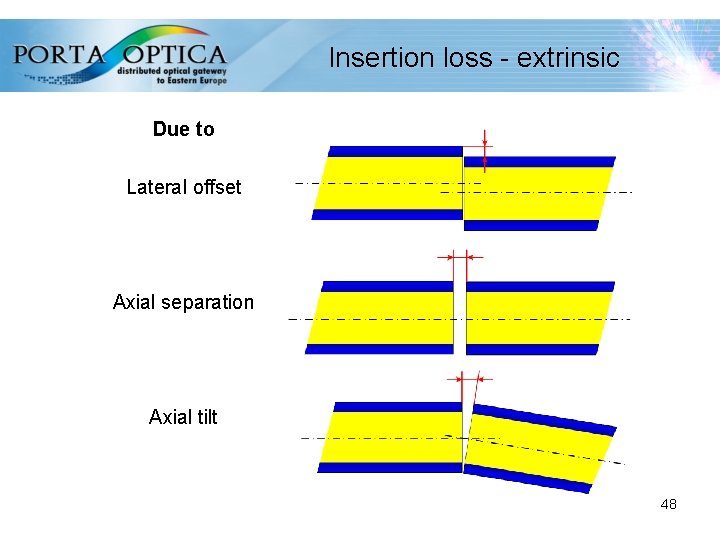
Insertion loss - extrinsic Due to: Fresnel reflection Surface roughness 49
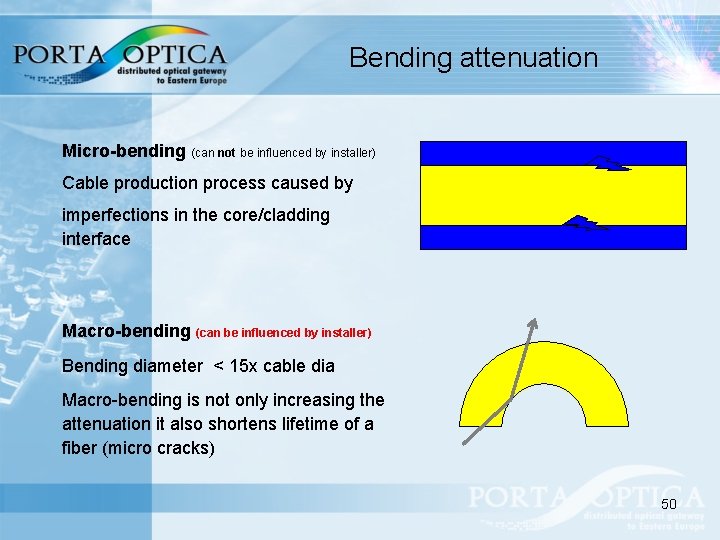
Bending attenuation Micro-bending (can not be influenced by installer) Cable production process caused by imperfections in the core/cladding interface Macro-bending (can be influenced by installer) Bending diameter < 15 x cable dia Macro-bending is not only increasing the attenuation it also shortens lifetime of a fiber (micro cracks) 50
Summary Light propagation (transmission) into the fiber is affected mostly by: Ø attenuation fiber physical characteristic dependent fiber installation/termination Ø dispersion fiber physical characteristic dependent Ø non linear effects transmission technology dependent Transmission optimization process is based on minimizing these parameters by selecting the right media and considering also the related phenomenon: Ø light generation Ø light injection Ø light detection 51
From light to bits transmission • Speed is the keyword Transmission speed is not bits velocity but bits quantity • Quantity in a limited capacity media requires optimization of the media itself Being media capacity fixed, time is the only variable to play with • For transmission purposes time has two aspects Slot (on the Media) allocated for each transmitter Frequency of the transmitter (carrier signal) 52
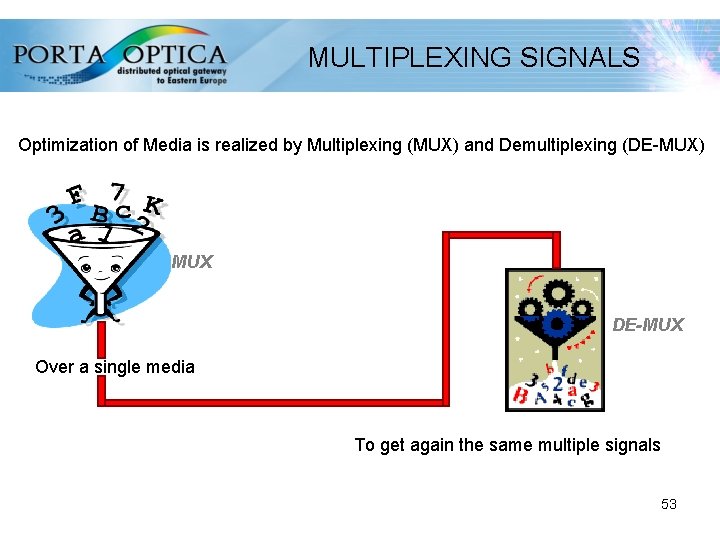
MULTIPLEXING SIGNALS Optimization of Media is realized by Multiplexing (MUX) and Demultiplexing (DE-MUX) MUX DE-MUX Over a single media To get again the same multiple signals 53
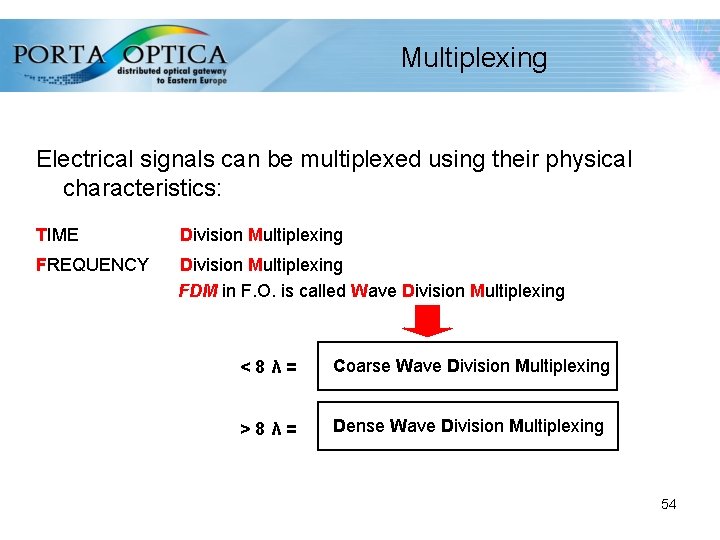
Multiplexing Electrical signals can be multiplexed using their physical characteristics: TIME Division Multiplexing FREQUENCY Division Multiplexing FDM in F. O. is called Wave Division Multiplexing <8λ= Coarse Wave Division Multiplexing >8λ= Dense Wave Division Multiplexing 54
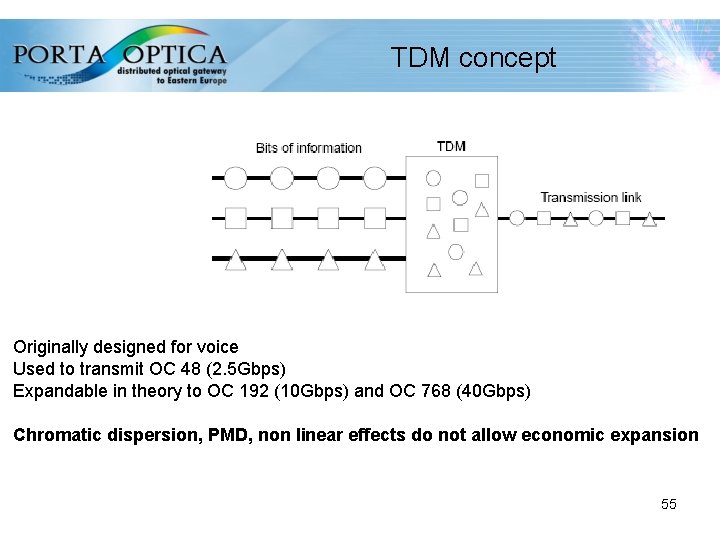
TDM concept Originally designed for voice Used to transmit OC 48 (2. 5 Gbps) Expandable in theory to OC 192 (10 Gbps) and OC 768 (40 Gbps) Chromatic dispersion, PMD, non linear effects do not allow economic expansion 55
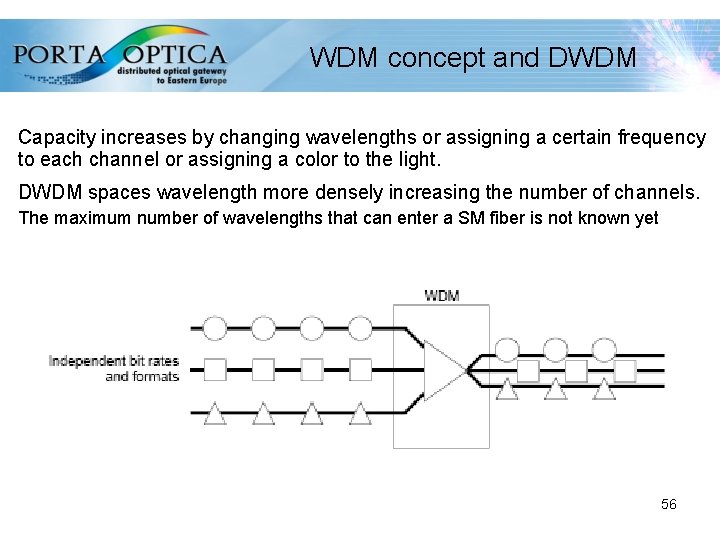
WDM concept and DWDM Capacity increases by changing wavelengths or assigning a certain frequency to each channel or assigning a color to the light. DWDM spaces wavelength more densely increasing the number of channels. The maximum number of wavelengths that can enter a SM fiber is not known yet 56
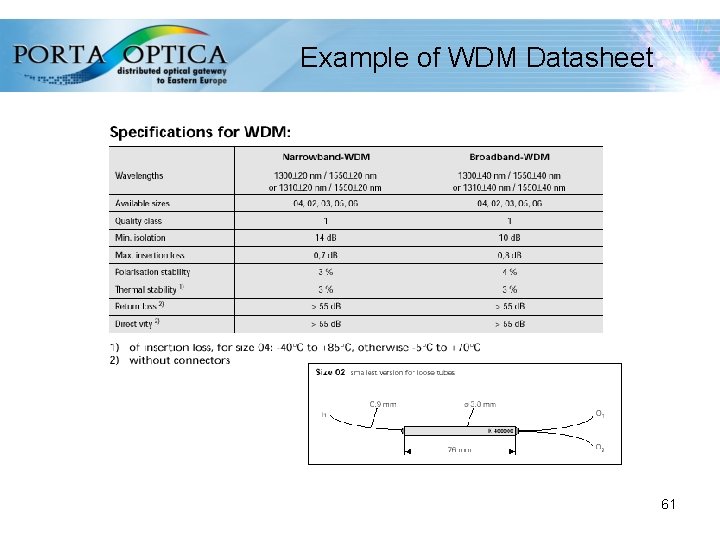
Data transmission with WDM Fields of Application: WDMs ( Wavelength Division Multiplex) are used in fiber optics networks for communications and data transmission (cable TV, telephony etc. ) to multiply transmitting capacity per optical fiber and lead to cost reduction. With classical WDM systems a few wavelengths are transmitted via a singlemode fiber. 57
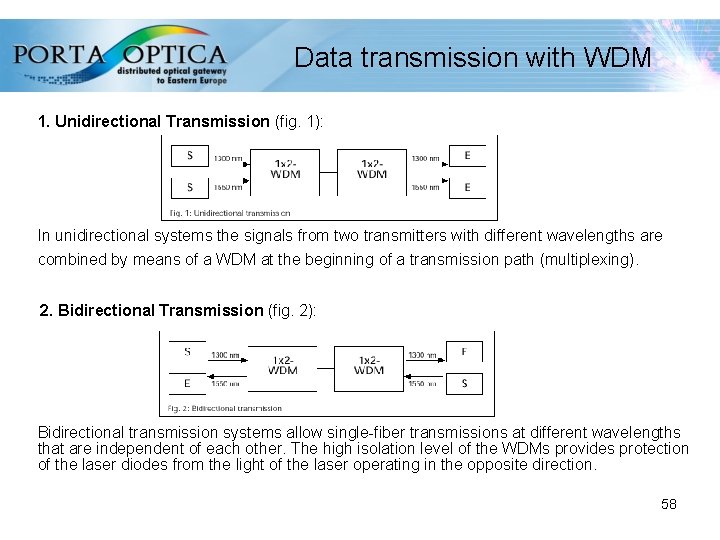
Data transmission with WDM 1. Unidirectional Transmission (fig. 1): In unidirectional systems the signals from two transmitters with different wavelengths are combined by means of a WDM at the beginning of a transmission path (multiplexing). 2. Bidirectional Transmission (fig. 2): Bidirectional transmission systems allow single-fiber transmissions at different wavelengths that are independent of each other. The high isolation level of the WDMs provides protection of the laser diodes from the light of the laser operating in the opposite direction. 58
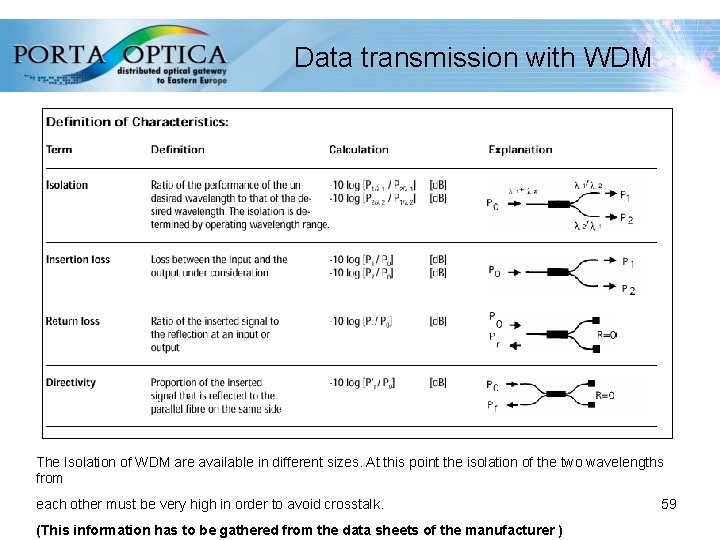
Data transmission with WDM • The Isolation of WDM are available in different sizes. At this point the isolation of the two wavelengths from each other must be very high in order to avoid crosstalk. (This information has to be gathered from the data sheets of the manufacturer ) 59
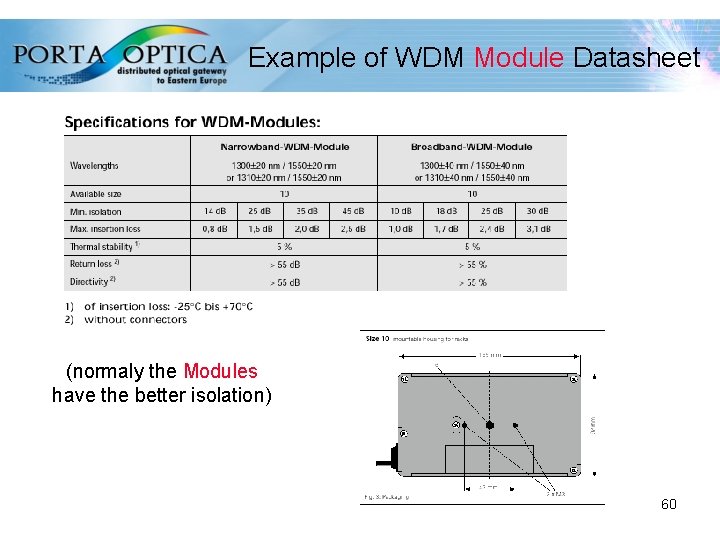
Example of WDM Module Datasheet (normaly the Modules have the better isolation) 60
Example of WDM Datasheet 61
References Reichle & De-Massari 62
- Slides: 62