
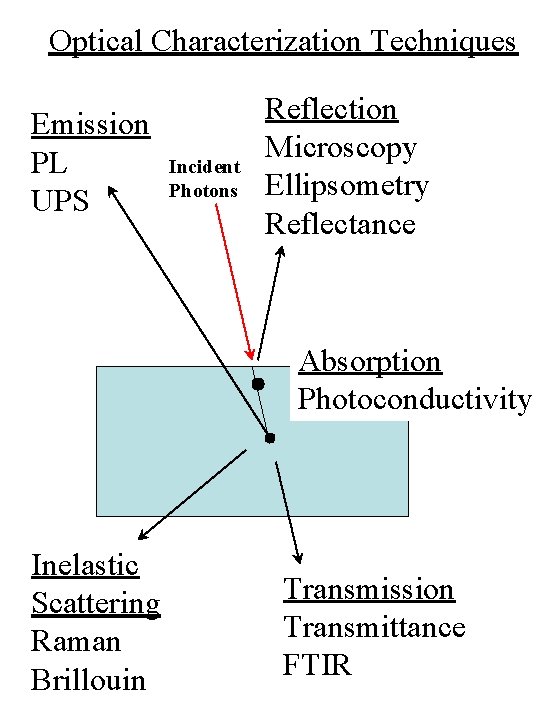
Optical Characterization Techniques Emission PL UPS Incident Photons
- Slides: 19
Optical Characterization Techniques Emission PL UPS Incident Photons Reflection Microscopy Ellipsometry Reflectance Absorption Photoconductivity Inelastic Scattering Raman Brillouin Transmission Transmittance FTIR
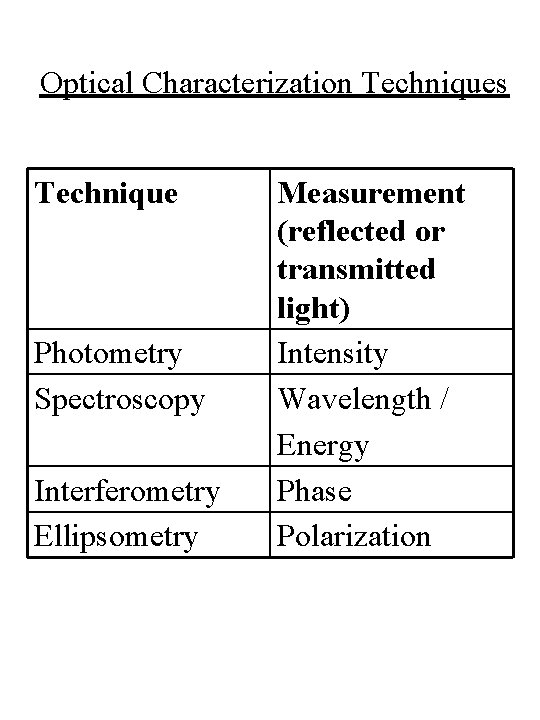
Optical Characterization Techniques Technique Photometry Spectroscopy Interferometry Ellipsometry Measurement (reflected or transmitted light) Intensity Wavelength / Energy Phase Polarization
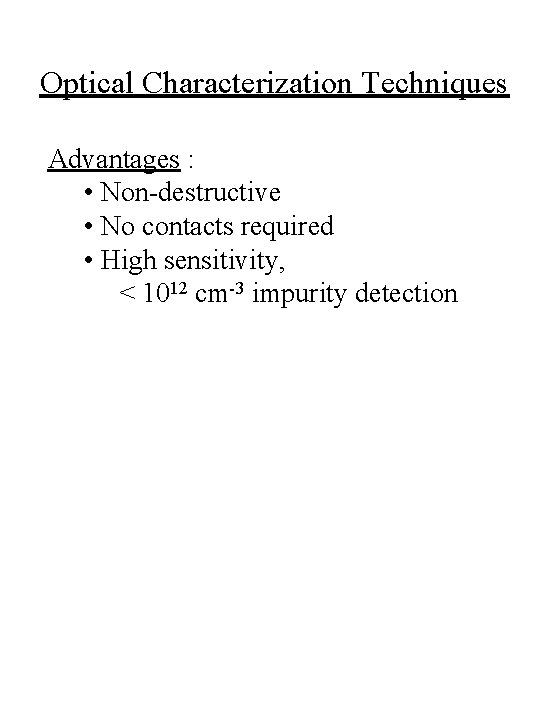
Optical Characterization Techniques Advantages : • Non-destructive • No contacts required • High sensitivity, < 1012 cm-3 impurity detection
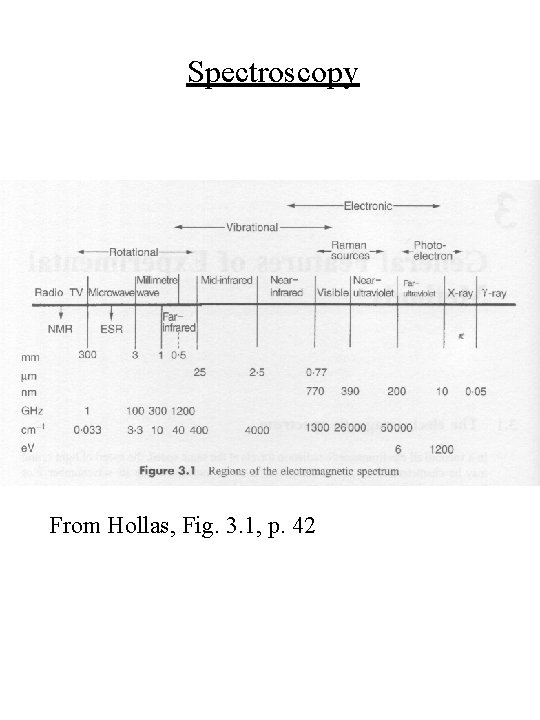
Spectroscopy From Hollas, Fig. 3. 1, p. 42
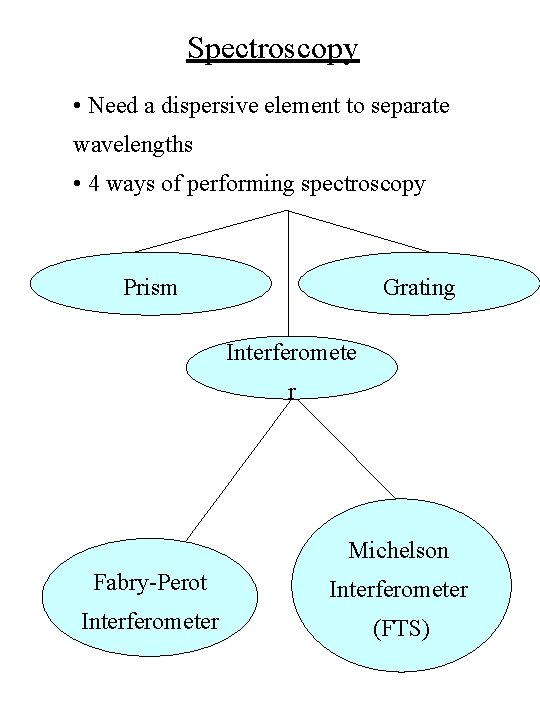
Spectroscopy • Need a dispersive element to separate wavelengths • 4 ways of performing spectroscopy Prism Grating Interferomete r Michelson Fabry-Perot Interferometer (FTS)
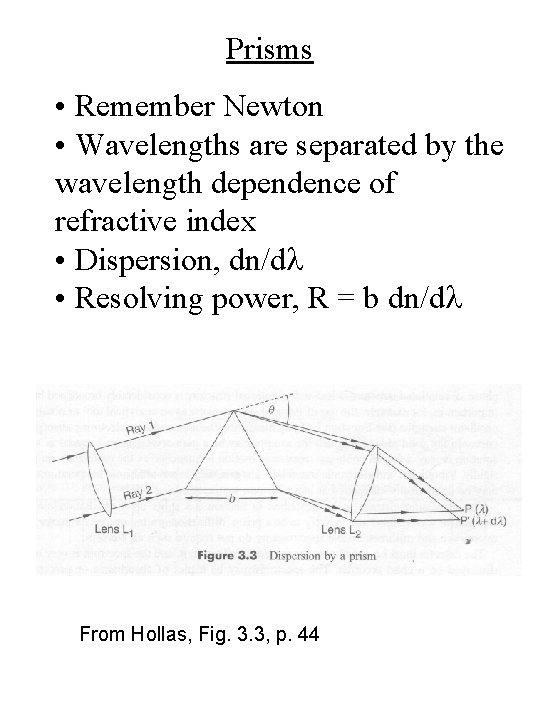
Prisms • Remember Newton • Wavelengths are separated by the wavelength dependence of refractive index • Dispersion, dn/dl • Resolving power, R = b dn/dl From Hollas, Fig. 3. 3, p. 44
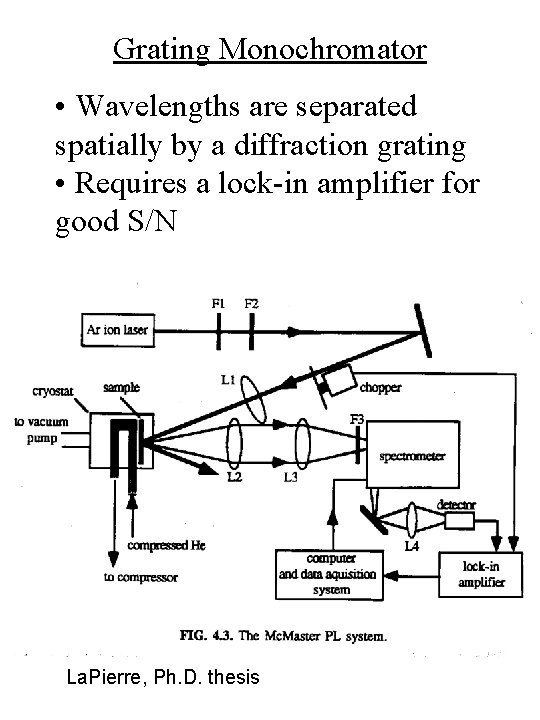
Grating Monochromator • Wavelengths are separated spatially by a diffraction grating • Requires a lock-in amplifier for good S/N La. Pierre, Ph. D. thesis
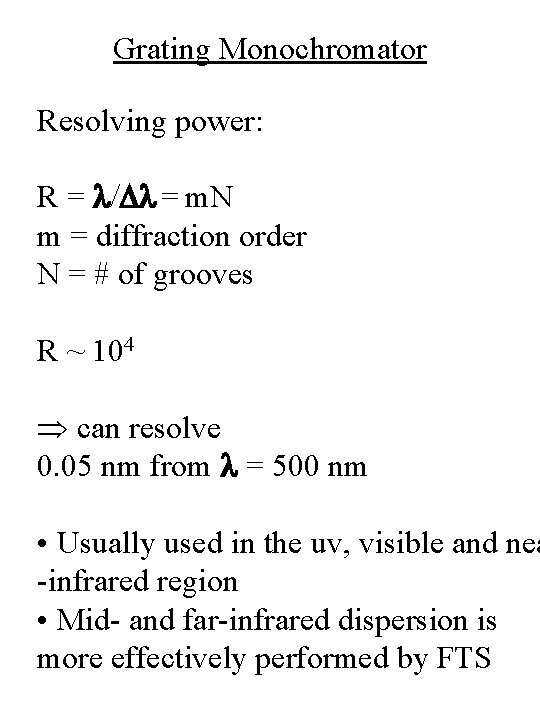
Grating Monochromator Resolving power: R = l/Dl = m. N m = diffraction order N = # of grooves R ~ 104 can resolve 0. 05 nm from l = 500 nm • Usually used in the uv, visible and nea -infrared region • Mid- and far-infrared dispersion is more effectively performed by FTS
Interferometers • Interference can result in dispersion of wavelengths • Remember oil slicks
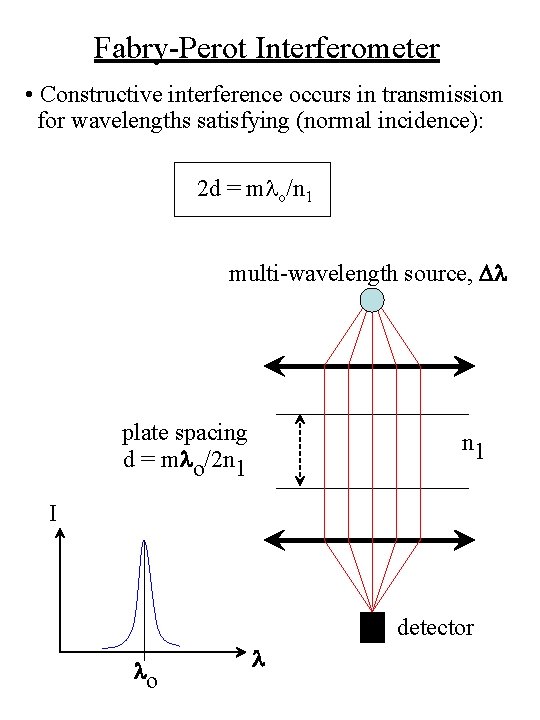
Fabry-Perot Interferometer • Constructive interference occurs in transmission for wavelengths satisfying (normal incidence): 2 d = mlo/n 1 multi-wavelength source, Dl plate spacing d = mlo/2 n 1 I detector lo l
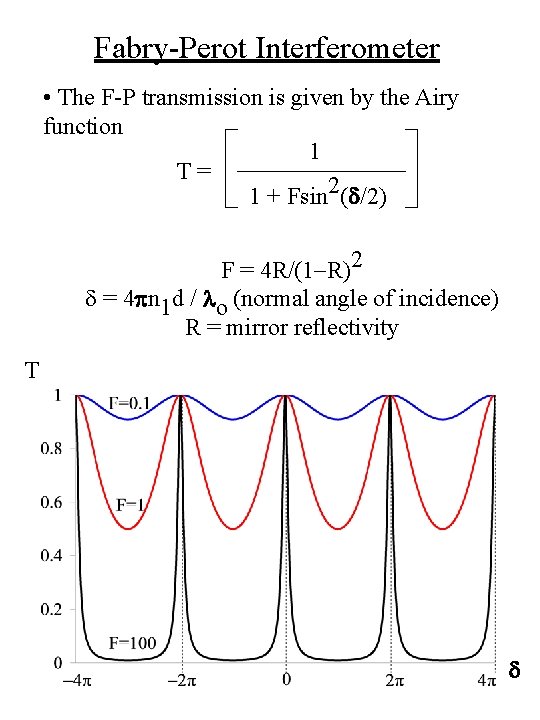
Fabry-Perot Interferometer • The F-P transmission is given by the Airy function 1 T= 1 + Fsin 2(d/2) F = 4 R/(1 -R)2 d = 4 pn 1 d / lo (normal angle of incidence) R = mirror reflectivity T d
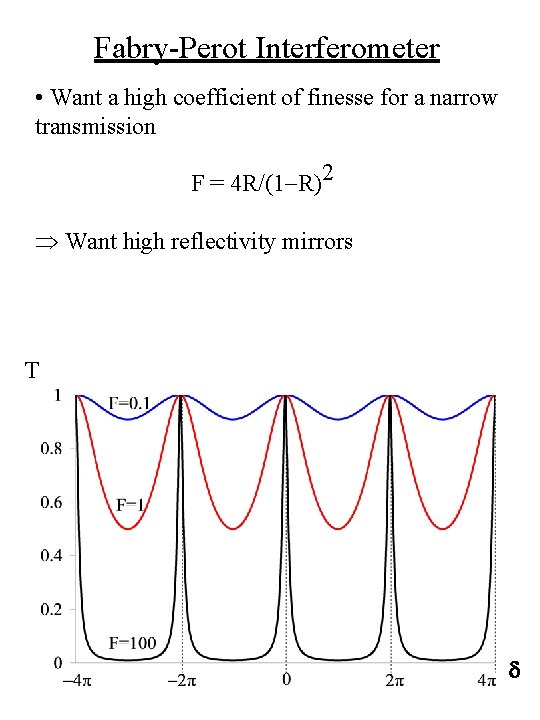
Fabry-Perot Interferometer • Want a high coefficient of finesse for a narrow transmission F = 4 R/(1 -R)2 Want high reflectivity mirrors T d
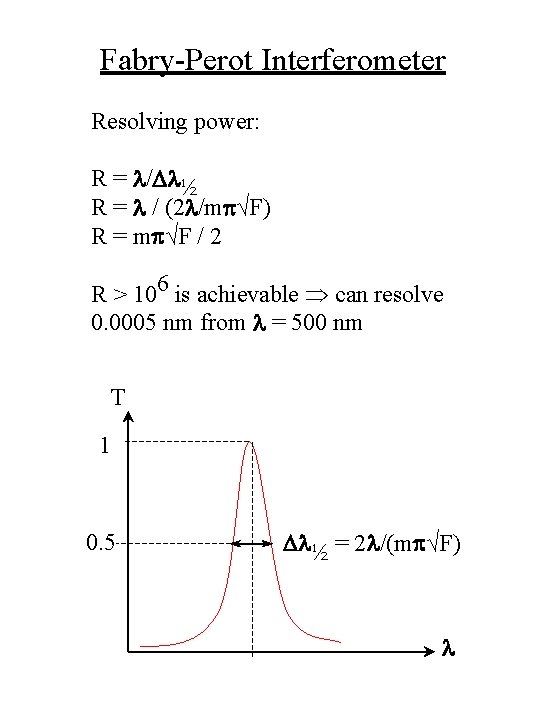
Fabry-Perot Interferometer Resolving power: R = l/Dl½ R = l / (2 l/mp√F) R = mp√F / 2 R > 106 is achievable can resolve 0. 0005 nm from l = 500 nm T 1 0. 5 Dl½ = 2 l/(mp√F) l
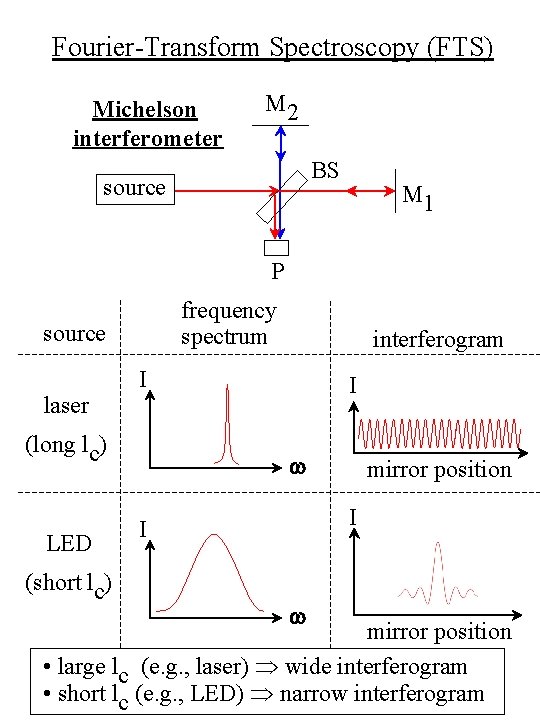
Fourier-Transform Spectroscopy (FTS) Michelson interferometer M 2 BS source M 1 P frequency spectrum source laser I (long lc) LED (short lc) interferogram I w mirror position I I w mirror position • large lc (e. g. , laser) wide interferogram • short lc (e. g. , LED) narrow interferogram
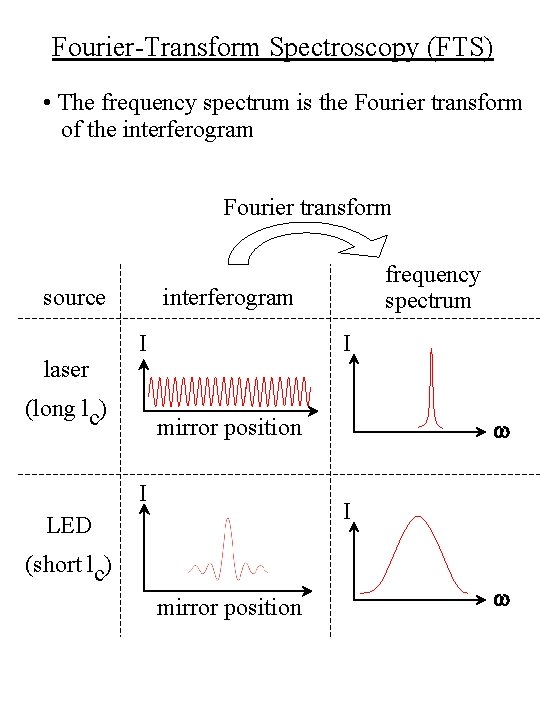
Fourier-Transform Spectroscopy (FTS) • The frequency spectrum is the Fourier transform of the interferogram Fourier transform source laser frequency spectrum interferogram I (long lc) I w mirror position I I LED (short lc) mirror position w
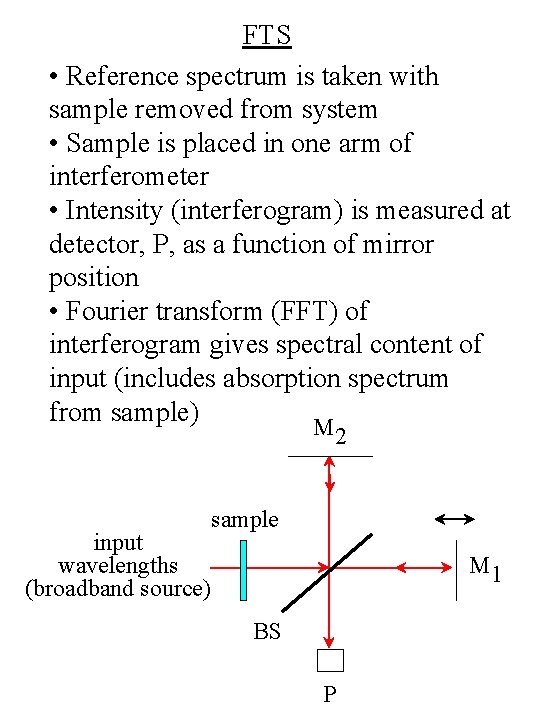
FTS • Reference spectrum is taken with sample removed from system • Sample is placed in one arm of interferometer • Intensity (interferogram) is measured at detector, P, as a function of mirror position • Fourier transform (FFT) of interferogram gives spectral content of input (includes absorption spectrum from sample) M 2 input wavelengths (broadband source) sample M 1 BS P
FTS • FTS usually used in the near-, mid-, and far-infrared wavelength range • Also called Fourier transform infrared spectroscopy (FTIR spectroscopy) • Strong absorption by H 2 O; must purge optical path with N 2 • Windows in the system must be transparent to the wavelengths of interest
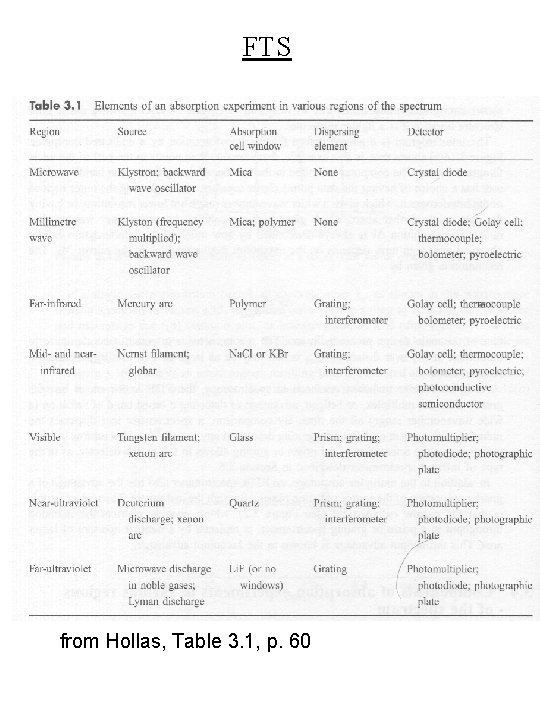
FTS from Hollas, Table 3. 1, p. 60
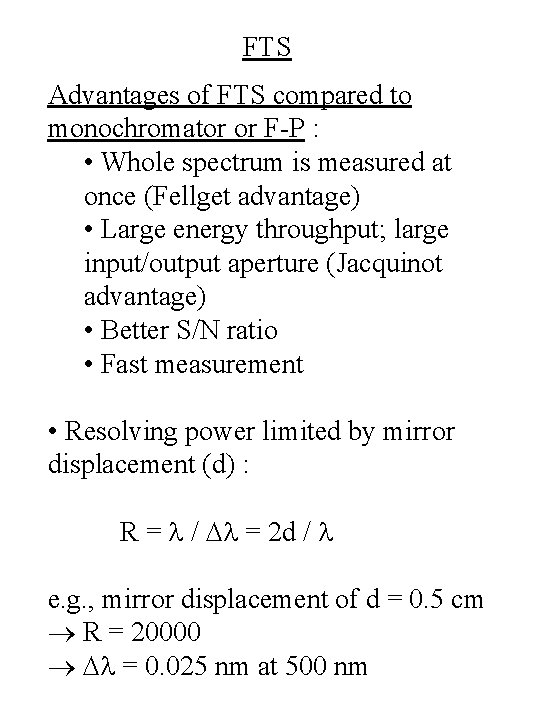
FTS Advantages of FTS compared to monochromator or F-P : • Whole spectrum is measured at once (Fellget advantage) • Large energy throughput; large input/output aperture (Jacquinot advantage) • Better S/N ratio • Fast measurement • Resolving power limited by mirror displacement (d) : R = l / Dl = 2 d / l e. g. , mirror displacement of d = 0. 5 cm R = 20000 Dl = 0. 025 nm at 500 nm