
OPEX and Profitability AnalysisII Chapter 17 Seider CH
OPEX and Profitability Analysis-II Chapter 17 Seider CH EN 5253 Terry A. Ring
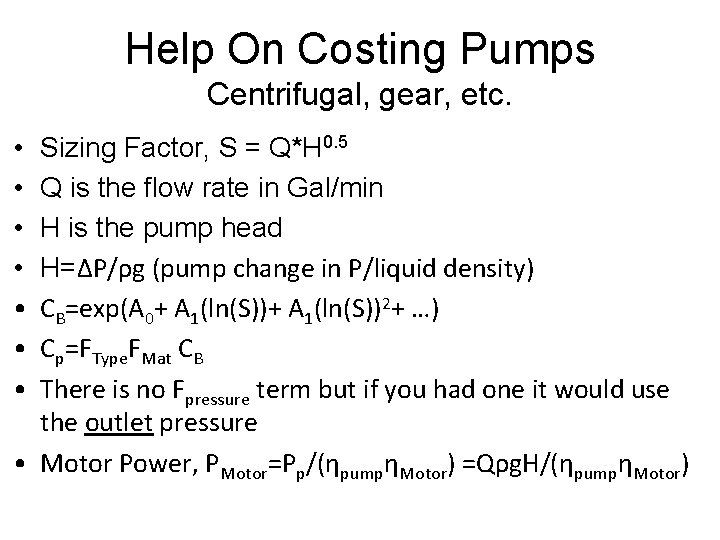
Help On Costing Pumps Centrifugal, gear, etc. • • Sizing Factor, S = Q*H 0. 5 Q is the flow rate in Gal/min H is the pump head H=ΔP/ρg (pump change in P/liquid density) CB=exp(A 0+ A 1(ln(S))2+ …) Cp=FType. FMat CB There is no Fpressure term but if you had one it would use the outlet pressure • Motor Power, PMotor=Pp/(ηpumpηMotor) =Qρg. H/(ηpumpηMotor)
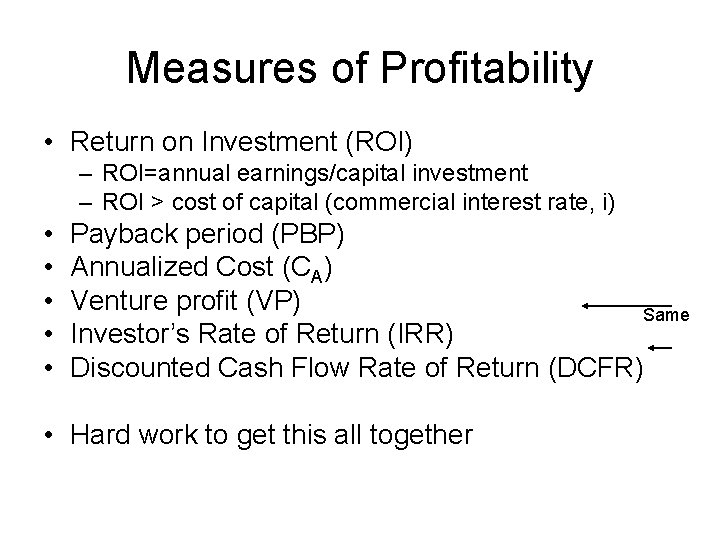
Measures of Profitability • Return on Investment (ROI) – ROI=annual earnings/capital investment – ROI > cost of capital (commercial interest rate, i) • • • Payback period (PBP) Annualized Cost (CA) Venture profit (VP) Same Investor’s Rate of Return (IRR) Discounted Cash Flow Rate of Return (DCFR) • Hard work to get this all together
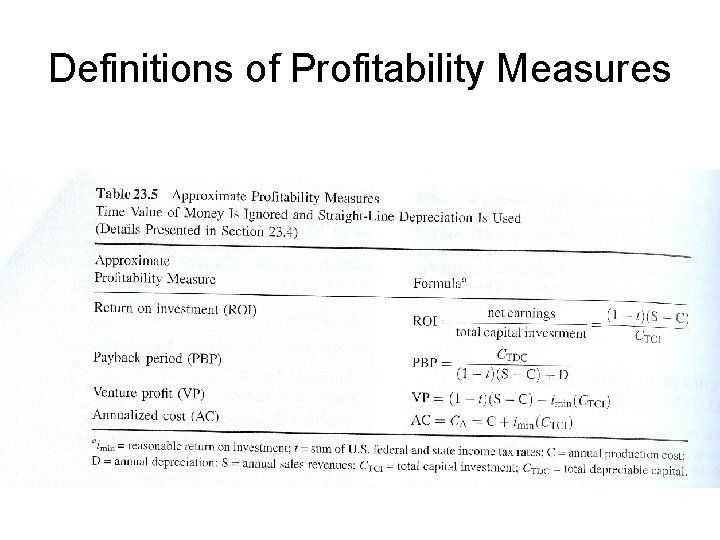
Definitions of Profitability Measures
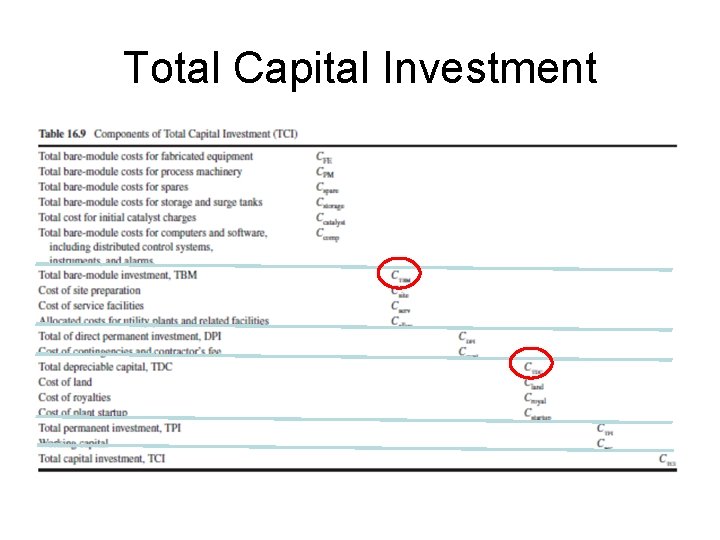
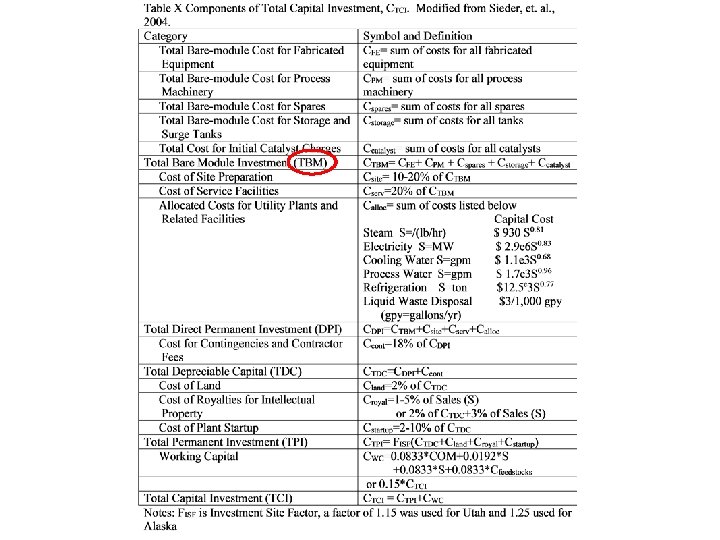
Total Capital Investment
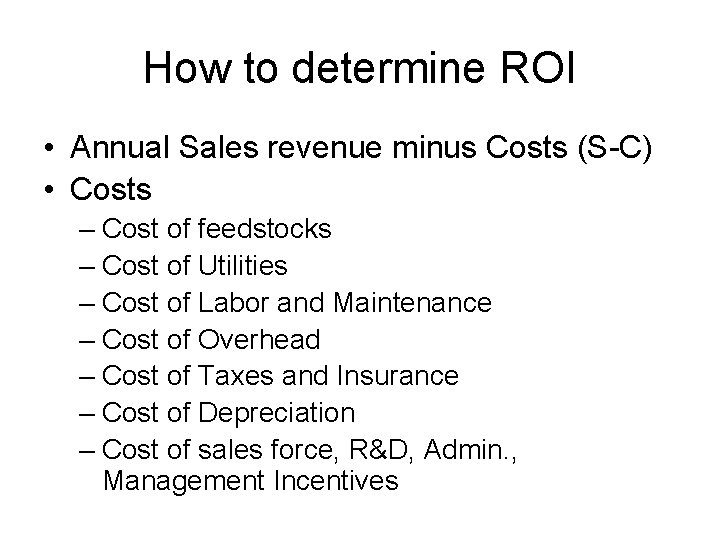
How to determine ROI • Annual Sales revenue minus Costs (S-C) • Costs – Cost of feedstocks – Cost of Utilities – Cost of Labor and Maintenance – Cost of Overhead – Cost of Taxes and Insurance – Cost of Depreciation – Cost of sales force, R&D, Admin. , Management Incentives
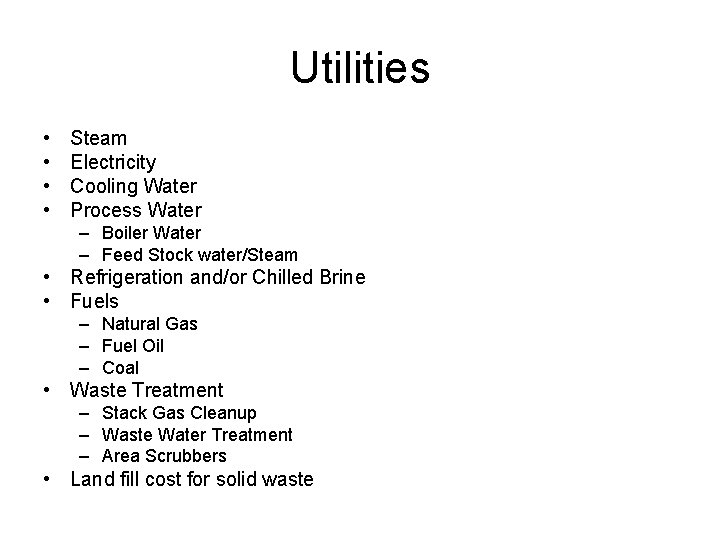
Utilities • • Steam Electricity Cooling Water Process Water – Boiler Water – Feed Stock water/Steam • Refrigeration and/or Chilled Brine • Fuels – Natural Gas – Fuel Oil – Coal • Waste Treatment – Stack Gas Cleanup – Waste Water Treatment – Area Scrubbers • Land fill cost for solid waste
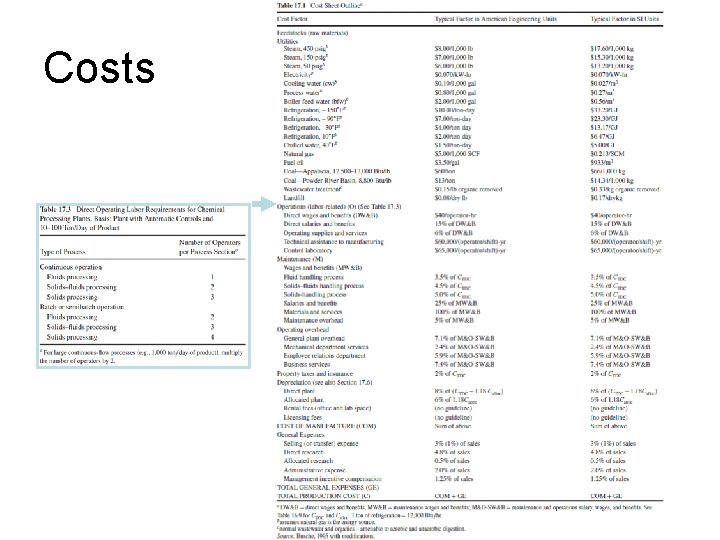
Costs
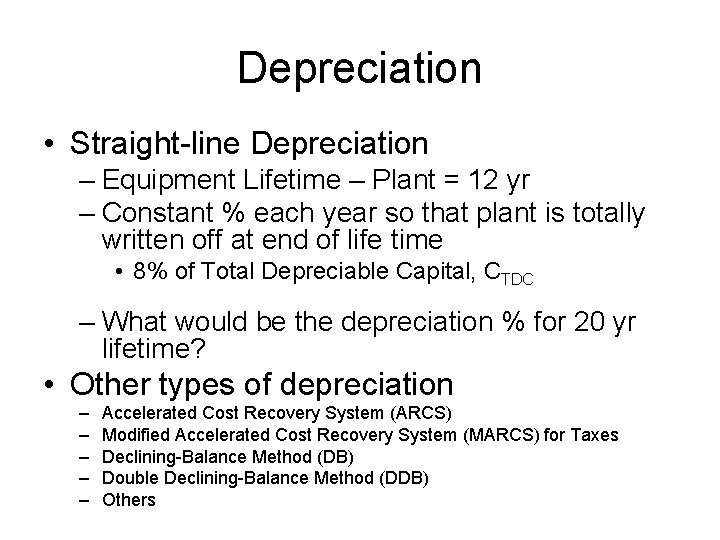
Depreciation • Straight-line Depreciation – Equipment Lifetime – Plant = 12 yr – Constant % each year so that plant is totally written off at end of life time • 8% of Total Depreciable Capital, CTDC – What would be the depreciation % for 20 yr lifetime? • Other types of depreciation – – – Accelerated Cost Recovery System (ARCS) Modified Accelerated Cost Recovery System (MARCS) for Taxes Declining-Balance Method (DB) Double Declining-Balance Method (DDB) Others
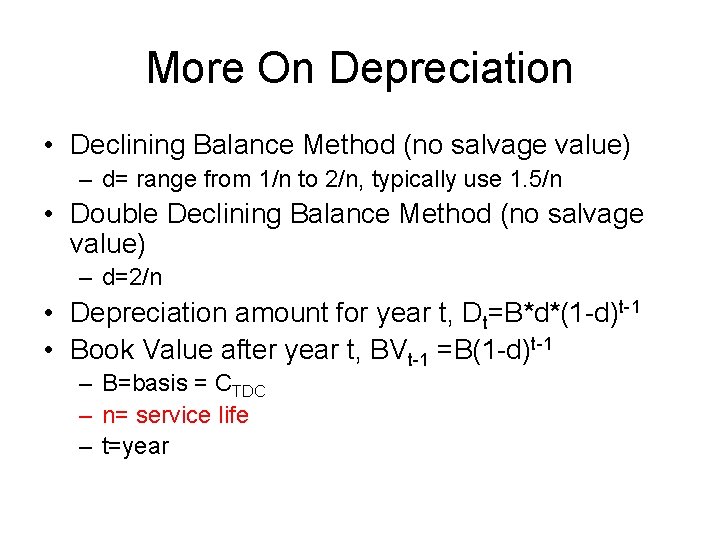
More On Depreciation • Declining Balance Method (no salvage value) – d= range from 1/n to 2/n, typically use 1. 5/n • Double Declining Balance Method (no salvage value) – d=2/n • Depreciation amount for year t, Dt=B*d*(1 -d)t-1 • Book Value after year t, BVt-1 =B(1 -d)t-1 – B=basis = CTDC – n= service life – t=year
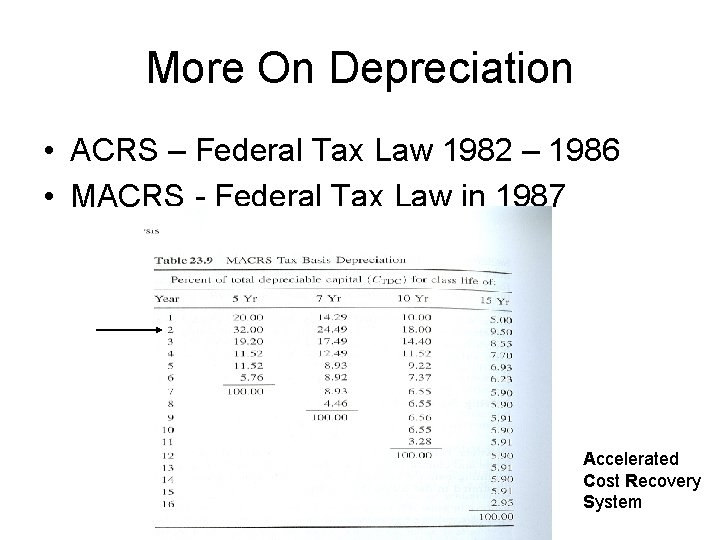
More On Depreciation • ACRS – Federal Tax Law 1982 – 1986 • MACRS - Federal Tax Law in 1987 Accelerated Cost Recovery System
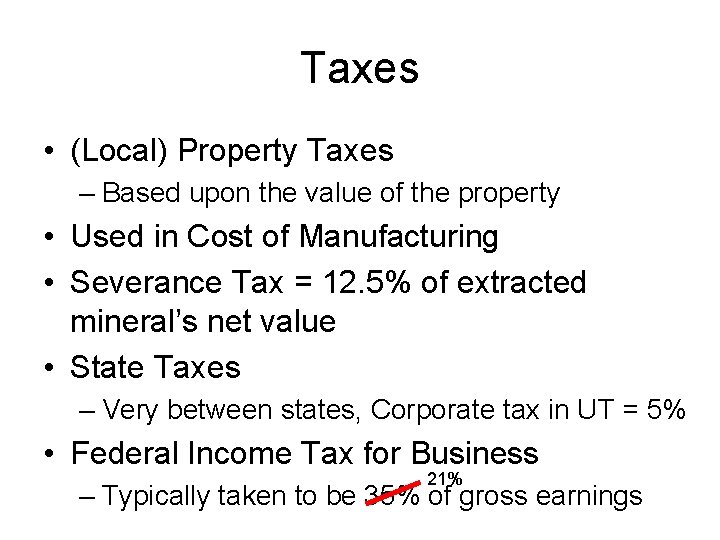
Taxes • (Local) Property Taxes – Based upon the value of the property • Used in Cost of Manufacturing • Severance Tax = 12. 5% of extracted mineral’s net value • State Taxes – Very between states, Corporate tax in UT = 5% • Federal Income Tax for Business 21% – Typically taken to be 35% of gross earnings
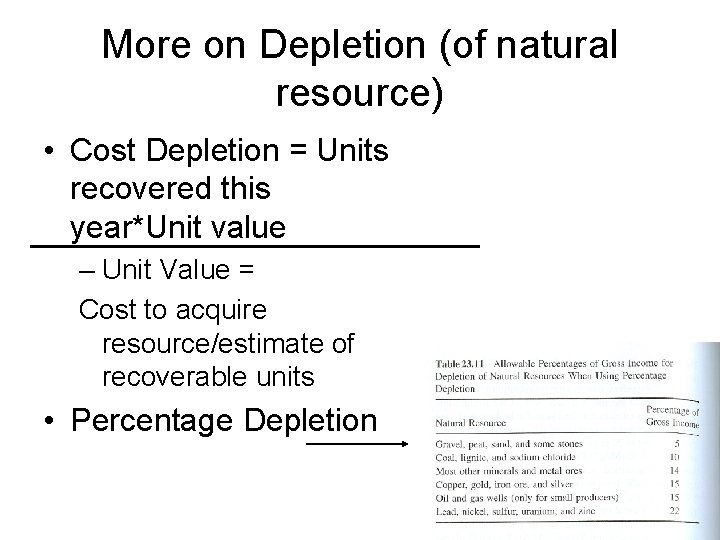
More on Depletion (of natural resource) • Cost Depletion = Units recovered this year*Unit value – Unit Value = Cost to acquire resource/estimate of recoverable units • Percentage Depletion
Total Production Cost, C • Cost of Manufacturing minus general expenses • C=COM+General Expenses • General Expenses (see slide 7) – Selling expenses, R&D, Admin. (top management), Management Incentive Package
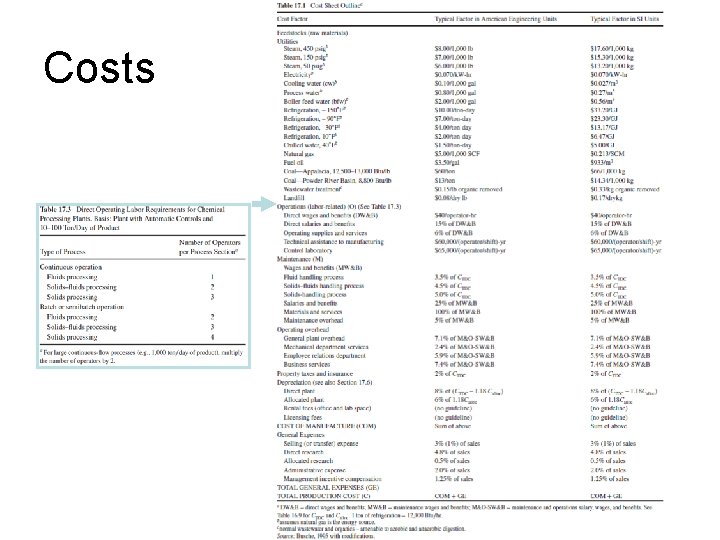
Costs
Cost of Manufacturing (COM) • Direct manufacturing costs – Feedstocks, Utilities, labor related to operations, maintenance • Operating overhead • Fixed costs – Property Tax, Insurance, Depreciation
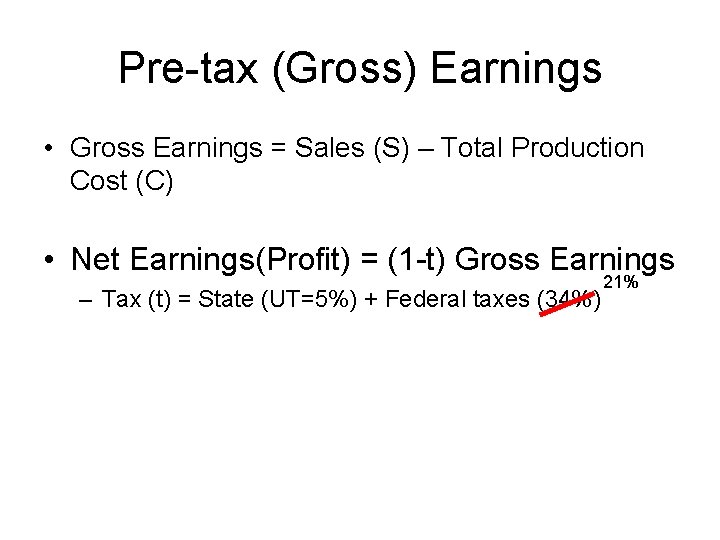
Pre-tax (Gross) Earnings • Gross Earnings = Sales (S) – Total Production Cost (C) • Net Earnings(Profit) = (1 -t) Gross Earnings – Tax (t) = State (UT=5%) + Federal taxes (34%) 21%
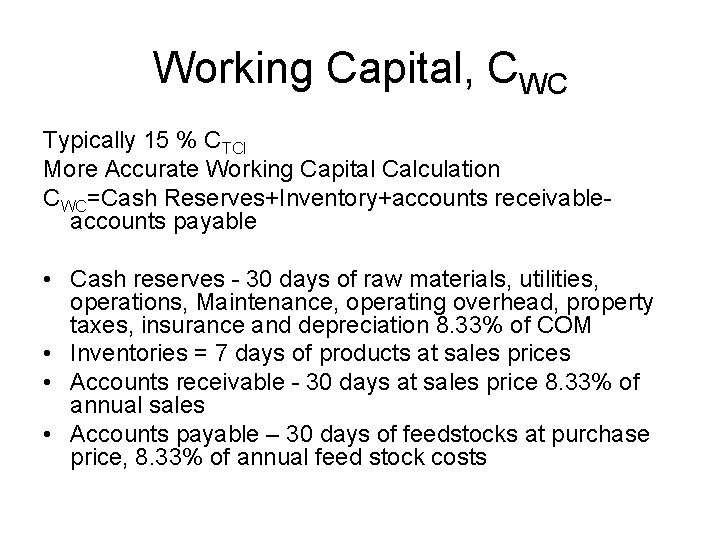
Working Capital, CWC Typically 15 % CTCI More Accurate Working Capital Calculation CWC=Cash Reserves+Inventory+accounts receivableaccounts payable • Cash reserves - 30 days of raw materials, utilities, operations, Maintenance, operating overhead, property taxes, insurance and depreciation 8. 33% of COM • Inventories = 7 days of products at sales prices • Accounts receivable - 30 days at sales price 8. 33% of annual sales • Accounts payable – 30 days of feedstocks at purchase price, 8. 33% of annual feed stock costs
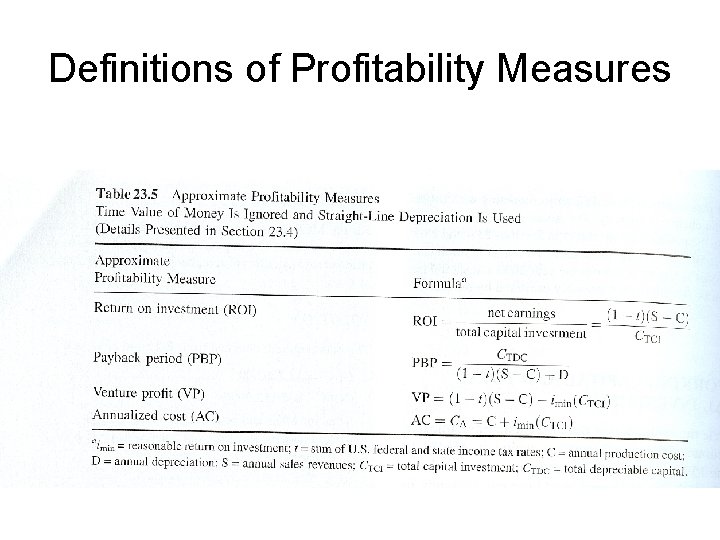
Definitions of Profitability Measures
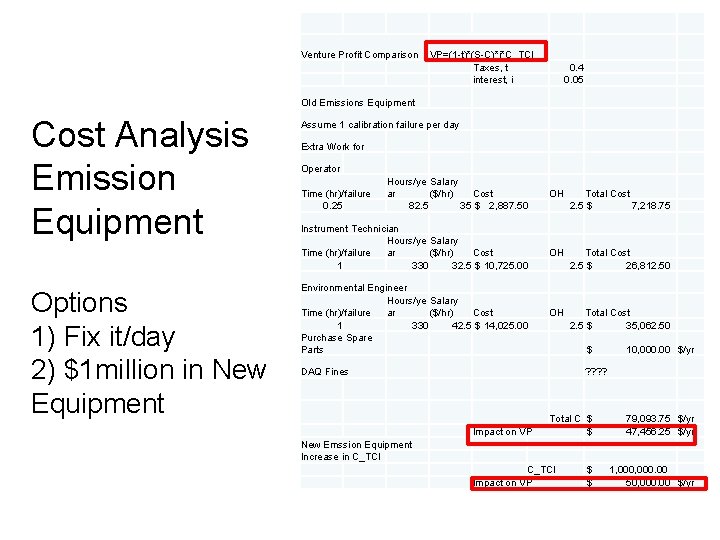
Venture Profit Comparison VP=(1 -t)*(S-C)*i*C_TCI Taxes, t interest, i 0. 4 0. 05 Old Emissions Equipment Cost Analysis Emission Equipment Options 1) Fix it/day 2) $1 million in New Equipment Assume 1 calibration failure per day Extra Work for Operator Time (hr)/failure 0. 25 Hours/ye Salary ar ($/hr) Cost 82. 5 35 $ 2, 887. 50 Instrument Technician Hours/ye Salary Time (hr)/failure ar ($/hr) Cost 1 330 32. 5 $ 10, 725. 00 Environmental Engineer Hours/ye Salary Time (hr)/failure ar ($/hr) Cost 1 330 42. 5 $ 14, 025. 00 Purchase Spare Parts OH Total Cost 2. 5 $ 7, 218. 75 OH Total Cost 2. 5 $ 26, 812. 50 OH Total Cost 2. 5 $ 35, 062. 50 $ DAQ Fines 10, 000. 00 $/yr ? ? Impact on VP Total C $ $ 79, 093. 75 $/yr 47, 456. 25 $/yr New Emssion Equipment Increase in C_TCI Impact on VP $ $ 1, 000. 00 50, 000. 00 $/yr
Selling Price for Given ROI • For a new product without an established market • Sale price may very – High Sales price • Assume ROI say 40% (This is a home run!!) • Back calculate the sales price. – Low Sales price • Set VP to Zero • Back calculate the sales price • (this is the same as ROI calc above when imin is 20%)
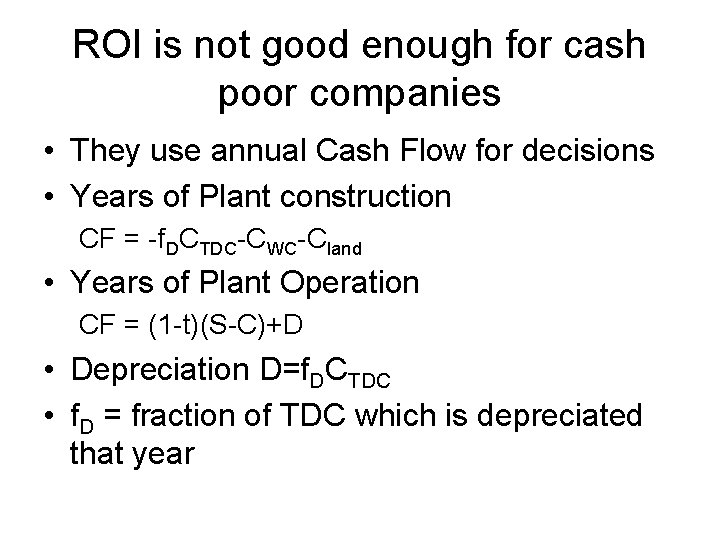
ROI is not good enough for cash poor companies • They use annual Cash Flow for decisions • Years of Plant construction CF = -f. DCTDC-CWC-Cland • Years of Plant Operation CF = (1 -t)(S-C)+D • Depreciation D=f. DCTDC • f. D = fraction of TDC which is depreciated that year
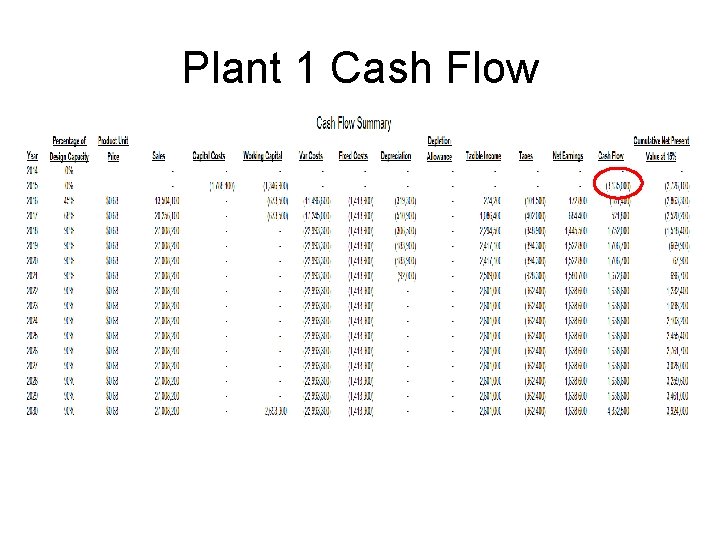
Plant 1 Cash Flow
Using Excel for Profitability Analysis, Cash Flow and OPEX • • Steps to get ready Get Chemical Prices Get Cost of Utilities Run Aspen/Pro. Max – Raw Material Flow Rate (kg/yr) – Production Rates (kg/y) – Utilities used (kg/y) • Determine installed cost of equipment (CAPEX) • Only then are you ready to use this spread sheet
- Slides: 25