Operations Management Lecture 31 Location Strategies Layout Strategies


- Slides: 39

Operations Management Lecture 31 - Location Strategies - Layout Strategies © 2008 Prentice Hall, Inc. Power. Point presentation to accompany Heizer/Render Principles of Operations Management, 7 e Operations Management, 9 e 8– 1

Recap þ Reasons to be globalized þ Issues in operations strategy þ Elements of operations management strategy þ Four international operations strategies þ HR strategy þ Labor Planning þ Work Schedules þ Job design þ Job characteristics þ Benefits of teamwork þ Ethical issues © 2008 Prentice Hall, Inc. 8– 2

Outline þ Location Strategy-Cost and Innovation þ Factors That Affect Location Decisions þ Methods of Evaluating Location Alternatives © 2008 Prentice Hall, Inc. 8– 3

Outline þ The Strategic Importance of Layout Decisions þ Layout Design Considerations þ Types of Layout Ø Office Layout Ø Retail Layout Ø Warehouse and Storage Layout Ø Fixed Position Layout Ø Process Oriented Layout Ø Work Cells Ø Repetitive and Product Oriented Layout © 2008 Prentice Hall, Inc. 8– 4

Location Strategy þ One of the most important decisions a firm makes þ Increasingly global in nature þ Significant impact on fixed and variable costs þ Decisions made relatively infrequently þ The objective is to maximize the benefit of location to the firm © 2008 Prentice Hall, Inc. 8– 5

Location and Costs þ Location decisions based on low cost require careful consideration þ Once in place, location-related costs are fixed in place and difficult to reduce þ Determining optimal facility location is a good investment © 2008 Prentice Hall, Inc. 8– 6

Location and Innovation þ Cost is not always the most important aspect of a strategic decision þ Four key attributes when strategy is based on innovation þ High-quality and specialized inputs þ An environment that encourages investment and local rivalry þ A sophisticated local market þ Local presence of related and supporting industries © 2008 Prentice Hall, Inc. 8– 7

Location Decisions þ Long-term decisions þ Decisions made infrequently þ Decision greatly affects both fixed and variable costs þ Once committed to a location, many resource and cost issues are difficult to change © 2008 Prentice Hall, Inc. 8– 8

Factors That Affect Location Decisions þ Labor Productivity þ Exchange rates and currency risks þ Costs þ þ Political risk, values, and culture Proximity to markets þ Proximity to suppliers þ Proximity to competitors © 2008 Prentice Hall, Inc. 8– 9

Factor-Rating Method þ Popular because a wide variety of factors can be included in the analysis þ Six steps in the method 1. Develop a list of relevant factors called critical success factors 2. Assign a weight to each factor 3. Develop a scale for each factor 4. Score each location for each factor 5. Multiply score by weights for each factor for each location 6. Recommend the location with the highest point score © 2008 Prentice Hall, Inc. 8 – 10

Factor-Rating Example Critical Success Factor Labor availability and attitude People-tocar ratio Per capita income Tax structure Education and health Totals Scores (out of 100) Weight France Denmark Weighted Scores France Denmark . 25 70 60 . 05 50 60 . 10. 39 85 75 80 70 (. 10)(85) = 8. 5 (. 10)(80) = 8. 0 (. 39)(75) = 29. 3 (. 39)(70) = 27. 3 . 21 60 70 (. 21)(60) = 12. 6 (. 21)(70) = 14. 7 1. 00 (. 25)(70) = 17. 5 (. 25)(60) = 15. 0 (. 05)(50) = 2. 5 70. 4 (. 05)(60) = 3. 0 68. 0 Table 8. 4 © 2008 Prentice Hall, Inc. 8 – 11

Locational Break-Even Analysis þ Method of cost-volume analysis used for industrial locations þ Three steps in the method 1. Determine fixed and variable costs for each location 2. Plot the cost for each location 3. Select location with lowest total cost for expected production volume © 2008 Prentice Hall, Inc. 8 – 12

Locational Break-Even Analysis Example Three locations: Selling price = $120 Expected volume = 2, 000 units Fixed Variable Total City Cost Akron $30, 000 $75$180, 000 Bowling Green $60, 000 $45$150, 000 Chicago $110, 000 $25$160, 000 Total Cost = Fixed Cost + (Variable Cost x Volume) © 2008 Prentice Hall, Inc. 8 – 13

Annual cost Locational Break-Even Analysis Example Figure 8. 2 © 2008 Prentice Hall, Inc. – $180, 000 – – $160, 000 – $150, 000 – e – curv t s o $130, 000 – go c a c i – Ch $110, 000 – n ee r – g G rve n i – owl t cu s $80, 000 – B co t s – co n $60, 000 – ro rve k – A cu – Akron Bowling Green $30, 000 – lowest cost – cost $10, 000 – | | | – 0 500 1, 000 1, 500 2, 000 Volume Chicago lowest cost | | 2, 500 3, 000 8 – 14

Center-of-Gravity Method þ Finds location of distribution center that minimizes distribution costs þ Considers þ Location of markets þ Volume of goods shipped to those markets þ Shipping cost (or distance) © 2008 Prentice Hall, Inc. 8 – 15

Center-of-Gravity Method þ Place existing locations on a coordinate grid þ Grid origin and scale is arbitrary þ Maintain relative distances þ Calculate X and Y coordinates for ‘center of gravity’ þ Assumes cost is directly proportional to distance and volume shipped © 2008 Prentice Hall, Inc. 8 – 16

Center-of-Gravity Method x - coordinate = ∑dix. Qi i ∑Qi i y - coordinate = ∑diy. Qi i ∑Qi i where © 2008 Prentice Hall, Inc. dix = x-coordinate of location i diy = y-coordinate of location i Qi = Quantity of goods moved to or from location i 8 – 17

Center-of-Gravity Method North-South New York (130, 130) Chicago (30, 120) 120 – Pittsburgh (90, 110) 90 – 60 – 30 – | – Atlanta (60, 40) | 30 Arbitrary origin © 2008 Prentice Hall, Inc. | | 60 90 120 150 East-West Figure 8. 3 8 – 18

Center-of-Gravity Method Number of Containers Store Location Shipped per Month Chicago (30, 120) 2, 000 Pittsburgh (90, 110) 1, 000 New York (130, 130) 1, 000 Atlanta (60, 40) 2, 000 (30)(2000) + (90)(1000) + (130)(1000) + (60)(2000) x-coordinate = 2000 + 1000 + 2000 = 66. 7 (120)(2000) + (110)(1000) + (130)(1000) + (40)(2000) y-coordinate = 2000 + 1000 + 2000 = 93. 3 © 2008 Prentice Hall, Inc. 8 – 19

Center-of-Gravity Method North-South New York (130, 130) Chicago (30, 120) 120 – Pittsburgh (90, 110) + 90 – Center of gravity (66. 7, 93. 3) 60 – 30 – | – Atlanta (60, 40) | 30 Arbitrary origin © 2008 Prentice Hall, Inc. | | 60 90 120 150 East-West Figure 8. 3 8 – 20

Strategic Importance of Layout Decisions The objective of layout strategy is to develop a cost-effective layout that will meet a firm’s competitive needs © 2008 Prentice Hall, Inc. 8 – 21

Layout Design Considerations þ Higher utilization of space, equipment, and people þ Improved flow of information, materials, or people þ Improved employee morale and safer working conditions þ Improved customer/client interaction © 2008 Prentice Hall, Inc. 8 – 22

Types of Layout 1. Office layout 2. Retail layout 3. Warehouse layout 4. Fixed-position layout 5. Process-oriented layout 6. Work-cell layout 7. Product-oriented layout © 2008 Prentice Hall, Inc. 8 – 23

Office Layout þ Grouping of workers, their equipment, and spaces to provide comfort, safety, and movement of information þ Movement of information is main distinction þ Typically in state of flux due to frequent technological changes © 2008 Prentice Hall, Inc. 8 – 24

Retail Layout þ Objective is to maximize profitability per square foot of floor space þ Sales and profitability vary directly with customer exposure © 2008 Prentice Hall, Inc. 8 – 25

Five Helpful Ideas for Supermarket Layout 1. Locate high-draw items around the periphery of the store 2. Use prominent locations for high-impulse and high-margin items 3. Distribute power items to both sides of an aisle and disperse them to increase viewing of other items 4. Use end-aisle locations 5. Convey mission of store through careful positioning of lead-off department © 2008 Prentice Hall, Inc. 8 – 26

Store Layout Figure 9. 2 © 2008 Prentice Hall, Inc. 8 – 27

Retail Slotting þ Manufacturers pay fees to retailers to get the retailers to display (slot) their product þ Contributing factors þ Limited shelf space þ An increasing number of new products þ Closer control of inventory © 2008 Prentice Hall, Inc. 8 – 28

Warehousing and Storage Layouts þ Objective is to optimize trade-offs between handling costs and costs associated with warehouse space þ Maximize the total “cube” of the warehouse – utilize its full volume while maintaining low material handling costs © 2008 Prentice Hall, Inc. 8 – 29

Warehousing and Storage Layouts Material Handling Costs þ All costs associated with the transaction þ Incoming transport þ Storage þ Finding and moving material þ Outgoing transport þ Equipment, people, material, supervision, insurance, depreciation þ Minimize damage and spoilage © 2008 Prentice Hall, Inc. 8 – 30

Warehouse Layout Traditional Layout Customization Storage racks Conveyor Staging Office Shipping and receiving docks © 2008 Prentice Hall, Inc. 8 – 31

Fixed-Position Layout þ Product remains in one place þ Workers and equipment come to site þ Complicating factors þ Limited space at site þ Different materials required at different stages of the project þ Volume of materials needed is dynamic © 2008 Prentice Hall, Inc. 8 – 32

Process-Oriented Layout þ Like machines and equipment are grouped together þ Flexible and capable of handling a wide variety of products or services þ Scheduling can be difficult and setup, material handling, and labor costs can be high © 2008 Prentice Hall, Inc. 8 – 33

Process-Oriented Layout ER triage room Patient A - broken leg Emergency room admissions Patient B - erratic heart pacemaker Surgery Laboratories Radiology ER Beds Pharmacy Billing/exit Figure 9. 3 © 2008 Prentice Hall, Inc. 8 – 34

Process-Oriented Layout þ Arrange work centers so as to minimize the costs of material handling þ Basic cost elements are þ Number of loads (or people) moving between centers þ Distance loads (or people) move between centers © 2008 Prentice Hall, Inc. 8 – 35

Work Cells þ Reorganizes people and machines into groups to focus on single products or product groups þ Group technology identifies products that have similar characteristics for particular cells þ Volume must justify cells þ Cells can be reconfigured as designs or volume changes © 2008 Prentice Hall, Inc. 8 – 36

Improving Layouts Using Work Cells Current layout - workers in small closed areas. Cannot increase output without a third worker and third set of equipment. Improved layout - cross-trained workers can assist each other. May be able to add a third worker as additional output is needed. Figure 9. 10 (a) © 2008 Prentice Hall, Inc. 8 – 37

Repetitive and Product-Oriented Layout Organized around products or families of similar high-volume, low-variety products 1. Volume is adequate for high equipment utilization 2. Product demand is stable enough to justify high investment in specialized equipment 3. Product is standardized or approaching a phase of life cycle that justifies investment 4. Supplies of raw materials and components are adequate and of uniform quality © 2008 Prentice Hall, Inc. 8 – 38

Product-Oriented Layouts þ Fabrication line þ Builds components on a series of machines þ Machine-paced þ Require mechanical or engineering changes to balance þ Assembly line þ Puts fabricated parts together at a series of workstations þ Paced by work tasks þ Balanced by moving tasks Both types of lines must be balanced so that the time to perform the work at each station is the same © 2008 Prentice Hall, Inc. 8 – 39
 Location analysis in operations management
 Seven layout strategies
 Layout strategy
 Operations management lecture notes doc
 Location planning and analysis in operations management
 Chapter 8 location planning and analysis
 Location strategy in operations management
 Location strategy in operations management
 Interdepartmental flow graph
 Layout strategy
 Horizontal line image
 Retail layout operations management
 Hybrid layout in operations management
 Layout definition in operations management
 Layout and flow in operations management
 Layout decisions operations management
 Long thin vs short fat process
 Layout strategy in operations management
 01:640:244 lecture notes - lecture 15: plat, idah, farad
 Implementing strategies management and operations issues
 Implementing strategies management and operations issues
 Implementing strategies: management and operations issues
 Four basic process strategies
 Repetitive focus strategy
 Implementing strategies management and operations issues
 Operations management chapter 7 solutions
 Implementing strategies management and operations issues
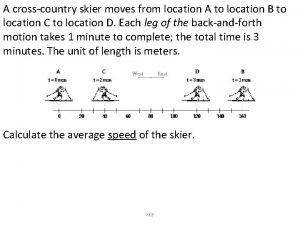
 A cross country skier moves from location a
 Perencanaan lokasi perusahaan
 Infrastructure of hospital pharmacy
 Hospital pharmacy definition
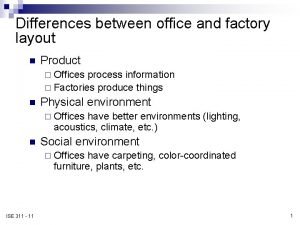
 Factory office layout
 Tactical operations center layout
 Operations and quality management
 Chapter 12 inventory management
 What is tqm
 Numerator layout
 Language
 Mpeg-1
 Liquid layout website


