Operations Division 2020 Budget Summit Operations FTE 2016

Operations Division 2020 Budget Summit

Operations FTE 2016 -2019 Unit Operations Office 2016 2017 2018 2019 2020 2. 00 0 0 5. 00 8. 24 10. 24 9. 00 8. 00 Information Services 66. 00 64. 00 66. 00 65. 50 62. 50 Facilities Management 97. 25 103. 74 102. 75 103. 25 University Police & Public Safety 11. 00 10. 17 11. 17 13. 25 13. 65 184 192 193 194 $13. 4 M $14. 2 M $15. 7 M $16. 1 M $17. 3 M Business Intelligence Institutional Effectiveness Total Initial Budget (Wages & Benefits)

Operations FTE & Salaries 2016 -2019

OPS FTE & Salaries to Student FTE % Growth FY 2016 -2019

New Positions Added 2016 – 2020: 10 • • *Funded State provided impact funding for Discovery Hall and Samuelson (IS, FMD, & UPPS): 6 New Environmental Health & Safety positions: 2 New Business Intelligence positions: 2 New Sustainability Coordinator position: 1* through OPS/BFA/ASL partnership, started 1/2/2020

Operations Salary Savings FY 2017 - 2020 Salary Savings Percent of total budget Returned to university funds 2017 2018 2019 2020 $256, 715 $963, 118 $834, 669 $434, 098 1. 28% 4. 90% 4. 44% 2. 20% $223, 381 $94, 142 $11, 684 TBD
 Unit Budget Increase Budget Decreases 2%")
Stewardship of Budget Increases (FY 2017 – 2020) Unit Budget Increase Budget Decreases 2% Budget Cut Total • • 1 2 2017 2018 2019 2020 $371, 000 $677, 831 $123, 900 $558, 000 ($169, 992) ($82, 100) ($1, 288, 402) ($110, 579) $0 ($454, 234)1 ($454, 234)2 TBD $201, 008 $141, 497 ($1, 618, 736) $447, 421 The majority of increases and decreases are continuous funding Primary funding source was state impact funding for new construction (FY 17 & FY 20) Budget increases also covered software license and utilities increases (FY 18 & FY 19) Funding received is primarily used for original intent (e. g. salaries, license costs, and utilities) Efficiency target taken at end of FY 18 Budget cut taken at beginning of FY 19
 • • • Number of")
Previous Budget Allocation Requests (FY 16 – FY 20) • • • Number of requests: 1 Project Management Office (2019) for $259, 250 Prioritized by President’s Cabinet and funded via self-support Risks include other departments not budgeting for PMO services Impacts are positive and evidenced by successful projects and efficiencies
1 2016 2017 2018 2019 2020 %")
Operations Metrics Diversity of OPS staff (All Funds)1 2016 2017 2018 2019 2020 % Not W/E/ME 9. 6% 10. 3% 9. 1% 11. 0% 10. 2% % Female 32. 7% 30. 0% 31. 3% 31. 8% OPS Budget as a % of CWU Budget 1 Analytics 2016 2017 2018 2019 2020 16. 1% 17. 1% 16. 2% 15. 0% 15. 2% Dashboard as of 2/3/2020
 as a % of CWU Staff OPS Staff")
Operations Metrics OPS Staff (Fund 149) as a % of CWU Staff OPS Staff (All Funds) as a % of CWU Staff 2016 2017 2018 2019 2020 12. 8% 12. 7% 13. 2% 12. 8% 12. 5% 18. 0% 17. 9% 18. 1% 17. 2% 17. 5% Student FTE per OPS Staff (Fund 149) Student FTE per OPS Staff (All Funds) 2016 2017 2018 2019 2020 69. 10 70. 24 70. 21 70. 89 70. 38 49. 20 49. 70 51. 30 52. 50 50. 20

University Police & Public Safety Metrics Metric Measure Benchmark Officer / Student Ratio per 1, 000 0. 94 2. 0 (FBI), 1. 26 (EWU), 0. 93 (WWU) Parking Lot Utilization 76% AM / 62% PM N/A Student Satisfaction Survey 92. 6% 90%

Facilities Maintenance Metrics Metric CWU Measure Benchmark APPA Custodial Service Level 1 FTE/ 32, 963 ft 2 1 FTE/ 22, 880 ft 2 ISSA Custodial Service Level 1 FTE/ 32, 963 ft 2 1 FTE/ 25, 213 ft 2 Peer university comparison of ft 2 serviced ratio 7 th place 10 peer universities Western Washington University 1 FTE/32, 963 ft 2 1 FTE/24, 635 ft 2 Washington State University 1 FTE/32, 963 ft 2 1 FTE/31, 195 ft 2

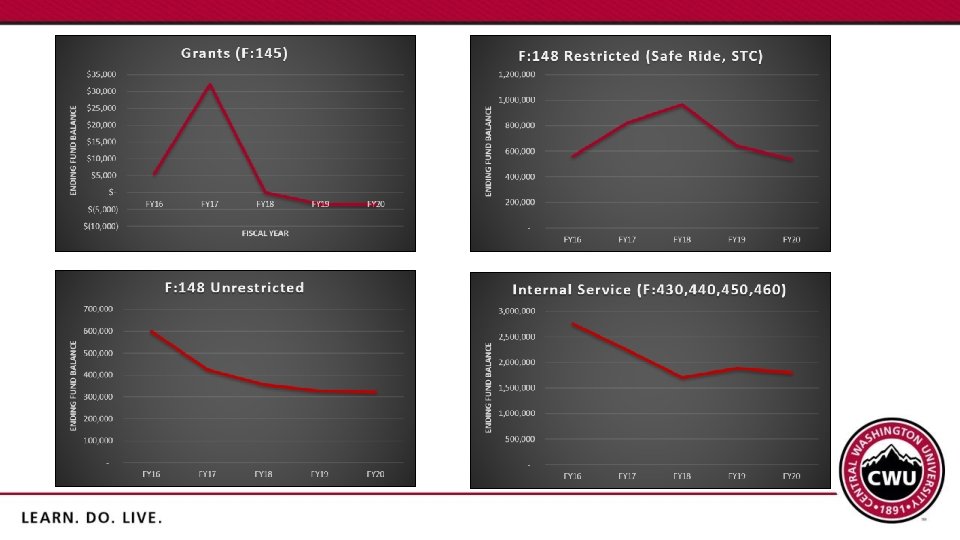
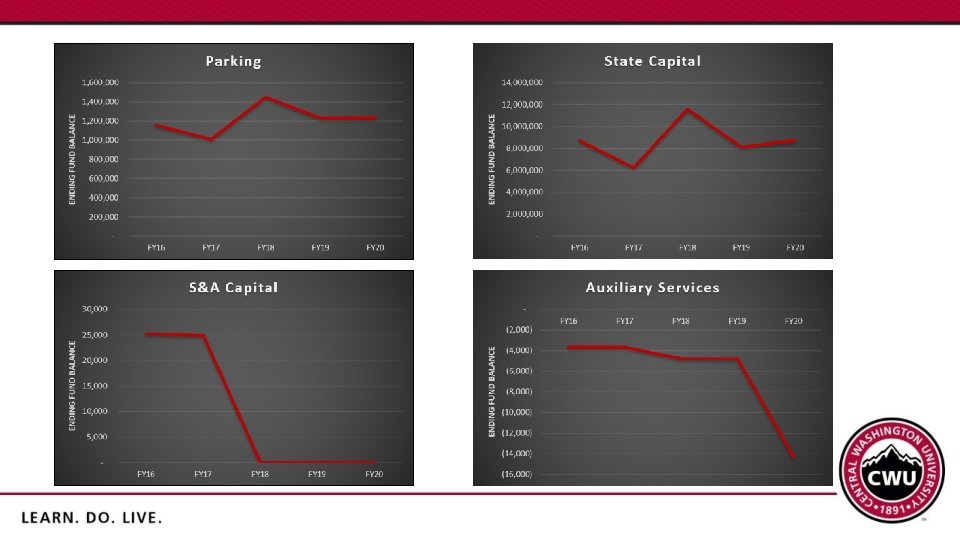
Operations All Funding Sources

Foundation Funds

Operations Internal Department Service Fees - FMD Labor Rate Central Stores $47. 88 - $57. 19 Standard charge-out rate (rarely used) Mail $33. 17 – 54. 52 Process bulk shipments/mail General Custodial/Grounds $28. 18 - $69. 79 Service charges (custodial/grounds/mapping) Non-Maintenance Projects Labor Rate Non-maintenance Labor $40. 43 – $51. 87 Campus moves Trades Labor $49. 16 - $88. 84 Project trades services (electrical, locks, mechanical, etc. ) Motor Pool Rate Rental Fee $10. 00 - $34. 00 / day Vehicle Service $50. 10 - $74. 21 / hour Vehicle repair/maintenance/recovery Golf carts, sedans, vans

Operations Internal Department Service Fees - UPPS Parking Permit Rate Daily $6. 00 Day permit Other $23. 00 - $46. 00 Quarterly/Weekly: Aquacise, wellness hour Quarterly $31. 00 - $118. 00 Quarterly basis: Faculty, staff, students, motorcycle Calendar $92. 00 - $247. 00 Calendar year: Faculty, staff, students, motorcycle Parking Citation Rate General $30. 00 – $45. 00 Improper permit display or use of parking area Other $300. 00 Unauthorized, counterfeit, and illegal permit/space Officer Patrol Coverage Rate $75. 00 per hour Special events extra patrol coverage

Operations Internal Department Service Fees - Other ISS Network & Ops Rate Telecom Line Charge $26. 00 each Phone line subscriber Telecom Service Call Labor $22. 50 - $45. 00 Per hour phone programming and changes Telecom Equipment $30. 00 - $485. 00 New phone line, equipment, or data connections/installation N&O Project Management $45. 00 per hour IT project manager attendance, participation, supervision in of contract work. Project Management Office Project Management Rate $100. 00 per hour Project management service in high-visibility / highprofile projects campus-wide.

Operations New Services & Increased Fees New Fees Rate Project Management Office $100 / hr Electric Carts $10 / day Increased Fees Parking Permit Fees Rate 5% annually for FY 2020 – 2023

Questions?
- Slides: 22