Operations Administration Committee February 22 2018 ANYONE WISHING

Operations & Administration Committee| February 22, 2018 Ø ANYONE WISHING TO SPEAK BEFORE THE VOTE ON ANY AGENDA ITEM MUST FILL OUT A PURPLE FORM ON THE SIGN-IN TABLE. COMMENTS WILL BE LIMITED TO THREE MINUTES. Ø Audience Questions and Comments PERSONS WISHING TO SPEAK MUST FILL OUT A WHITE FORM, LOCATED ON THE SIGN-IN TABLE, BEFORE THE MEETING. COMMENTS WILL BE LIMITED TO THREE MINUTES.

Operations & Administration Committee| February 22, 2018 Chairwomen Sharon Wegner

Operations & Administration Committee| February 22, 2018 Justin Augustine

Operations & Administration Committee| February 22, 2018 Justin Augustine

Operations & Administration Committee| February 22, 2018 Justin Augustine

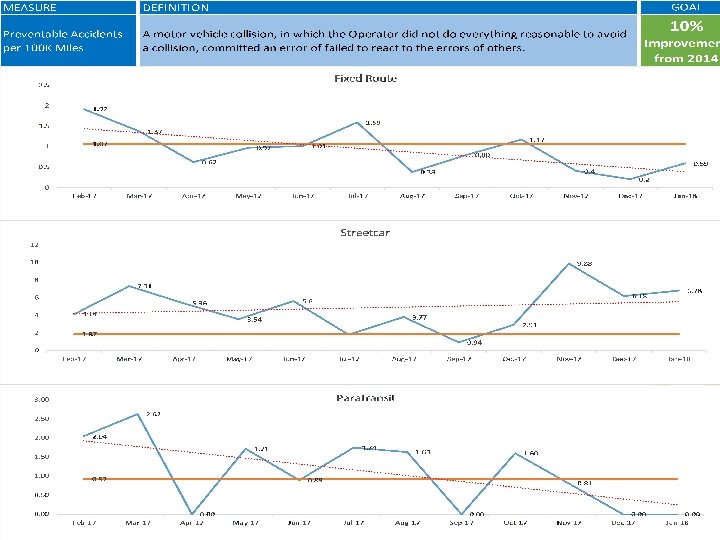
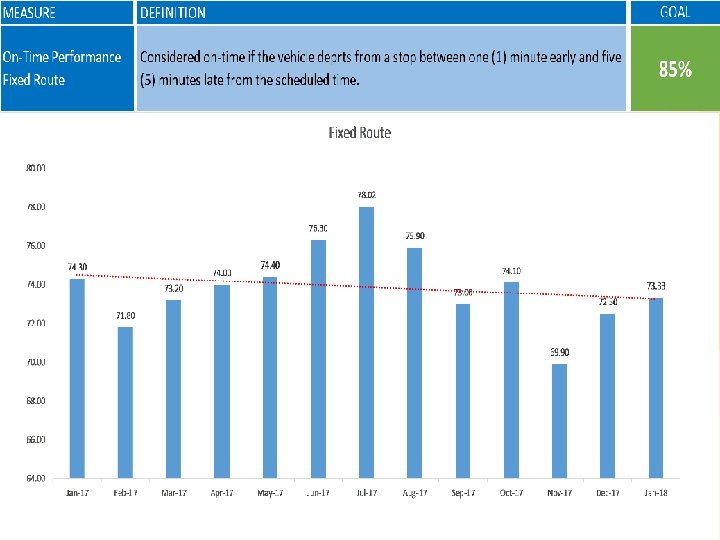
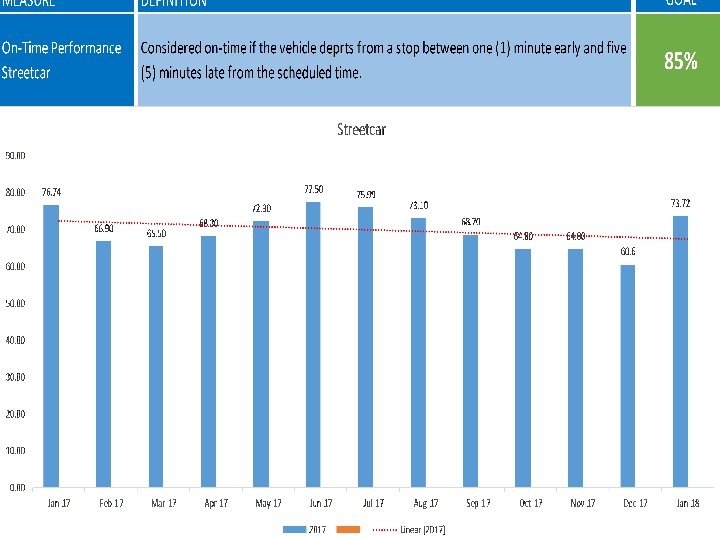
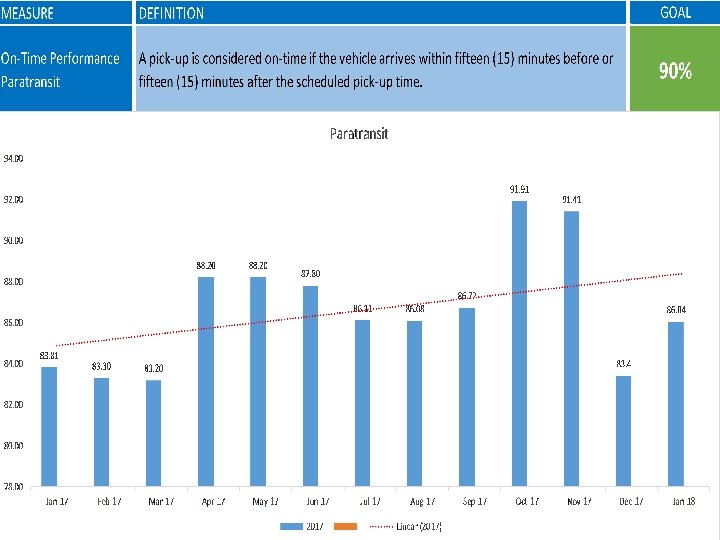
Operations KPI Report January 2018 February 22, 2018

PARATRANSIT & ADA Report 13

Paratransit Statistics JANUARY 2018 January 2018 Para-transit stats; Trips requested = 24, 215 Trips Completed = 16, 879 Total Passengers = 17, 501 Total hours = 10, 839 On-Time Performance 86. 04% Trips Cancelled = 7, 357 Trips Denied = 0 Active Clients = 1, 231 14

Paratransit Statistics January 2018 TOTAL REQUESTED TRIPS 24, 215 TOTAL PERFORMED TRIPS 16, 879 CANCELLATION % 30. 38% No Shows 894 Cancelled at the Door 334 TOTAL NO SHOWS 1, 228 Advance Cancellations 2, 064 Same Day Cancellations 3, 990 Late Cancellations 12 User Error Cancellations 82 Site Closure Subscription Cancellations 1, 209 TOTAL CANCELLATIONS 7, 357 Missed. T TOTAL MISSED 35 0 35 15

Paratransit Highlights / Training Activities January 2018 Ø ZERO Accidents for Month Ø The Cancellations increase is due to the Ice and Bad Weather Days along with Holiday closures ØThis month we received a high number of commendations for drivers reservationists and dispatchers which reflects our continued commitment to customer service excellence. 16

ADA Report 17

ADA Board Report January 2018 The ADA Office provided services to 599 individuals this month. Three hundred and three (303) ID pictures were taken: 73 Senior, 111 ADA/Paratransit, 92 Medicare replacement, and 27 fixed-route reduced fare cards. An additional 296 people came in for applications or information. The Eligibility section processed 126 ADA applications – approved 108 and denied 27. Fixed Route received and processed 20 applications, and 83 ADA requests for applications were mailed and six requests for fixed-route applications were fulfilled. There were two holidays this month (New Year’s and Martin Luther King Day), several center closings, and several days of extremely bad weather, snow, ice, low water pressure and no water; therefore, our office numbers were low. On fixed route 76, 169 individuals paid the 40 cent reduced fare and 3, 036 ADA clients rode free. In addition, 1, 392 persons in wheelchairs rode the system and another 5, 437 individuals placed their bikes on the bus. Ten complaints, 25 commendations and 10 requests for information were filed this month through the LISTEN complaint system. Two complaints regarding late service, two for Mel’s late service and individual complaints about operator conduct, attitude, and the attitudes of the reservationists were the major categories of the other complaints. 18

End of year report attached: 7, 630 clients visited the ID Center in 2017, largest category of pictures taken 1, 170 – ADA clients. Number of applications received 1, 675 – approved 1, 194 and denied 219. Number of clients riding free on fixed route 50, 011. 19

RTA ID Center Activity 2017 Total # of Month Clients ADA Elderly Fixed Route Medicare Total January 712 114 82 44 99 339 February 610 97 78 16 99 290 March 771 110 89 27 97 323 April 623 65 84 29 102 280 May 563 69 67 27 75 238 June 733 134 91 23 96 344 July 646 80 95 29 86 290 August 665 93 74 28 92 287 September 595 90 69 17 67 243 October 680 113 86 24 101 324 November 523 99 76 27 68 270 December 509 106 52 42 75 275 1, 170 943 333 1, 057 Total 7, 630 3, 503 20

RTA Eligibility Statistics 2017 Mo nth Applications Rec'd Approved Denied January 141 118 20 February 127 83 12 March 167 119 19 April 143 80 18 May 151 93 5 June 148 123 24 July 129 62 21 August 159 96 24 September 147 100 28 October 140 118 20 November 132 118 11 December 91 84 17 1, 675 1, 194 219 Total 21

2017 RTA Application Statistics Year Applications Total Clients 2009 1, 143 6, 311 2010 1, 546 7, 377 2011 1, 667 7, 457 2012 1, 878 6, 928 2013 1, 769 7, 495 2014 1, 898 7, 194 2015 2, 069 7, 167 2016 1, 932 7, 964 2017 1, 675 7, 630 % Approved % Processed 78. 57% 18. 11% 47. 22% 20. 96% 48. 35% 22. 35% 40. 73% 27. 11% 60. 99% 23. 60% 57. 17% 26. 38% 57. 18% 28. 87% 58. 18% 24. 26% 71. 28% 21. 95% 2017 RTA Application Approval Rates Approved 2009 2010 2011 2012 2013 2014 2015 2016 2017 898 730 806 765 1, 079 1, 085 1, 183 1, 124 1, 194 Denied 458 398 302 260 271 303 292 332 219 Approval Percentage 66. 22% 64. 72% 72. 74% 74. 63% 79. 93% 78. 17% 80. 20% 77. 20% 84. 50% 22

Applications Received 2 500 2 000 1 500 1 000 500 0 Applications 2009 2010 2011 2012 2013 Received 2014 2015 2016 2017 23

ADA Approvals/Denials 1 200 1 000 800 600 400 2009 2010 2011 2012 2013 2014 2015 2016 2017 Approved Denied 24

CAPITAL PROJECTS UPDATE OPERATIONS COMMITTEE – February 22, 2018

Capital Projects Update STUDY / PRELIMINARY ENGINEERING PROJECTS: • Algiers Park & Ride A. FEMA Reimbursement B. Facility Restoration – Phase 1 • Streetcar Expansion Program – Riverfront to St. Claude & Elysian Fields to Press St. 26
: • Carrollton / Claiborne Special Track")
Capital Projects Update ENGINEERING PROJECTS (FOR FUTURE CONSTRUCTION): • Carrollton / Claiborne Special Track Replacement (St. Charles Streetcar Line) • Riverfront Streetcar Line Special Track Replacement & Tamping • Repaint Riverfront Streetcar Line OCS Poles • Water Leak Mitigations (A. Philip Randolph and ENO Facilities) • Napoleon Facility Renovation • St. Charles Streetcar Line Downtown Loop Track Pavement Replacement • Repair St. Charles Streetcar Line OCS Poles FERRY PROJECTS: • Canal Street Ferry Terminal / Riverfront Rail Connector / New Bus Stop • Passenger Ferry Vessels 27

Canal/Algiers Point and Lower Algiers/Chalmette Ferry Routes Financial and Operations Report For the Period January 1, 2017 through January 31, 2018 February 22, 2018

Ferry Operations Statement of Expenses and Revenues JANUARY 2018 553, 358. 58 814, 146. 51 655, 130. 82 356, 172. 40 567, 806. 47 530, 699. 76 (140, 570. 65) (123, 260. 36) (122, 772. 83) (118, 518. 56) (138, 722. 91) (103, 660. 77) 412, 787. 93 690, 886. 15 532, 357. 99 237, 653. 84 429, 083. 56 427, 038. 89 JANUARY 718, 582. 95 (103, 183. 46) 615, 399. 49 (145, 787. 19) 1, 818, 333. 89 1, 104, 543. 74 2, 726, 201. 24 2, 430, 935. 69 1, 874, 077. 42 1, 429, 772. 92 (12, 544) (12, 357. 00) (26, 005. 51) (57, 611. 71) (15, 764. 61) 42, 187. 00 6, 770. 00 6, 005. 00 (52, 734) (52, 734. 00) 879, 914. 00 (1, 099, 893. 0 0) 57, 611. 71 ------------------- (8, 462. 00) (7, 506. 00) Less Transdev’s Net 2017 Billing (412, 787. 93) (690, 886. 15) (532, 357. 99) (237, 653. 84) (429, 083. 56) (427, 038. 89) (16, 613. 40) 671, 899. 36 (781, 185. 00) 615, 359. 49 Balance of LADOTD Subsidy (581, 666. 12) 1, 104, 543. 74 326, 201. 24 2, 430, 935. 69 1, 942. 548. 42 1, 429, 772. 92 688, 464. 39 Fiscal year 2017 – JULY thru JANUARY 2018 Total Expenses Less Fares and Credits Transdev Net Billing FY 2016 -17 LADOTD Ferry Subsidy Less Ferry diesel fuel provided by RTA Ferry Grant Revenues Less RTA Grant Expenses JULY AUGUST SEPTEMBER OCTOBER NOVEMBER DECEMBER 29

Ferry Operations RIDERSHIP January 2017 through January 31, 2018 Algiers Point/Canal Street Date Pedestrians Feb-17 Mar-17 Apr-17 May-17 Jun-17 Jul-17 Aug-17 Sep-17 Oct-17 Nov-17 Dec-17 Scooters 88, 662 (3) 56, 330 77, 838 47, 418 32, 274 52, 249 31, 256 43, 636 39, 531 41, 156 37, 127 (5)(6) 65 104 81 35 42 62 23 58 72 49 141 Lower Algiers/Chalmette Total 88, 727 56, 330 77, 919 47, 453 32, 316 52, 311 31, 279 43, 694 39, 603 41, 205 37, 268 Pedestrians 311 329 316 207 286 270 309 331 250 289 198 Vehicles 26, 479 28, 515 26, 910 16, 447 23, 070 22, 342 24, 999 26, 442 22, 316 27, 456 21, 479 Total 26, 790 28, 844 27, 226 16, 654 23, 356 22, 612 25, 308 26, 773 22, 566 27, 745 21, 677 (1) Algiers Barn Fire & Concert (December 3, 2016) (2) New Year's Eve Fireworks on the River (December 31, 2016) (3) Mardi Gras-Saturday, February 25, 2017 through Tuesday, February 28, 2107 58, 862 (4) French Quarter Festival, April 7 -9, 2017 35, 960 (5) Algiers Barn Fire &n. Concert (December 2, 2017) (6) New Year's Eve Fireworks on the River (December 31, 2017) 30

Marketing and Customer Experience Report 31

Marketing and Customer Experience Updates • Rideline and Paratransit handled 6, 939 more calls in January than December 2017 • • Rideline alone handled 5, 046 more calls in January than in December 2017 Rideline average time on hold reduced to : 36 in January from : 42 in December • • Social media notifications for delays and detours • Mardi Gras related activities • Weather issues • Construction and roadwork Paratransit compliments and complaints were moved to Rideline on January 30, 2018 32

33

34

35

Social Media Engagement 36

Social Media Engagement 37

Social Media Engagement 38

Public Information Office Report 39
 • Publicity")
Media Relations • 125 Total Media Mentions (Jan. 1 – Jan. 31) • Publicity Value = $468, 400 • Total Online News Visitors = 28, 262, 629 40

Media Relations Earned, Positive Media Mentions – Highlights: • St. Charles Streetcar Resumes Full Downtown Route (after scaffolding collapse) • Nola. com • RTA’s List of Carnival & Parade Routes Detours • Gambit Weekly & FOX 8 • Multiple Wintery Weather Updates • WWL, FOX 8, WGNO, WDSU • The Advocate & Nola. com • WYLD-FM 41

Media Relations Earned, Positive Media Mentions – Highlights: • New Orleans RTA Bets on Saints in Playoff Game • Nola. com • The Advocate • Tips for Mardi Gras • FOX 8 • RTA Officially Opens New Cemeteries Transit Center • Nola. com • WGNO & WDSU • Gambit Weekly 42
 Jan. 9 th Broad St.")
Community Engagement / Interagency Relations Youth Empowerment Project (YEP) Jan. 9 th Broad St. location & Jan. 11 th Algiers location • RTA participated in YEP’s Open House for mentor & adult education courses. • Attendees provided feedback on the RTA, signed up for the Riders Digest, and received current schedules, system maps, and promotional items. 43

Community Engagement / Interagency Relations Tulane School of Social Work – Elk Place Health Spot Jan. 25 • RTA was invited to participate in monthly event with National Child & Family Services, Odyssey House, National Alliance of Mental Illness and more. • Community Outreach received comments from riders on Lines 62, 57 and Cemeteries Streetcar – high school students, janitorial workers, and homeless riders. • Riders received either an emergency rain poncho or hand sanitizer as a token of appreciation for sharing their feedback. 44

Community Engagement / Interagency Relations New Orleans Concierge Association Meeting Jan. 30 • RTA met with a group of concierges from 25 major hotels in the French Quarter and CBD to answer questions about the upcoming release of the new Go. Mobile app. • Information was distributed on streetcar charters, as well as current system maps and Mardi Gras schedules. 45

Cleaner, Smarter Transit. THE END @New. Orleans. RTA
- Slides: 46