Operational Hurricane Model Diagnostics at EMC Hurricane Diagnostics


 Eyewall (30 km) 60 90 120 150 180 210 700 mb wind")


 More consistent forecast guidance well ahead of landfall")
 Difficulty in projecting the storm track towards Galveston TX")


 HWRF GFDL tracked Ike through Cuba – HWRF stayed north of")


")
 Need to compare with observations")
 HWRF Tracks stayed south of the gulf coast GFDL")

")


: Relative role of vortex vs. environment in influencing intensity. Role")

- Slides: 36
Operational Hurricane Model Diagnostics at EMC Hurricane Diagnostics and Verification Workshop NHC, Miami, FL 4 May 2009 – 6 May 2009 Vijay Tallapragada, N. Surgi, R. Tuleya, Q. Liu, Y. Kwon, Z. Zhang, J. O’Connor Environmental Modeling Center National Centers for Environmental Prediction 5200 Auth Road, Camp Springs, MD 20746.
Outline Overview of Model Diagnostics for Hurricane Forecasts • Diagnostic Tools • Specific Issues • • Evolution of large-scale flow (steering currents and shear patterns) Impact of boundary conditions, vortex initialization Surface physics issues Wind-Pressure relationship Storm size and structure Vortex evolution and interactions with the storm environment
Draft Plan for HFIP Hurricane Model Diagnostics at EMC Diagnostics to address track and intensity forecasts from operational hurricane models Evaluation of mean layer flow and steering currents for track forecasts Evaluation of shear patterns for intensity (and intensity change) forecasts Impact of ocean coupling through analysis of surface fluxes, SST, MLD, heat content etc. Diagnostics specific to Eastern Pacific storms Wind-pressure relationship
Hurricane Diagnostics • • • Ongoing and continuous efforts to develop a system for comprehensive model diagnostics for hurricane forecasts Primary tasks include: – Evaluation of initial storm structure (analyzed), – Vortex evolution in the forecasts, – Representation of large-scale flow in HWRF and GFDL compared to the GFS – Impact of boundary conditions, domain configurations – Impact of physics, ocean feedback, horizontal and vertical resolution – Evaluation of derived diagnostic products including energy, angular momentum and PV budgets Collaborative effort with Mark De. Maria HPLOT capabilities • Model side-by-side comparison • Standard diagnostics • vert. shear • x-sections, etc. • Based on generic software
Diagnostic Tools: HPLOT Developed GUI based plotting program HPLOT (based on initial version developed by Tim Marchok and adapted for HWRF by Marshall Stoner) that allows visualization of several diagnostic components of the forecasts. Allows comparison of HWRF forecasts with other model forecasts as well as analysis/observations side by side (including difference plots on a uniform grid) Diagnostic measures include mean layer wind, vertical and zonal shear components, skew-T diagrams etc. Additional capabilities to compute statistical measures (RMS errors, anomaly correlation etc. ) as well as filtering of storm component for evaluation of large-scale flow Vortex scale diagnostics include fixed/arbitrary horizontal/ vertical cross-sections of wind, temperature, heating rates, RH etc. , azimuthally averaged winds, data on cylindrical coordinates.
Operational HWRF Pre-implementation testing of HWRF model for the 2004 -2005 -2006 hurricane seasons – Atlantic & Eastern Pacific First year of HWRF implementation during 2007 season More short-lived storms, not a very active Atlantic season HWRF performed better than GFDL but not as good as the global model. Weak intensity bias, large north/west track forecast bias Large Eastern Pacific track errors Huge sensitivity to changes in vortex initialization HWRF performance during 2008 season Track forecasts in the Atlantic were comparable to GFDL, however, large track errors in the Eastern Pacific Weak bias and large intensity errors in both Atlantic and Eastern Pacific Pre-implementation testing showed reduced intensity bias (through improved initialization) Atlantic track errors comparable to GFDL and GFS Several issues - Bertha, Fay, Ike, Paloma…. Larger East. Pac track and intensity errors – Norbert, Genevieve…. HWRF 2009 – Inclusion of GWD, Changes to initialization, bug fixes (radiation, land surface temp. )
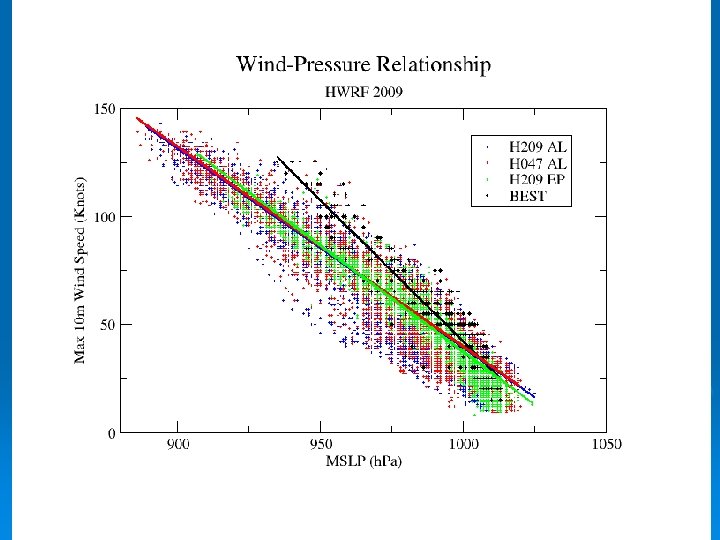
HWRF has a weak intensity bias despite huge reduction of negative bias compared to initial version of HWRF
increased westward bias beyond 72 hrs Persistent Northward bias
Initialization Initial Conditions Boundary Conditions Bogus using Composite Storm
R (km) Eyewall (30 km) 60 90 120 150 180 210 700 mb wind 44. 13 39. 97 30. 37 24. 32 19. 90 16. 02 13. 90 850 mb wind 46. 69 40. 90 30. 51 24. 12 19. 88 16. 45 14. 11 10 m wind 35. 04 28. 38 20. 61 16. 29 13. 59 11. 50 9. 98 R 700 0. 79 0. 71 0. 68 0. 67 0. 68 0. 72 About 10% less than the observed relationship
Some specific case studies Hurricane Bertha – northward turn in the early stages of HWRF forecasts Hurricane Gustav vs. Hurricane Ike Tropical Storm Fay East-Pac: Hurricane Kiko
Northward bias for Hurricane Bertha
Hurricane Bertha’s northward turn - Breaking of sub-tropical high RMS V 850: 9. 5 m/s RMS V 850: 7. 3 m/s ACC H 500 : 0. 72 ACC H 500 : 0. 85 HWRF GFS
Hurricane Bertha’s northward turn - Breaking of sub-tropical high RMSE V 850: 11. 6 m/s ACC: 0. 62 ACC H 500 : 0. 62 HWRF RMSE V 8500. 81 : 8. 4 m/s ACC: ACC H 500 : 0. 81 GFS
Gustav (07 L) More consistent forecast guidance well ahead of landfall
Ike (09 L) Difficulty in projecting the storm track towards Galveston TX
Ike – northward turn into Fl during early stages of forecast Sept. 05, 00 Z 24 hrs later…. Sept. 06, 00 Z
48 hrs later…. Sep. 08 00 Z 48 hrs later…. Sep. 10 00 Z
Sep. 12 00 Z, 36 hrs before landfall
HWRF Intensity Forecasts Hurricane Gustav HWRF Intensity Forecasts Hurricane Ike
Gustav (07 L) HWRF GFDL tracked Ike through Cuba – HWRF stayed north of the islands and headed towards keys as a major hurricane
Hurricane Ike 05 Sept. 12 Z GFDL Hurricane Ike 05 Sept. 12 Z HWRF 10 m Wind Swath for Hurricane Ike
Nest Grid Parent Grid HWRF Shear Patterns associated with Gustav
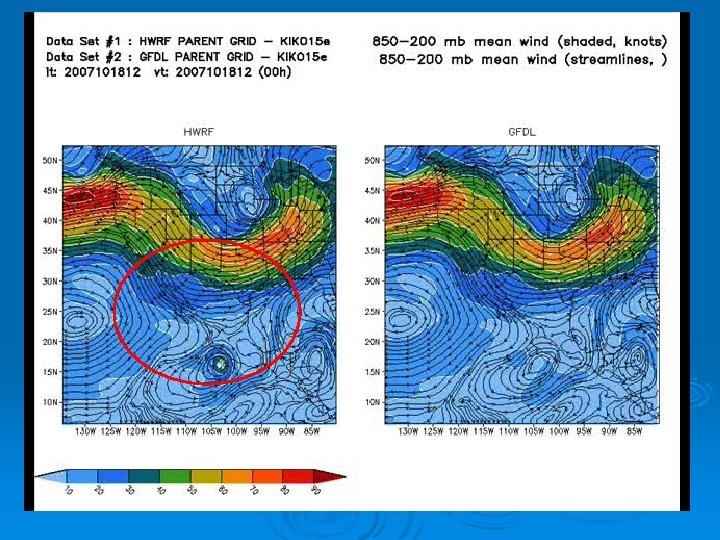
GFS Shear Patterns associated with Ike Nest Grid Parent Grid HWRF Shear Patterns associated with Ike
Vertical cross-section of Hurricane Gustav (shallow)
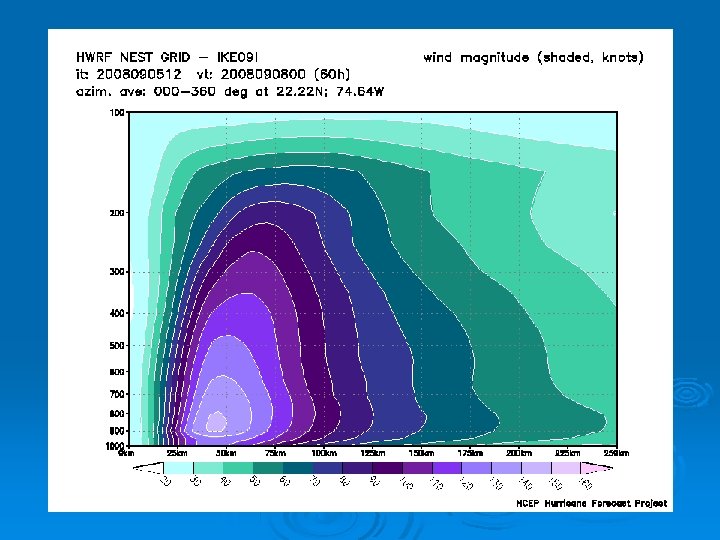
Vertical cross-section of Hurricane Ike (Deep) Need to compare with observations
Fay (06 L) HWRF Tracks stayed south of the gulf coast GFDL
HWRF taking Fay to Gulf Possibly due to cooler land surface temperatures in HWRF nest domain 2009 HWRF
Cold Land Surface Temperatures in HWRF moving grid Cooler (by about 6 -10 deg) land surface temperatures due to irregular computation of radiation in the inner domain (due to nest motion) Problem solved by calling radiation for the nest at regular intervals Radiation consistent with parent domain (54 min. ) Radiation called at nest motion threshold interval (9 min)
Hurricane Kiko 12 z; Oct 18, 2007
Other problem issues Topographical differences between models Surface flux formulations & land surface modeling Wind-pressure relationship Eastern Pacific Basin: west/ northwestward bias in tracks Eastern Pacific Basin: Initial storm size and structure issues
Fundamental questions (process/sensitivity studies): Relative role of vortex vs. environment in influencing intensity. Role of ocean. Role of Oceanic heat content. Processes within atmosphere-ocean boundary layer on intensity/structure changes. Determinants of structure and relationship with preexisting wave disturbance. Relationship between structure and intensity. Role of inner core processes for intensification/ weakening, e. g. eyewall replacement cycles, mixing. Relative role of physics, e. g. Air-sea, microphysics, convection etc. on intensity change in various environments (sheared vs. nonshear)
Thanks for your attention. Questions/Comments?