Operating Juniper Networks Routers in the Enterprise Chapter
![Monitoring Devices Using SNMP § Configure SNMP monitoring at [edit snmp] hierarchy level • Monitoring Devices Using SNMP § Configure SNMP monitoring at [edit snmp] hierarchy level •](https://slidetodoc.com/presentation_image_h/9a45cfe4fb0e9d2ad9ca46edb77f6ebd/image-25.jpg)

- Slides: 61

Operating Juniper Networks Routers in the Enterprise Chapter 9: Troubleshooting 4 -1 Copyright © 2005 Juniper Networks, Inc. Proprietary and Confidential www. juniper. net

Chapter Objectives § After successfully completing this chapter, you will be able to: • Describe the layered troubleshooting methodology • Identify and use resources and troubleshooting tools • List some best practices that promote troubleshooting • Troubleshoot problems related to hardware, software, interfaces, and protocols on a Juniper Networks enterprise routing platform 9 -2 Copyright © 2007 Juniper Networks, Inc. Education Services 9 -2

Agenda: Troubleshooting àTroubleshooting Methodology § Resources and Troubleshooting Tool Kit § Best Practices § Troubleshooting Hardware § Troubleshooting Software § Troubleshooting Interfaces § Troubleshooting Protocols (OSPF) 9 -3 Copyright © 2007 Juniper Networks, Inc. Education Services 9 -3

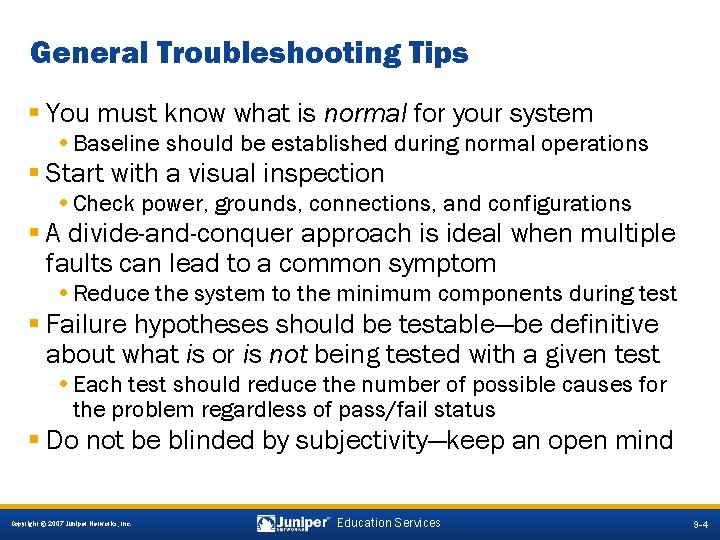
General Troubleshooting Tips § You must know what is normal for your system • Baseline should be established during normal operations § Start with a visual inspection • Check power, grounds, connections, and configurations § A divide-and-conquer approach is ideal when multiple faults can lead to a common symptom • Reduce the system to the minimum components during test § Failure hypotheses should be testable—be definitive about what is or is not being tested with a given test • Each test should reduce the number of possible causes for the problem regardless of pass/fail status § Do not be blinded by subjectivity—keep an open mind 9 -4 Copyright © 2007 Juniper Networks, Inc. Education Services 9 -4

A Layered Troubleshooting Approach § Modern communications networks are modeled around layered architectures • Each layer depends on the services of the underlying layer(s) § Matching a symptom to the root-cause layer is a critical step in rapid diagnosis and restoration • Numerous failure scenarios can result in a common symptom like no route to the remote host • Allows escalation and hand-off to the appropriate group § Identifying the specific fault within the root-cause layer is icing on the cake! • Problem resolution is above and beyond fault confirmation and root-cause layer determination 9 -6 Copyright © 2007 Juniper Networks, Inc. Education Services 9 -6

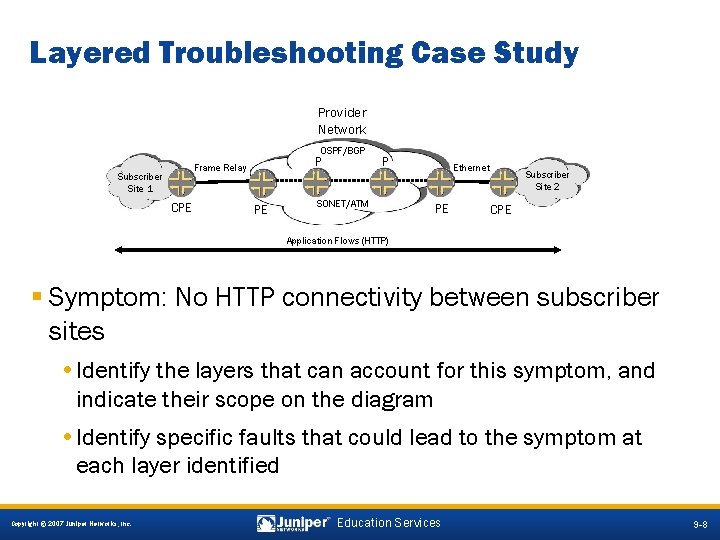
Layered Troubleshooting Case Study Provider Network OSPF/BGP Subscriber Site 1 P Frame Relay CPE PE P SONET/ATM Ethernet PE Subscriber Site 2 CPE Application Flows (HTTP) § Symptom: No HTTP connectivity between subscriber sites • Identify the layers that can account for this symptom, and indicate their scope on the diagram • Identify specific faults that could lead to the symptom at each layer identified 9 -8 Copyright © 2007 Juniper Networks, Inc. Education Services 9 -8

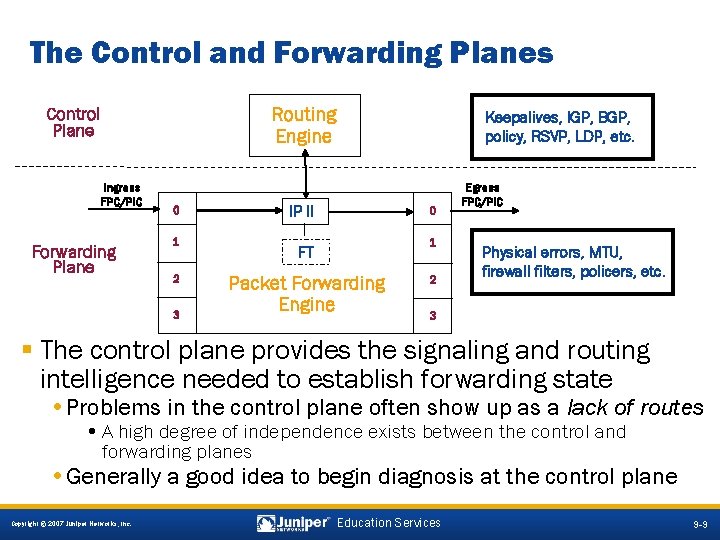
The Control and Forwarding Planes Routing Engine Control Plane Ingress FPC/PIC Forwarding Plane 0 1 2 3 Keepalives, IGP, BGP, policy, RSVP, LDP, etc. IP II 0 1 FT Packet Forwarding Engine 2 Egress FPC/PIC Physical errors, MTU, firewall filters, policers, etc. 3 § The control plane provides the signaling and routing intelligence needed to establish forwarding state • Problems in the control plane often show up as a lack of routes • A high degree of independence exists between the control and forwarding planes • Generally a good idea to begin diagnosis at the control plane 9 -9 Copyright © 2007 Juniper Networks, Inc. Education Services 9 -9

Agenda: Troubleshooting § Troubleshooting Methodology àResources and Troubleshooting Tool Kit § Best Practices § Troubleshooting Hardware § Troubleshooting Software § Troubleshooting Interfaces § Troubleshooting Protocols (OSPF) 9 -10 Copyright © 2007 Juniper Networks, Inc. Education Services 9 -10

Troubleshooting Resources § The troubleshooting resources include: • Online documentation • Technical publications: – http: //www. juniper. net/techpubs/ • Network Operations Guide: – http: //www. juniper. net/techpubs/software/nog/ • JTAC • Support Engineers • Knowledge Base • Bug search • Technical forums (J-Net Communities) 9 -11 Copyright © 2007 Juniper Networks, Inc. Education Services 9 -11

Troubleshooting Tool Kit § The troubleshooting tool kit includes: • Visual indicators • The JUNOS software CLI • Key commands • Process restart and hardware online/offline • Network and diagnostic utilities • System logs and protocol tracing • Core files • Interactive UNIX shell and hidden commands 9 -12 Copyright © 2007 Juniper Networks, Inc. Education Services 9 -12

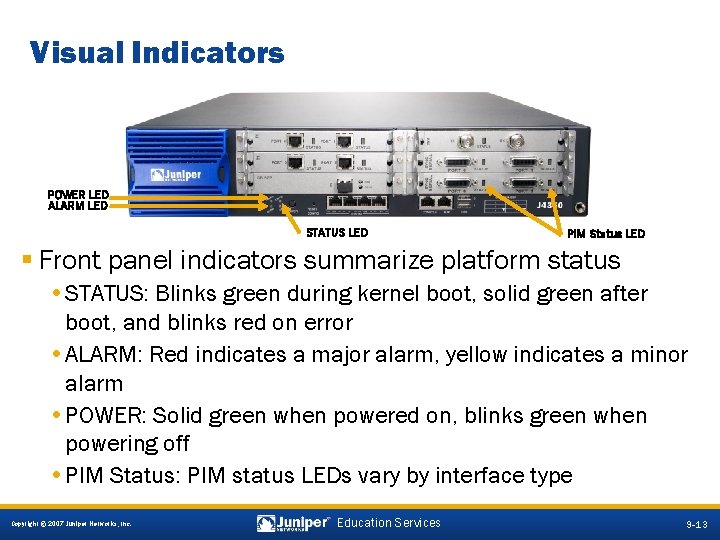
Visual Indicators POWER LED ALARM LED STATUS LED PIM Status LED § Front panel indicators summarize platform status • STATUS: Blinks green during kernel boot, solid green after boot, and blinks red on error • ALARM: Red indicates a major alarm, yellow indicates a minor alarm • POWER: Solid green when powered on, blinks green when powering off • PIM Status: PIM status LEDs vary by interface type 9 -13 Copyright © 2007 Juniper Networks, Inc. Education Services 9 -13

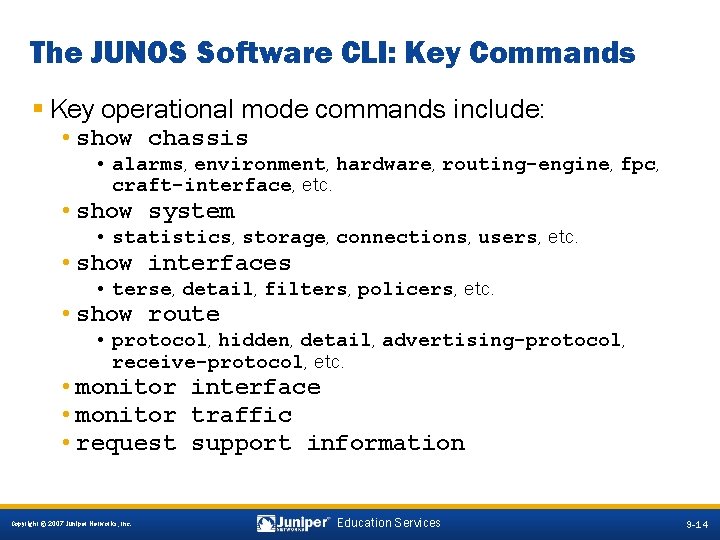
The JUNOS Software CLI: Key Commands § Key operational mode commands include: • show chassis • alarms, environment, hardware, routing-engine, fpc, craft-interface, etc. • show system • statistics, storage, connections, users, etc. • show interfaces • terse, detail, filters, policers, etc. • show route • protocol, hidden, detail, advertising-protocol, receive-protocol, etc. • monitor interface • monitor traffic • request support information 9 -14 Copyright © 2007 Juniper Networks, Inc. Education Services 9 -14

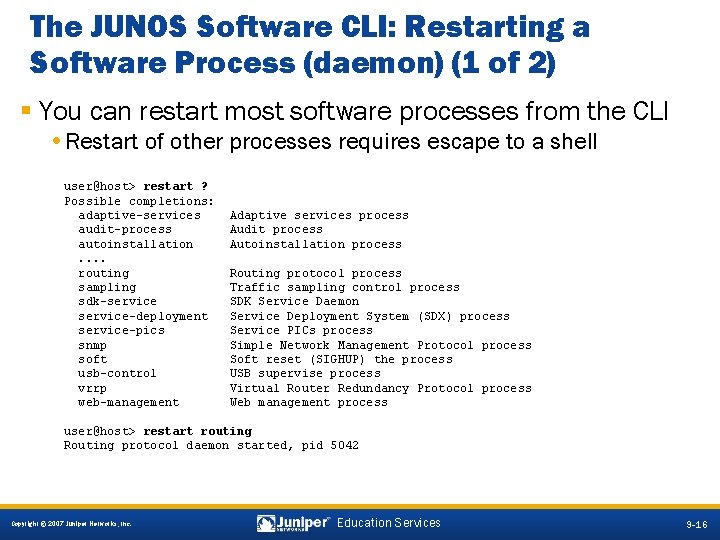
The JUNOS Software CLI: Restarting a Software Process (daemon) (1 of 2) § You can restart most software processes from the CLI • Restart of other processes requires escape to a shell user@host> restart ? Possible completions: adaptive-services audit-process autoinstallation. . routing sampling sdk-service-deployment service-pics snmp soft usb-control vrrp web-management Adaptive services process Audit process Autoinstallation process Routing protocol process Traffic sampling control process SDK Service Daemon Service Deployment System (SDX) process Service PICs process Simple Network Management Protocol process Soft reset (SIGHUP) the process USB supervise process Virtual Router Redundancy Protocol process Web management process user@host> restart routing Routing protocol daemon started, pid 5042 9 -16 Copyright © 2007 Juniper Networks, Inc. Education Services 9 -16

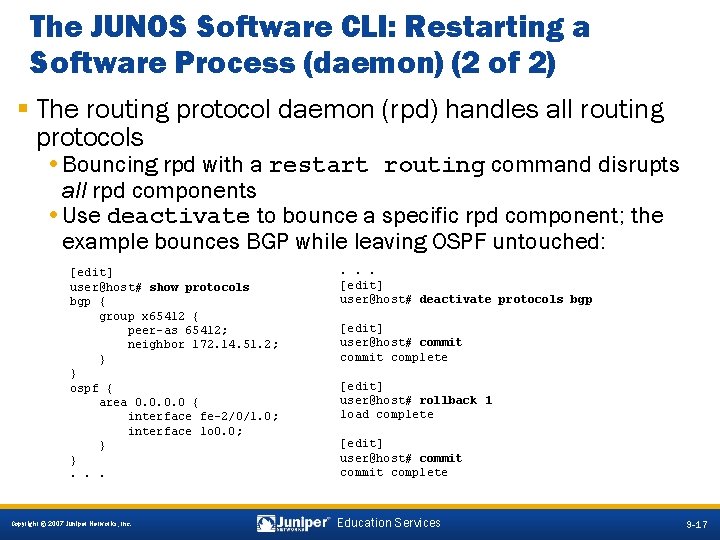
The JUNOS Software CLI: Restarting a Software Process (daemon) (2 of 2) § The routing protocol daemon (rpd) handles all routing protocols • Bouncing rpd with a restart routing command disrupts all rpd components • Use deactivate to bounce a specific rpd component; the example bounces BGP while leaving OSPF untouched: [edit] user@host# show protocols bgp { group x 65412 { peer-as 65412; neighbor 172. 14. 51. 2; } } ospf { area 0. 0 { interface fe-2/0/1. 0; interface lo 0. 0; } }. . . [edit] user@host# deactivate protocols bgp [edit] user@host# commit complete [edit] user@host# rollback 1 load complete [edit] user@host# commit complete 9 -17 Copyright © 2007 Juniper Networks, Inc. Education Services 9 -17

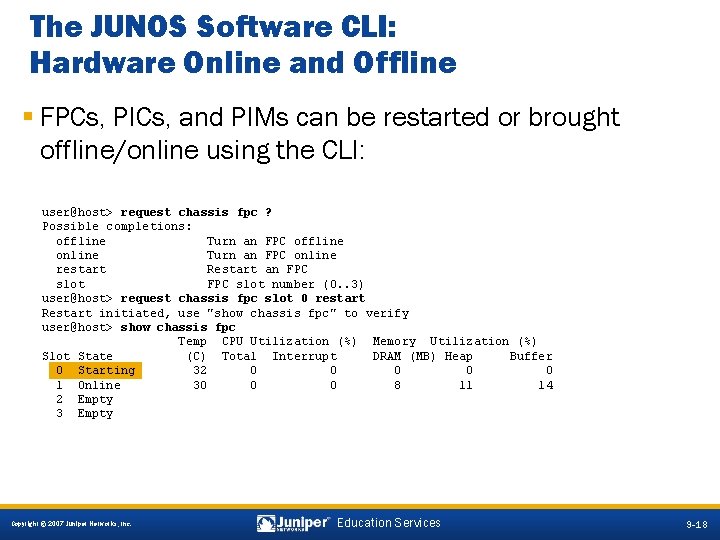
The JUNOS Software CLI: Hardware Online and Offline § FPCs, PICs, and PIMs can be restarted or brought offline/online using the CLI: user@host> request chassis fpc ? Possible completions: offline Turn an FPC offline online Turn an FPC online restart Restart an FPC slot number (0. . 3) user@host> request chassis fpc slot 0 restart Restart initiated, use "show chassis fpc" to verify user@host> show chassis fpc Temp CPU Utilization (%) Memory Utilization (%) Slot State (C) Total Interrupt DRAM (MB) Heap Buffer 0 Starting 32 0 0 0 1 Online 30 0 0 8 11 14 2 Empty 3 Empty 9 -18 Copyright © 2007 Juniper Networks, Inc. Education Services 9 -18

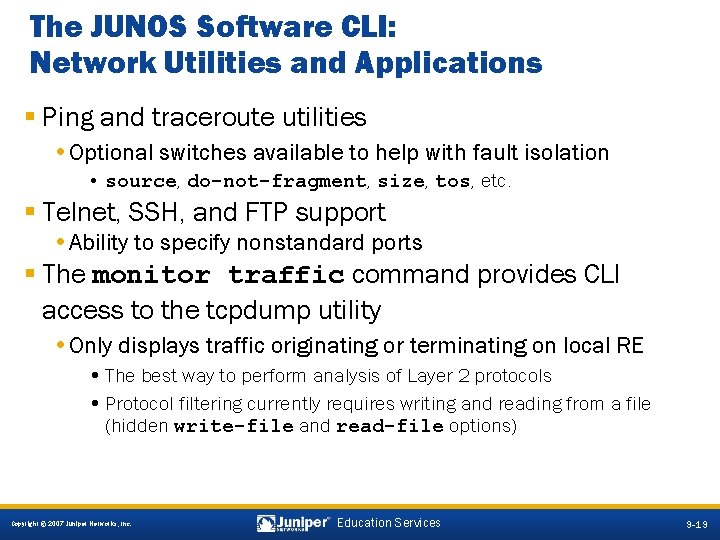
The JUNOS Software CLI: Network Utilities and Applications § Ping and traceroute utilities • Optional switches available to help with fault isolation • source, do-not-fragment, size, tos, etc. § Telnet, SSH, and FTP support • Ability to specify nonstandard ports § The monitor traffic command provides CLI access to the tcpdump utility • Only displays traffic originating or terminating on local RE • The best way to perform analysis of Layer 2 protocols • Protocol filtering currently requires writing and reading from a file (hidden write-file and read-file options) 9 -19 Copyright © 2007 Juniper Networks, Inc. Education Services 9 -19

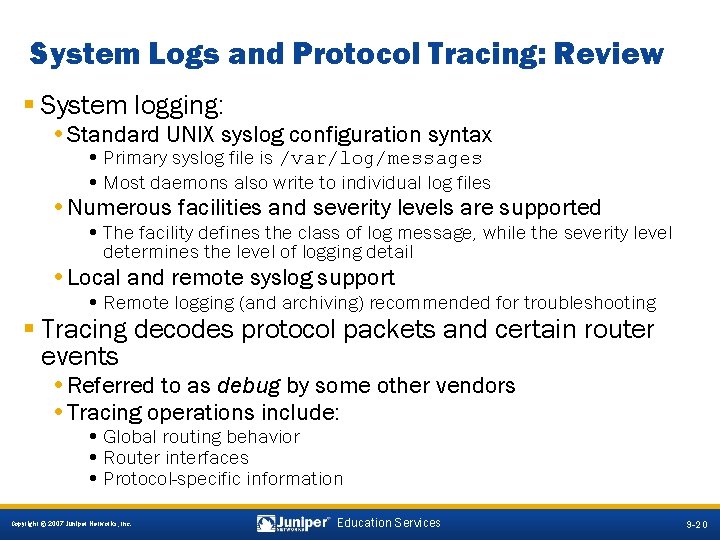
System Logs and Protocol Tracing: Review § System logging: • Standard UNIX syslog configuration syntax • Primary syslog file is /var/log/messages • Most daemons also write to individual log files • Numerous facilities and severity levels are supported • The facility defines the class of log message, while the severity level determines the level of logging detail • Local and remote syslog support • Remote logging (and archiving) recommended for troubleshooting § Tracing decodes protocol packets and certain router events • Referred to as debug by some other vendors • Tracing operations include: • Global routing behavior • Router interfaces • Protocol-specific information 9 -20 Copyright © 2007 Juniper Networks, Inc. Education Services 9 -20

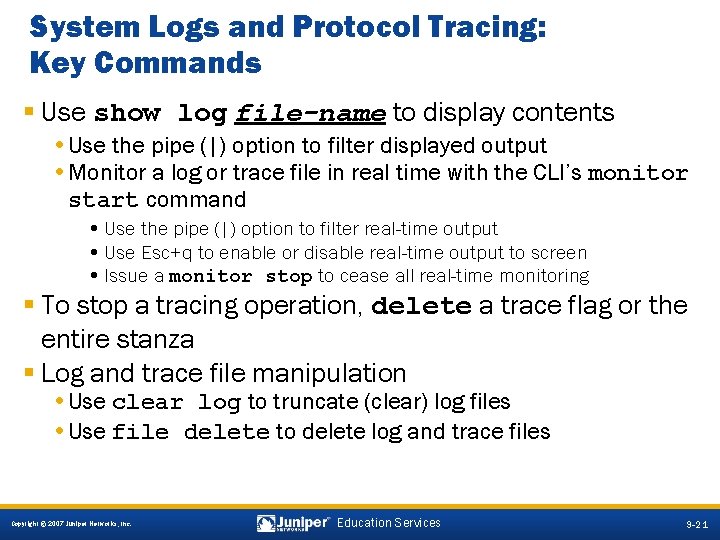
System Logs and Protocol Tracing: Key Commands § Use show log file-name to display contents • Use the pipe (|) option to filter displayed output • Monitor a log or trace file in real time with the CLI’s monitor start command • Use the pipe (|) option to filter real-time output • Use Esc+q to enable or disable real-time output to screen • Issue a monitor stop to cease all real-time monitoring § To stop a tracing operation, delete a trace flag or the entire stanza § Log and trace file manipulation • Use clear log to truncate (clear) log files • Use file delete to delete log and trace files 9 -21 Copyright © 2007 Juniper Networks, Inc. Education Services 9 -21

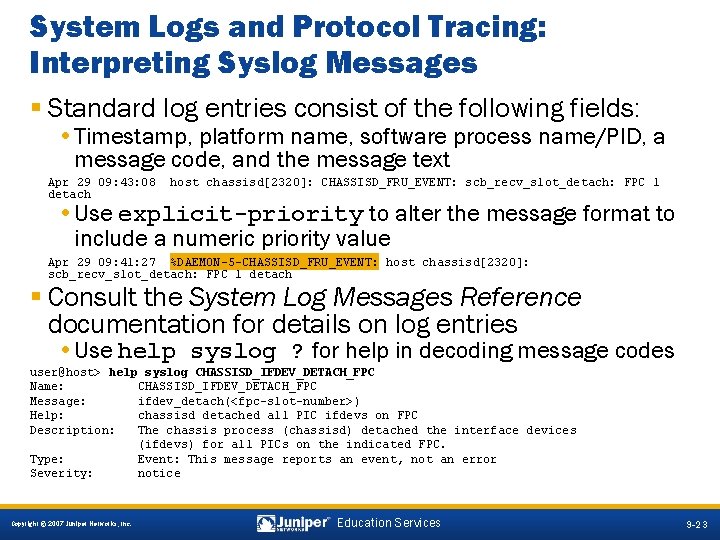
System Logs and Protocol Tracing: Interpreting Syslog Messages § Standard log entries consist of the following fields: • Timestamp, platform name, software process name/PID, a message code, and the message text Apr 29 09: 43: 08 detach host chassisd[2320]: CHASSISD_FRU_EVENT: scb_recv_slot_detach: FPC 1 • Use explicit-priority to alter the message format to include a numeric priority value Apr 29 09: 41: 27 %DAEMON-5 -CHASSISD_FRU_EVENT: host chassisd[2320]: scb_recv_slot_detach: FPC 1 detach § Consult the System Log Messages Reference documentation for details on log entries • Use help syslog ? for help in decoding message codes user@host> help syslog CHASSISD_IFDEV_DETACH_FPC Name: CHASSISD_IFDEV_DETACH_FPC Message: ifdev_detach(<fpc-slot-number>) Help: chassisd detached all PIC ifdevs on FPC Description: The chassis process (chassisd) detached the interface devices (ifdevs) for all PICs on the indicated FPC. Type: Event: This message reports an event, not an error Severity: notice 9 -23 Copyright © 2007 Juniper Networks, Inc. Education Services 9 -23

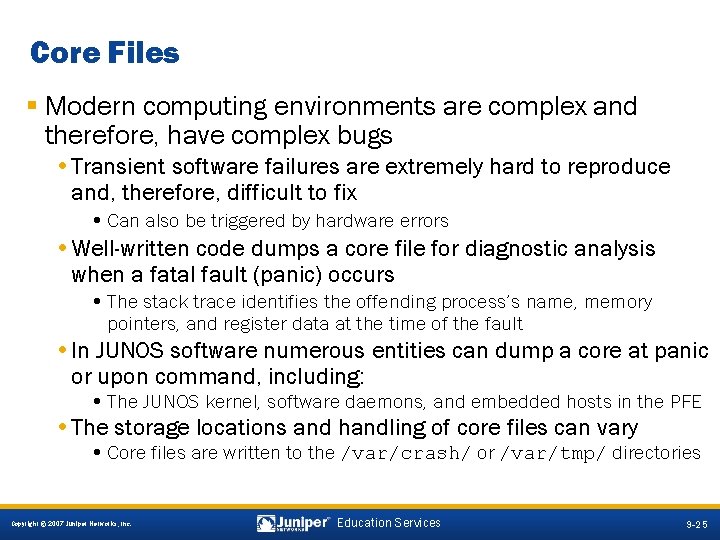
Core Files § Modern computing environments are complex and therefore, have complex bugs • Transient software failures are extremely hard to reproduce and, therefore, difficult to fix • Can also be triggered by hardware errors • Well-written code dumps a core file for diagnostic analysis when a fatal fault (panic) occurs • The stack trace identifies the offending process’s name, memory pointers, and register data at the time of the fault • In JUNOS software numerous entities can dump a core at panic or upon command, including: • The JUNOS kernel, software daemons, and embedded hosts in the PFE • The storage locations and handling of core files can vary • Core files are written to the /var/crash/ or /var/tmp/ directories 9 -25 Copyright © 2007 Juniper Networks, Inc. Education Services 9 -25

The Interactive Shell and Hidden Commands § Interactive UNIX shell and hidden command support • Unless directed by JTAC, working in the shell and using hidden commands is unsupported and potentially dangerous • CLI users can escape to an interactive shell only when permitted by their login class 9 -26 Copyright © 2007 Juniper Networks, Inc. Education Services 9 -26

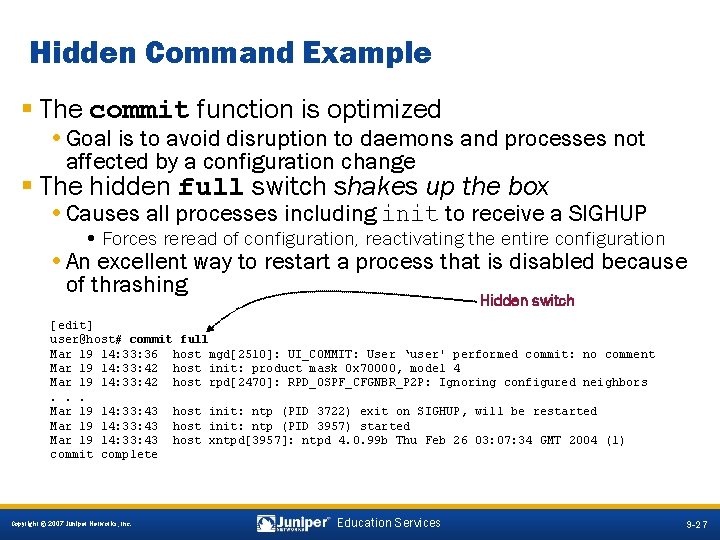
Hidden Command Example § The commit function is optimized • Goal is to avoid disruption to daemons and processes not affected by a configuration change § The hidden full switch shakes up the box • Causes all processes including init to receive a SIGHUP • Forces reread of configuration, reactivating the entire configuration • An excellent way to restart a process that is disabled because of thrashing Hidden switch [edit] user@host# commit full Mar 19 14: 33: 36 host mgd[2510]: UI_COMMIT: User ‘user' performed commit: no comment Mar 19 14: 33: 42 host init: product mask 0 x 70000, model 4 Mar 19 14: 33: 42 host rpd[2470]: RPD_OSPF_CFGNBR_P 2 P: Ignoring configured neighbors. . . Mar 19 14: 33: 43 host init: ntp (PID 3722) exit on SIGHUP, will be restarted Mar 19 14: 33: 43 host init: ntp (PID 3957) started Mar 19 14: 33: 43 host xntpd[3957]: ntpd 4. 0. 99 b Thu Feb 26 03: 07: 34 GMT 2004 (1) commit complete 9 -27 Copyright © 2007 Juniper Networks, Inc. Education Services 9 -27

Agenda: Troubleshooting § Troubleshooting Methodology § Resources and Troubleshooting Tool Kit àBest Practices § Troubleshooting Hardware § Troubleshooting Software § Troubleshooting Interfaces § Troubleshooting Protocols (OSPF) 9 -28 Copyright © 2007 Juniper Networks, Inc. Education Services 9 -28

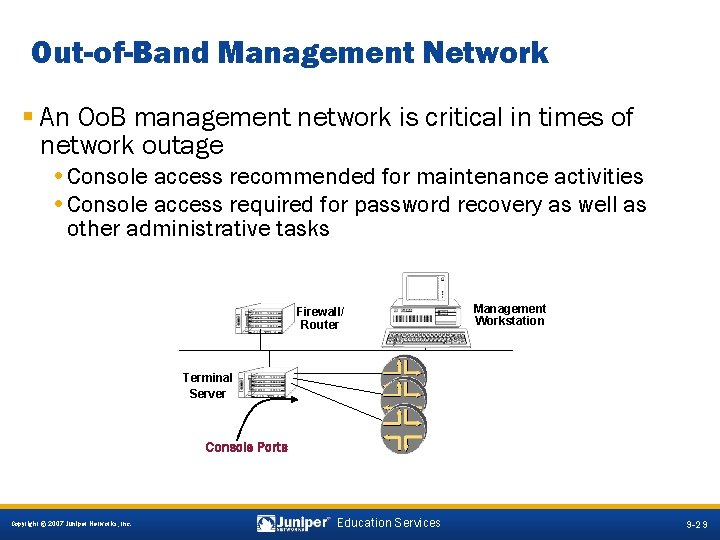
Out-of-Band Management Network § An Oo. B management network is critical in times of network outage • Console access recommended for maintenance activities • Console access required for password recovery as well as other administrative tasks Firewall/ Router . 100 Management Workstation Terminal Server Console Ports 9 -29 Copyright © 2007 Juniper Networks, Inc. Education Services 9 -29
![Monitoring Devices Using SNMP Configure SNMP monitoring at edit snmp hierarchy level Monitoring Devices Using SNMP § Configure SNMP monitoring at [edit snmp] hierarchy level •](https://slidetodoc.com/presentation_image_h/9a45cfe4fb0e9d2ad9ca46edb77f6ebd/image-25.jpg)
Monitoring Devices Using SNMP § Configure SNMP monitoring at [edit snmp] hierarchy level • SNMP communities allow central network management system to monitor router • Define authorization level and client list • SNMP traps allow router to send notifications to network management system when significant events occur • Define trap categories and targets Restricts all other clients from polling local device [edit] user@host# show snmp community Juniper { authorization read-only; clients { 10. 210. 9. 189/32; 0. 0/0 restrict; } } trap-group trap-door { categories { chassis; link; routing; } targets { 10. 210. 9. 189; } } 9 -30 Copyright © 2007 Juniper Networks, Inc. Education Services 9 -30

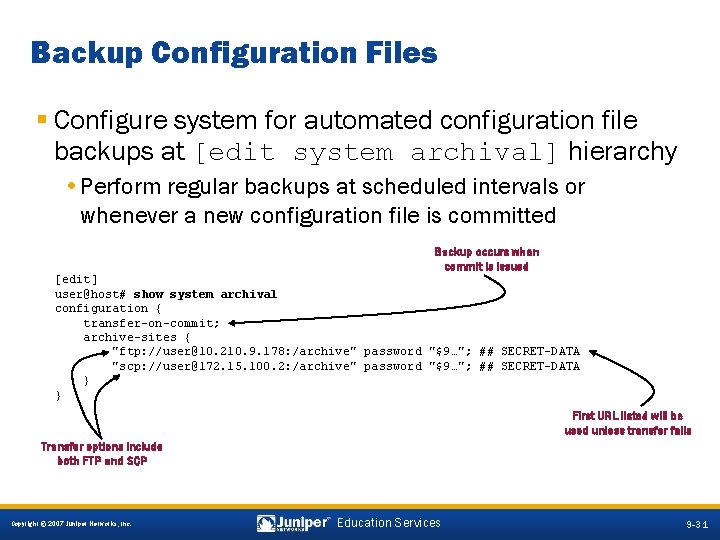
Backup Configuration Files § Configure system for automated configuration file backups at [edit system archival] hierarchy • Perform regular backups at scheduled intervals or whenever a new configuration file is committed Backup occurs when commit is issued [edit] user@host# show system archival configuration { transfer-on-commit; archive-sites { "ftp: //user@10. 210. 9. 178: /archive" password "$9…"; ## SECRET-DATA "scp: //user@172. 15. 100. 2: /archive" password "$9…"; ## SECRET-DATA } } First URL listed will be used unless transfer fails Transfer options include both FTP and SCP 9 -31 Copyright © 2007 Juniper Networks, Inc. Education Services 9 -31

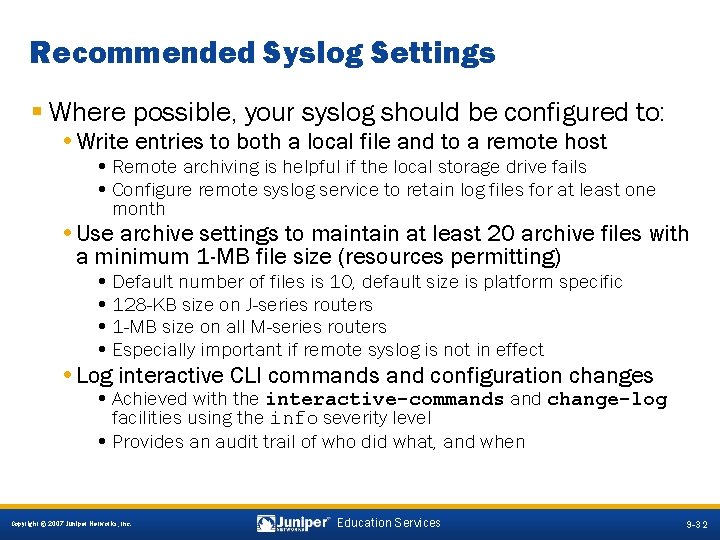
Recommended Syslog Settings § Where possible, your syslog should be configured to: • Write entries to both a local file and to a remote host • Remote archiving is helpful if the local storage drive fails • Configure remote syslog service to retain log files for at least one month • Use archive settings to maintain at least 20 archive files with a minimum 1 -MB file size (resources permitting) • Default number of files is 10, default size is platform specific • 128 -KB size on J-series routers • 1 -MB size on all M-series routers • Especially important if remote syslog is not in effect • Log interactive CLI commands and configuration changes • Achieved with the interactive-commands and change-log facilities using the info severity level • Provides an audit trail of who did what, and when 9 -32 Copyright © 2007 Juniper Networks, Inc. Education Services 9 -32

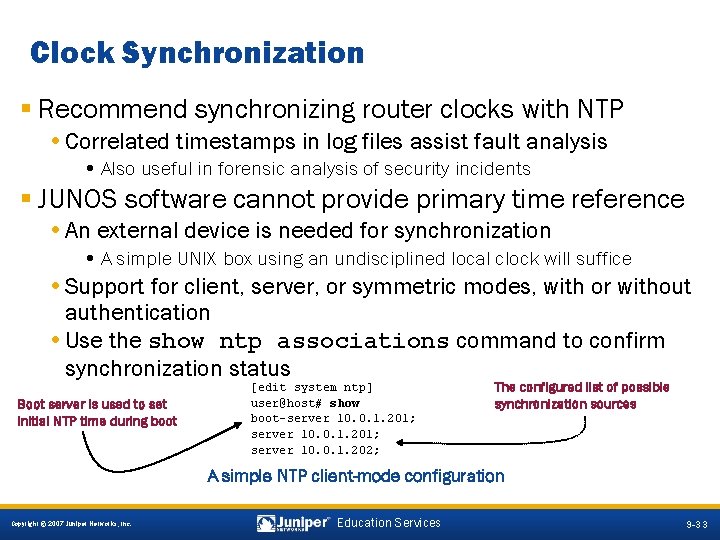
Clock Synchronization § Recommend synchronizing router clocks with NTP • Correlated timestamps in log files assist fault analysis • Also useful in forensic analysis of security incidents § JUNOS software cannot provide primary time reference • An external device is needed for synchronization • A simple UNIX box using an undisciplined local clock will suffice • Support for client, server, or symmetric modes, with or without authentication • Use the show ntp associations command to confirm synchronization status Boot server is used to set initial NTP time during boot [edit system ntp] user@host# show boot-server 10. 0. 1. 201; server 10. 0. 1. 202; The configured list of possible synchronization sources A simple NTP client-mode configuration 9 -33 Copyright © 2007 Juniper Networks, Inc. Education Services 9 -33

Lab 7—Parts 1– 3: Troubleshooting § Use the CLI troubleshooting tools. § Establish a baseline of operation for your team’s station. § Add best-practice configuration that promotes troubleshooting and facilitates disaster recovery. 9 -35 Copyright © 2007 Juniper Networks, Inc. Education Services 9 -35

Agenda: Troubleshooting § Troubleshooting Methodology § Resources and Troubleshooting Tool Kit § Best Practices àTroubleshooting Hardware § Troubleshooting Software § Troubleshooting Interfaces § Troubleshooting Protocols (OSPF) 9 -36 Copyright © 2007 Juniper Networks, Inc. Education Services 9 -36

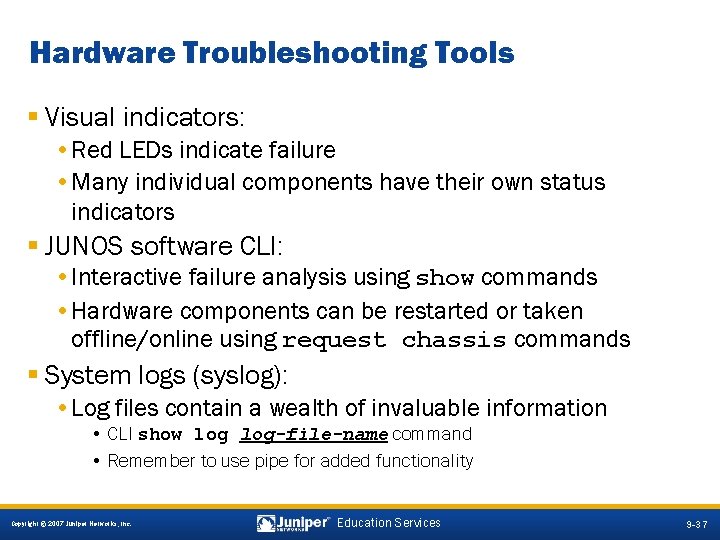
Hardware Troubleshooting Tools § Visual indicators: • Red LEDs indicate failure • Many individual components have their own status indicators § JUNOS software CLI: • Interactive failure analysis using show commands • Hardware components can be restarted or taken offline/online using request chassis commands § System logs (syslog): • Log files contain a wealth of invaluable information • CLI show log-file-name command • Remember to use pipe for added functionality 9 -37 Copyright © 2007 Juniper Networks, Inc. Education Services 9 -37

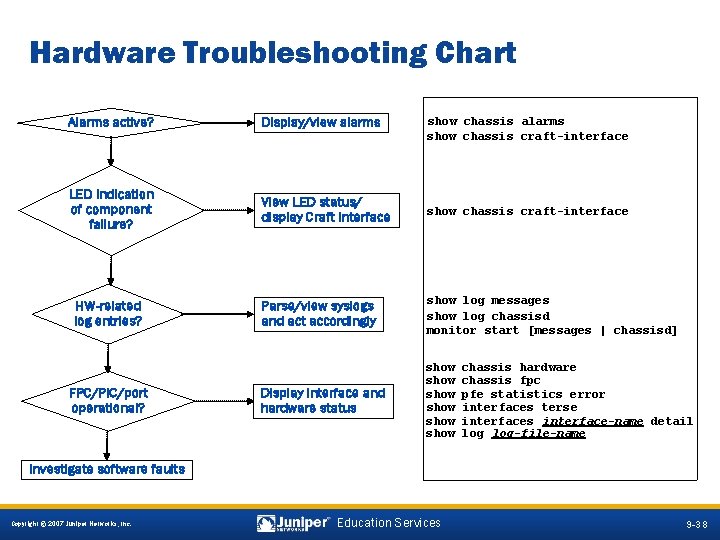
Hardware Troubleshooting Chart Alarms active? Display/view alarms LED indication of component failure? View LED status/ display Craft Interface show chassis craft-interface Parse/view syslogs and act accordingly show log messages show log chassisd monitor start [messages | chassisd] Display interface and hardware status show show HW-related log entries? FPC/PIC/port operational? show chassis alarms show chassis craft-interface chassis hardware chassis fpc pfe statistics error interfaces terse interfaces interface-name detail log-file-name Investigate software faults 9 -38 Copyright © 2007 Juniper Networks, Inc. Education Services 9 -38

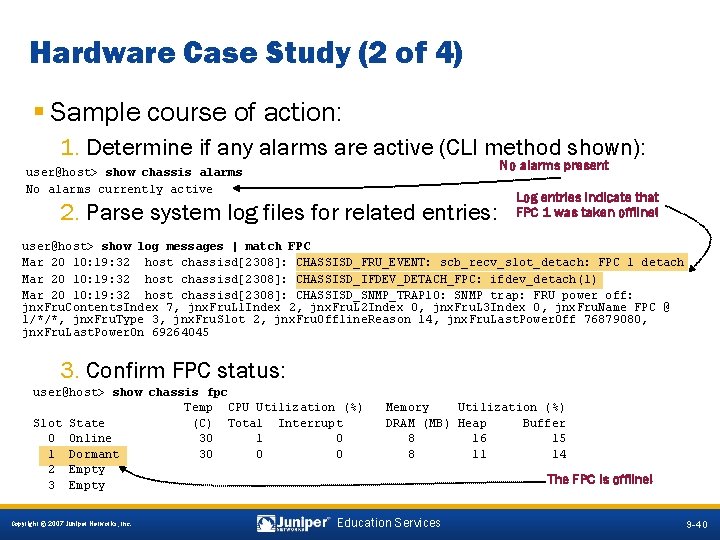
Hardware Case Study (1 of 4) § Case study background: • You have received notification that two ATM links went down • These ATM links are served by two OC 12 c PICs in an M 120 router’s FPC slot 1 § What is wrong? • What CLI commands help narrow down a possible cause? 9 -39 Copyright © 2007 Juniper Networks, Inc. Education Services 9 -39

Hardware Case Study (2 of 4) § Sample course of action: 1. Determine if any alarms are active (CLI method shown): No alarms present user@host> show chassis alarms No alarms currently active 2. Parse system log files for related entries: Log entries indicate that FPC 1 was taken offline! user@host> show log messages | match FPC Mar 20 10: 19: 32 host chassisd[2308]: CHASSISD_FRU_EVENT: scb_recv_slot_detach: FPC 1 detach Mar 20 10: 19: 32 host chassisd[2308]: CHASSISD_IFDEV_DETACH_FPC: ifdev_detach(1) Mar 20 10: 19: 32 host chassisd[2308]: CHASSISD_SNMP_TRAP 10: SNMP trap: FRU power off: jnx. Fru. Contents. Index 7, jnx. Fru. L 1 Index 2, jnx. Fru. L 2 Index 0, jnx. Fru. L 3 Index 0, jnx. Fru. Name FPC @ 1/*/*, jnx. Fru. Type 3, jnx. Fru. Slot 2, jnx. Fru. Offline. Reason 14, jnx. Fru. Last. Power. Off 76879080, jnx. Fru. Last. Power. On 69264045 3. Confirm FPC status: user@host> show chassis fpc Temp CPU Utilization (%) Slot State (C) Total Interrupt 0 Online 30 1 Dormant 30 0 0 2 Empty 3 Empty Copyright © 2007 Juniper Networks, Inc. Memory Utilization (%) DRAM (MB) Heap Buffer 8 16 15 8 11 14 Education Services The FPC is offline! 9 -40

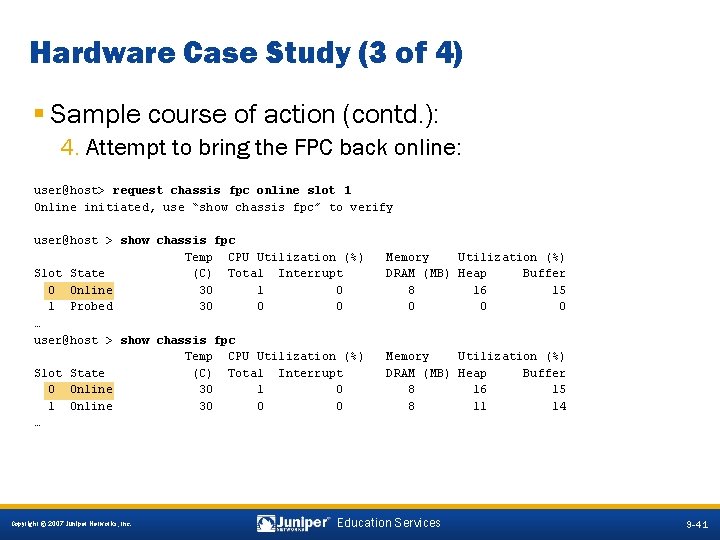
Hardware Case Study (3 of 4) § Sample course of action (contd. ): 4. Attempt to bring the FPC back online: user@host> request chassis fpc online slot 1 Online initiated, use “show chassis fpc” to verify user@host > show chassis fpc Temp CPU Utilization (%) Slot State (C) Total Interrupt 0 Online 30 1 Probed 30 0 0 … user@host > show chassis fpc Temp CPU Utilization (%) Slot State (C) Total Interrupt 0 Online 30 1 Online 30 0 0 … Memory Utilization (%) DRAM (MB) Heap Buffer 8 16 15 0 0 0 Memory Utilization (%) DRAM (MB) Heap Buffer 8 16 15 8 11 14 9 -41 Copyright © 2007 Juniper Networks, Inc. Education Services 9 -41

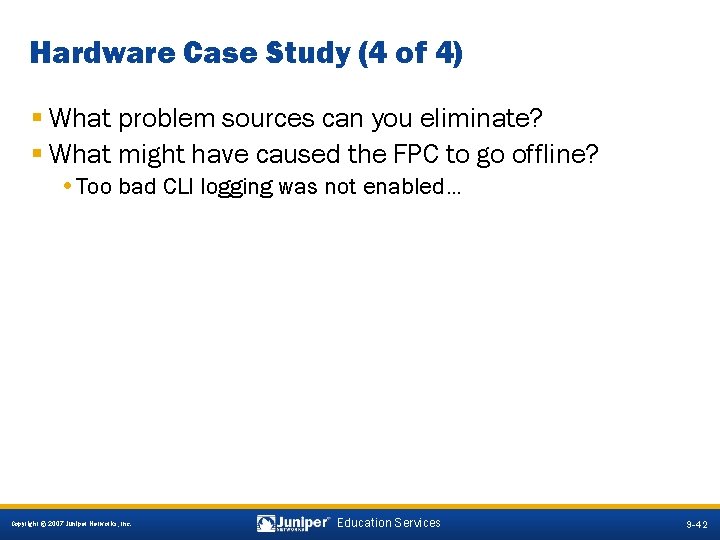
Hardware Case Study (4 of 4) § What problem sources can you eliminate? § What might have caused the FPC to go offline? • Too bad CLI logging was not enabled… 9 -42 Copyright © 2007 Juniper Networks, Inc. Education Services 9 -42

Agenda: Troubleshooting § Troubleshooting Methodology § Resources and Troubleshooting Tool Kit § Best Practices § Troubleshooting Hardware àTroubleshooting Software § Troubleshooting Interfaces § Troubleshooting Protocols (OSPF) 9 -43 Copyright © 2007 Juniper Networks, Inc. Education Services 9 -43

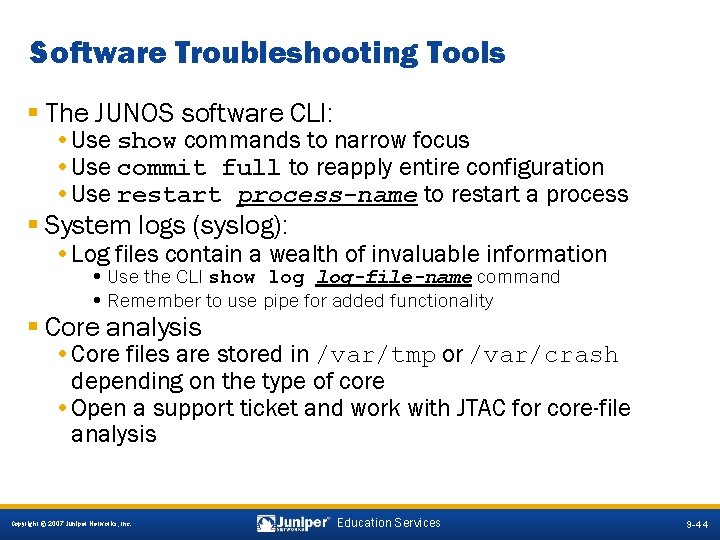
Software Troubleshooting Tools § The JUNOS software CLI: • Use show commands to narrow focus • Use commit full to reapply entire configuration • Use restart process-name to restart a process § System logs (syslog): • Log files contain a wealth of invaluable information • Use the CLI show log-file-name command • Remember to use pipe for added functionality § Core analysis • Core files are stored in /var/tmp or /var/crash depending on the type of core • Open a support ticket and work with JTAC for core-file analysis 9 -44 Copyright © 2007 Juniper Networks, Inc. Education Services 9 -44

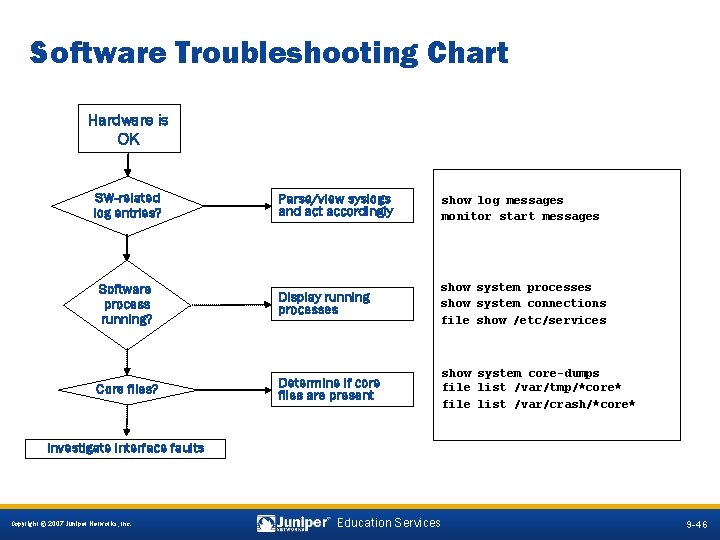
Software Troubleshooting Chart Hardware is OK SW-related log entries? Parse/view syslogs and act accordingly show log messages monitor start messages Software process running? Display running processes show system connections file show /etc/services Core files? Determine if core files are present show system core-dumps file list /var/tmp/*core* file list /var/crash/*core* Investigate interface faults 9 -46 Copyright © 2007 Juniper Networks, Inc. Education Services 9 -46

Software Case Study (1 of 3) § Case study background: • The people in the management group report that they have lost SNMP contact with your router • No hardware alarms or malfunctions are evident § What is wrong? • What CLI commands and fault analysis steps can help narrow down a possible cause? 9 -47 Copyright © 2007 Juniper Networks, Inc. Education Services 9 -47

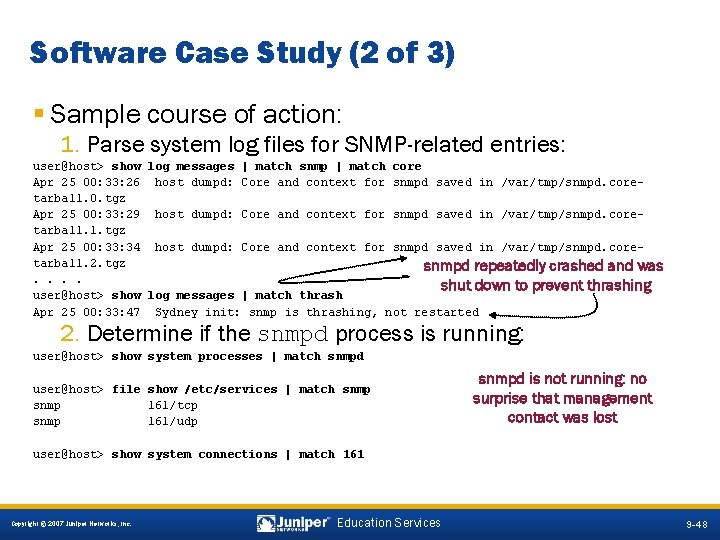
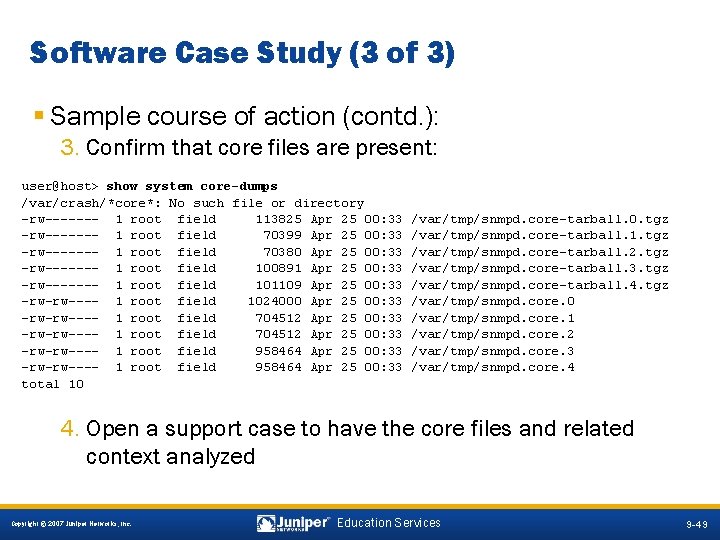
Software Case Study (2 of 3) § Sample course of action: 1. Parse system log files for SNMP-related entries: user@host> show log messages | match snmp | match core Apr 25 00: 33: 26 host dumpd: Core and context for snmpd saved in /var/tmp/snmpd. coretarball. 0. tgz Apr 25 00: 33: 29 host dumpd: Core and context for snmpd saved in /var/tmp/snmpd. coretarball. 1. tgz Apr 25 00: 33: 34 host dumpd: Core and context for snmpd saved in /var/tmp/snmpd. coretarball. 2. tgz snmpd repeatedly crashed and was. . shut down to prevent thrashing user@host> show log messages | match thrash Apr 25 00: 33: 47 Sydney init: snmp is thrashing, not restarted 2. Determine if the snmpd process is running: user@host> show system processes | match snmpd user@host> file show /etc/services | match snmp 161/tcp snmp 161/udp snmpd is not running: no surprise that management contact was lost user@host> show system connections | match 161 9 -48 Copyright © 2007 Juniper Networks, Inc. Education Services 9 -48

Software Case Study (3 of 3) § Sample course of action (contd. ): 3. Confirm that core files are present: user@host> show system core-dumps /var/crash/*core*: No such file or directory -rw------- 1 root field 113825 Apr 25 00: 33 -rw------- 1 root field 70399 Apr 25 00: 33 -rw------- 1 root field 70380 Apr 25 00: 33 -rw------- 1 root field 100891 Apr 25 00: 33 -rw------- 1 root field 101109 Apr 25 00: 33 -rw-rw---- 1 root field 1024000 Apr 25 00: 33 -rw-rw---- 1 root field 704512 Apr 25 00: 33 -rw-rw---- 1 root field 958464 Apr 25 00: 33 total 10 /var/tmp/snmpd. core-tarball. 0. tgz /var/tmp/snmpd. core-tarball. 1. tgz /var/tmp/snmpd. core-tarball. 2. tgz /var/tmp/snmpd. core-tarball. 3. tgz /var/tmp/snmpd. core-tarball. 4. tgz /var/tmp/snmpd. core. 0 /var/tmp/snmpd. core. 1 /var/tmp/snmpd. core. 2 /var/tmp/snmpd. core. 3 /var/tmp/snmpd. core. 4 4. Open a support case to have the core files and related context analyzed 9 -49 Copyright © 2007 Juniper Networks, Inc. Education Services 9 -49

Agenda: Troubleshooting § Troubleshooting Methodology § Resources and Troubleshooting Tool Kit § Best Practices § Troubleshooting Hardware § Troubleshooting Software àTroubleshooting Interfaces § Troubleshooting Protocols (OSPF) 9 -50 Copyright © 2007 Juniper Networks, Inc. Education Services 9 -50

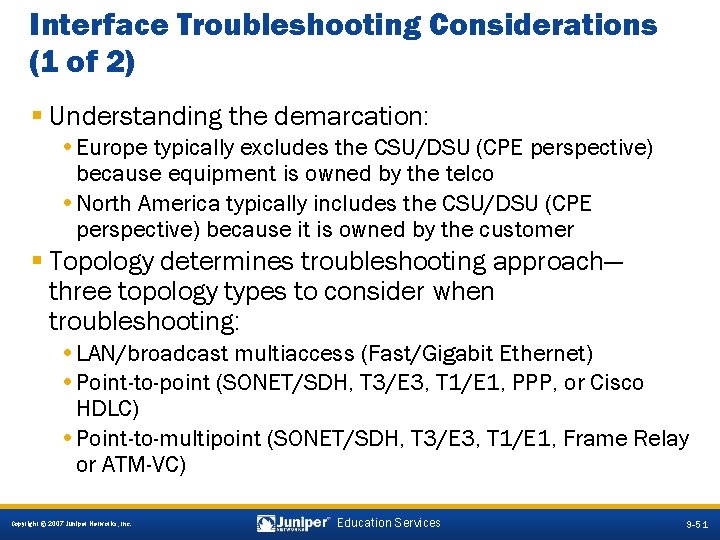
Interface Troubleshooting Considerations (1 of 2) § Understanding the demarcation: • Europe typically excludes the CSU/DSU (CPE perspective) because equipment is owned by the telco • North America typically includes the CSU/DSU (CPE perspective) because it is owned by the customer § Topology determines troubleshooting approach— three topology types to consider when troubleshooting: • LAN/broadcast multiaccess (Fast/Gigabit Ethernet) • Point-to-point (SONET/SDH, T 3/E 3, T 1/E 1, PPP, or Cisco HDLC) • Point-to-multipoint (SONET/SDH, T 3/E 3, T 1/E 1, Frame Relay or ATM-VC) 9 -51 Copyright © 2007 Juniper Networks, Inc. Education Services 9 -51

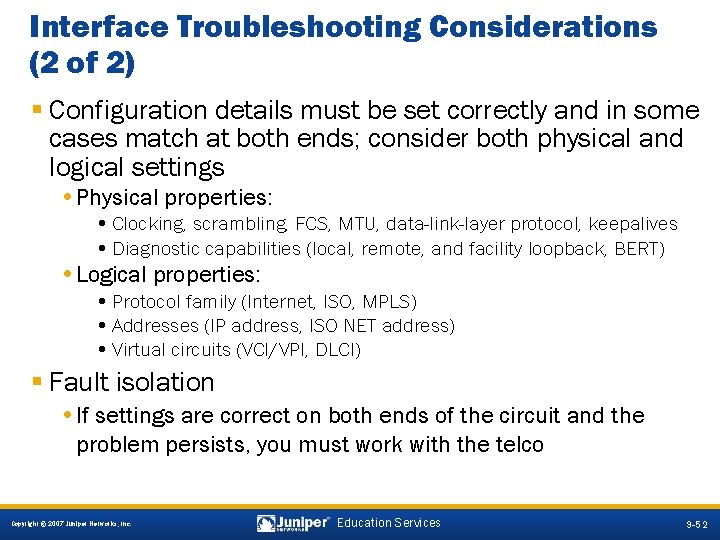
Interface Troubleshooting Considerations (2 of 2) § Configuration details must be set correctly and in some cases match at both ends; consider both physical and logical settings • Physical properties: • Clocking, scrambling, FCS, MTU, data-link-layer protocol, keepalives • Diagnostic capabilities (local, remote, and facility loopback, BERT) • Logical properties: • Protocol family (Internet, ISO, MPLS) • Addresses (IP address, ISO NET address) • Virtual circuits (VCI/VPI, DLCI) § Fault isolation • If settings are correct on both ends of the circuit and the problem persists, you must work with the telco 9 -52 Copyright © 2007 Juniper Networks, Inc. Education Services 9 -52

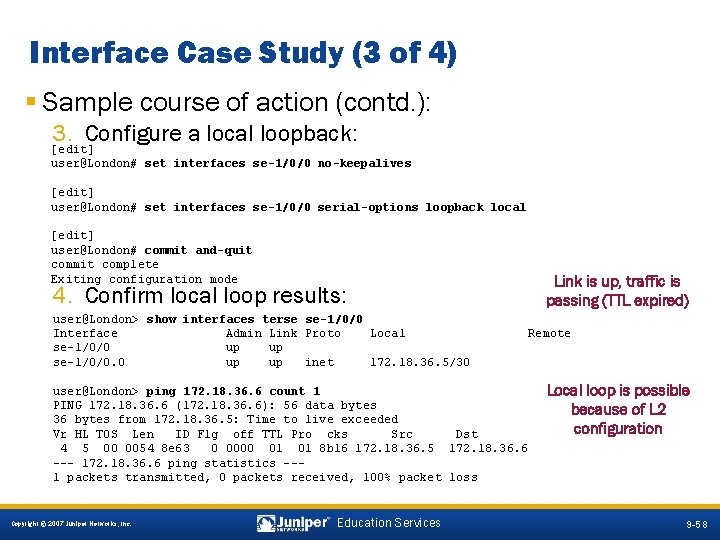
Interface Troubleshooting Tools § The JUNOS software CLI: • Use the show interfaces commands to view interface details (add detail or extensive to view errors and alarms) • Use monitor interface to view real-time statistics • Use show arp to view ARP table details § Diagnostic tools: • Use monitor traffic when troubleshooting Layer 2 • Use ping or BERT testing for circuit error detection and verification • Use the pattern option with ping utility when testing a circuit for errors § Loopback testing is the primary way to distinguish between interface and circuit faults • For loopback testing details for the various interface types, see http: //www. juniper. net/techpubs/software/nog/ 9 -53 Copyright © 2007 Juniper Networks, Inc. Education Services 9 -53

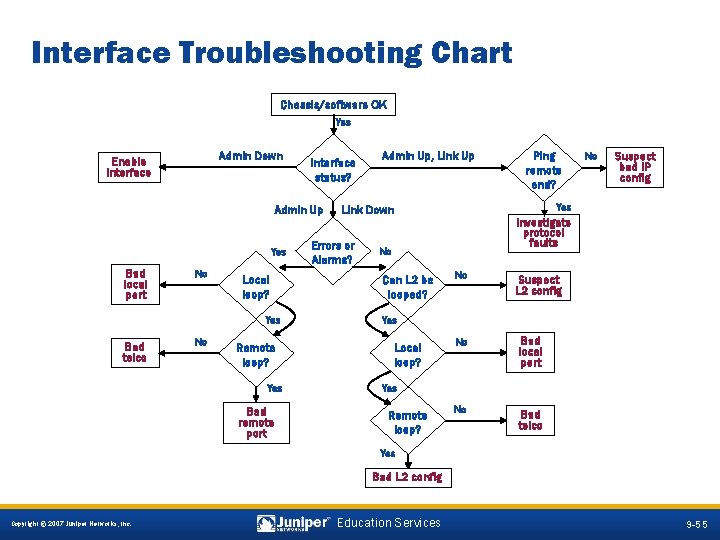
Interface Troubleshooting Chart Chassis/software OK Yes Admin Down Enable interface Interface status? Admin Up Yes Bad local port No Local loop? Yes Bad telco No Remote loop? Yes Bad remote port Admin Up, Link Up Suspect bad IP config Investigate protocol faults No Can L 2 be looped? No Yes Link Down Errors or Alarms? Ping remote end? No Suspect L 2 config Yes Local loop? No Bad local port No Bad telco Yes Remote loop? Yes Bad L 2 config 9 -55 Copyright © 2007 Juniper Networks, Inc. Education Services 9 -55

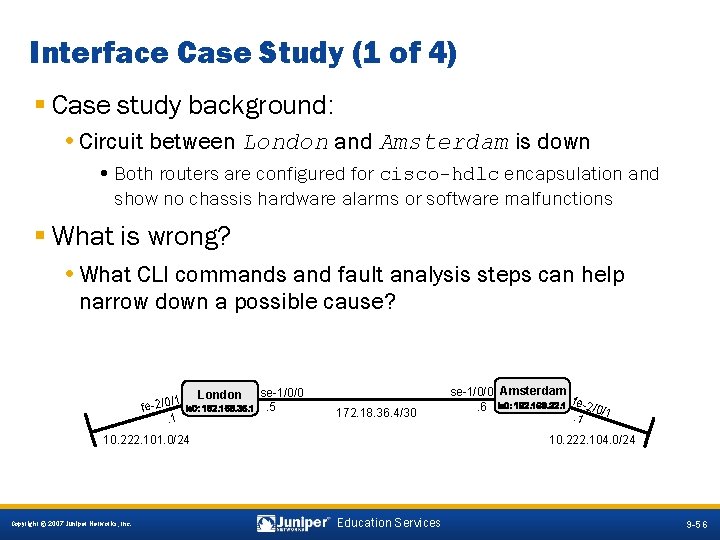
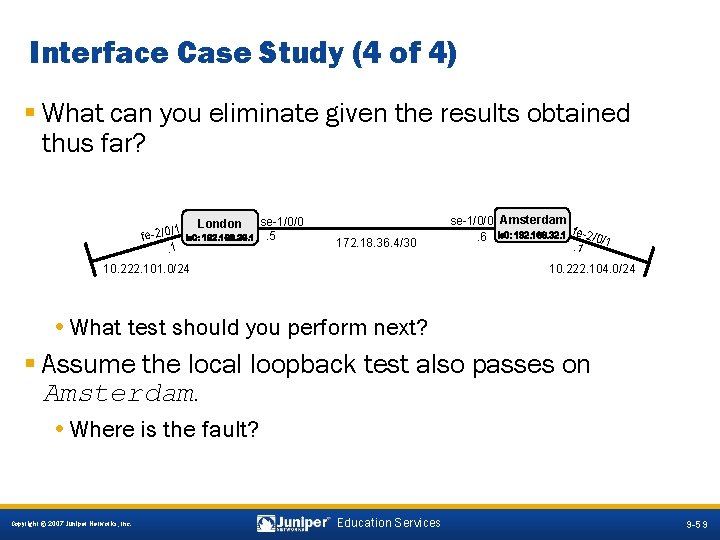
Interface Case Study (1 of 4) § Case study background: • Circuit between London and Amsterdam is down • Both routers are configured for cisco-hdlc encapsulation and show no chassis hardware alarms or software malfunctions § What is wrong? • What CLI commands and fault analysis steps can help narrow down a possible cause? /1 fe-2/0. 1 London HARLIE lo 0: 192. 168. 36. 1 se-1/0/0. 5 172. 18. 36. 4/30 10. 222. 101. 0/24 se-1/0/0 Amsterdam Wintermute. 6 lo 0: 192. 168. 32. 1 fe-2/0/1. 1 10. 222. 104. 0/24 9 -56 Copyright © 2007 Juniper Networks, Inc. Education Services 9 -56

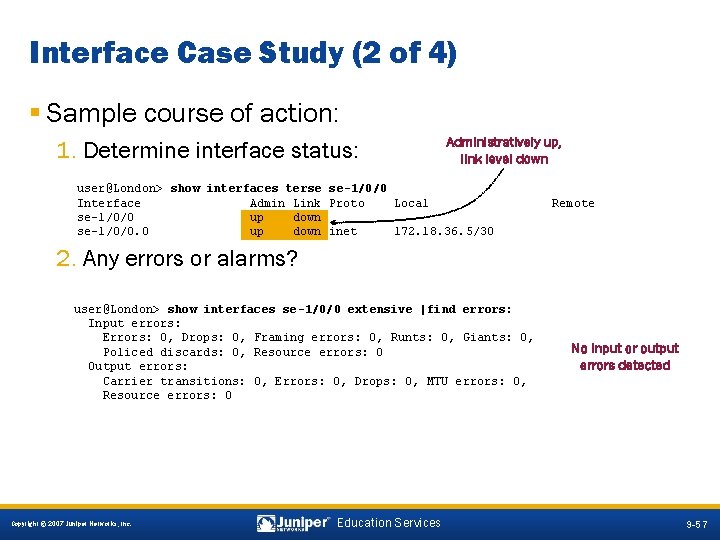
Interface Case Study (2 of 4) § Sample course of action: 1. Determine interface status: Administratively up, link level down user@London> show interfaces terse se-1/0/0 Interface Admin Link Proto Local se-1/0/0 up down se-1/0/0. 0 up down inet 172. 18. 36. 5/30 Remote 2. Any errors or alarms? user@London> show interfaces se-1/0/0 extensive |find errors: Input errors: Errors: 0, Drops: 0, Framing errors: 0, Runts: 0, Giants: 0, Policed discards: 0, Resource errors: 0 Output errors: Carrier transitions: 0, Errors: 0, Drops: 0, MTU errors: 0, Resource errors: 0 No input or output errors detected 9 -57 Copyright © 2007 Juniper Networks, Inc. Education Services 9 -57

Interface Case Study (3 of 4) § Sample course of action (contd. ): 3. Configure a local loopback: [edit] user@London# set interfaces se-1/0/0 no-keepalives [edit] user@London# set interfaces se-1/0/0 serial-options loopback local [edit] user@London# commit and-quit commit complete Exiting configuration mode Link is up, traffic is passing (TTL expired) 4. Confirm local loop results: user@London> show interfaces terse se-1/0/0 Interface Admin Link Proto Local se-1/0/0 up up se-1/0/0. 0 up up inet 172. 18. 36. 5/30 Remote user@London> ping 172. 18. 36. 6 count 1 PING 172. 18. 36. 6 (172. 18. 36. 6): 56 data bytes 36 bytes from 172. 18. 36. 5: Time to live exceeded Vr HL TOS Len ID Flg off TTL Pro cks Src Dst 4 5 00 0054 8 e 63 0 0000 01 01 8 b 16 172. 18. 36. 5 172. 18. 36. 6 --- 172. 18. 36. 6 ping statistics --1 packets transmitted, 0 packets received, 100% packet loss Local loop is possible because of L 2 configuration 9 -58 Copyright © 2007 Juniper Networks, Inc. Education Services 9 -58

Interface Case Study (4 of 4) § What can you eliminate given the results obtained thus far? /1 fe-2/0. 1 London HARLIE lo 0: 192. 168. 36. 1 se-1/0/0. 5 172. 18. 36. 4/30 10. 222. 101. 0/24 se-1/0/0 Amsterdam Wintermute. 6 lo 0: 192. 168. 32. 1 fe-2/0/1. 1 10. 222. 104. 0/24 • What test should you perform next? § Assume the local loopback test also passes on Amsterdam. • Where is the fault? 9 -59 Copyright © 2007 Juniper Networks, Inc. Education Services 9 -59

Agenda: Troubleshooting § Troubleshooting Methodology § Resources and Troubleshooting Tool Kit § Best Practices § Troubleshooting Hardware § Troubleshooting Software § Troubleshooting Interfaces àTroubleshooting Protocols (OSPF) 9 -60 Copyright © 2007 Juniper Networks, Inc. Education Services 9 -60

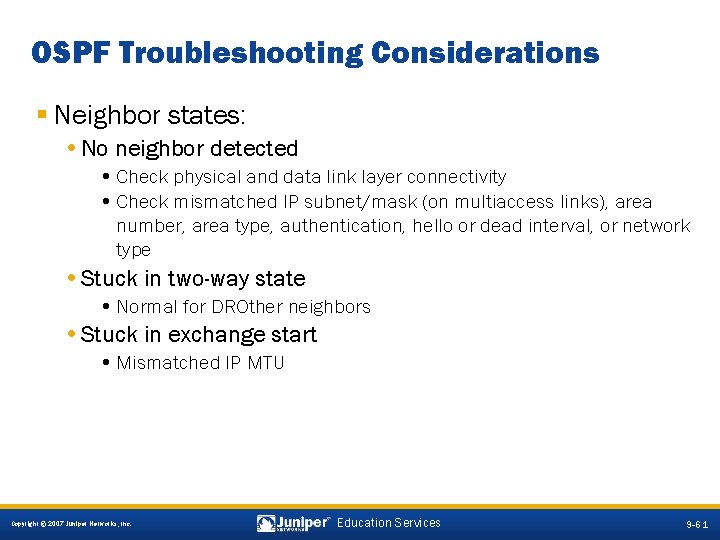
OSPF Troubleshooting Considerations § Neighbor states: • No neighbor detected • Check physical and data link layer connectivity • Check mismatched IP subnet/mask (on multiaccess links), area number, area type, authentication, hello or dead interval, or network type • Stuck in two-way state • Normal for DROther neighbors • Stuck in exchange start • Mismatched IP MTU 9 -61 Copyright © 2007 Juniper Networks, Inc. Education Services 9 -61

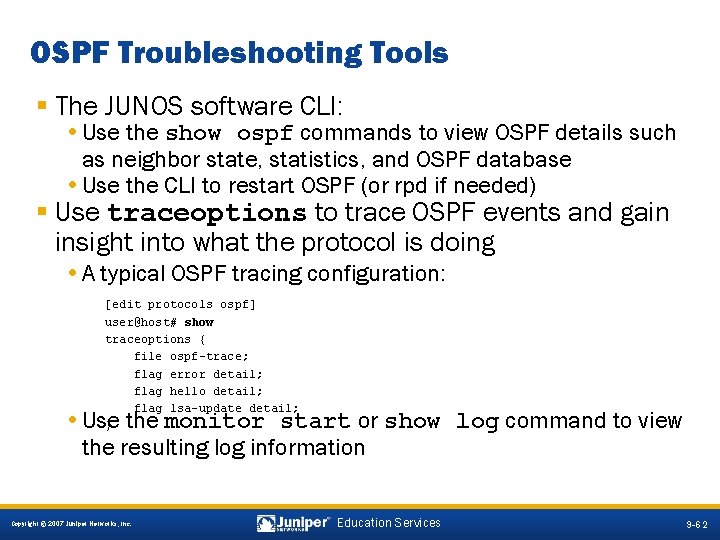
OSPF Troubleshooting Tools § The JUNOS software CLI: • Use the show ospf commands to view OSPF details such as neighbor state, statistics, and OSPF database • Use the CLI to restart OSPF (or rpd if needed) § Use traceoptions to trace OSPF events and gain insight into what the protocol is doing • A typical OSPF tracing configuration: [edit protocols ospf] user@host# show traceoptions { file ospf-trace; flag error detail; flag hello detail; flag lsa-update detail; } • Use the monitor start or show log command to view the resulting log information 9 -62 Copyright © 2007 Juniper Networks, Inc. Education Services 9 -62

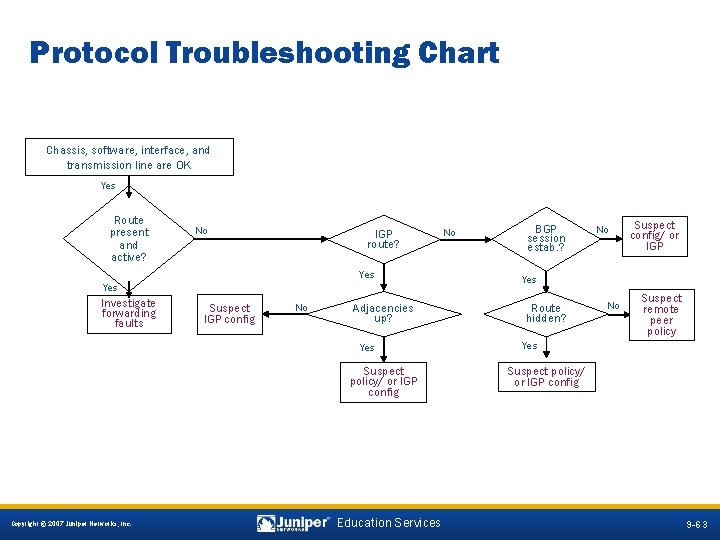
Protocol Troubleshooting Chart Chassis, software, interface, and transmission line are OK Yes Route present and active? No IGP route? Yes Investigate forwarding faults Suspect IGP config No Adjacencies up? Yes Suspect policy/ or IGP config No BGP session estab. ? No Suspect config/ or IGP Yes Route hidden? No Suspect remote peer policy Yes Suspect policy/ or IGP config 9 -63 Copyright © 2007 Juniper Networks, Inc. Education Services 9 -63

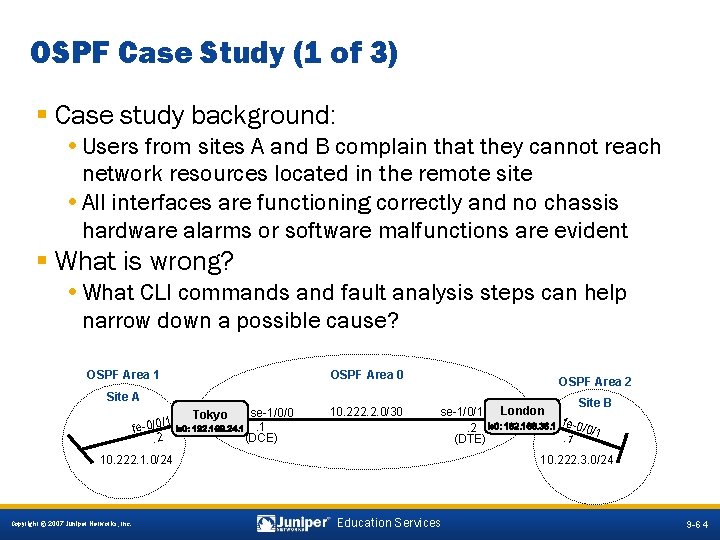
OSPF Case Study (1 of 3) § Case study background: • Users from sites A and B complain that they cannot reach network resources located in the remote site • All interfaces are functioning correctly and no chassis hardware alarms or software malfunctions are evident § What is wrong? • What CLI commands and fault analysis steps can help narrow down a possible cause? OSPF Area 0 OSPF Area 1 Site A se-1/0/0 1 HARLIE / 0. 1 lo 0: 192. 168. 24. 1 fe (DCE). 2 Tokyo 10. 222. 2. 0/30 OSPF Area 2 Site B se-1/0/1 London Wintermute. 2 lo 0: 192. 168. 36. 1 fe-0/0/1. 1 (DTE) 10. 222. 1. 0/24 10. 222. 3. 0/24 9 -64 Copyright © 2007 Juniper Networks, Inc. Education Services 9 -64

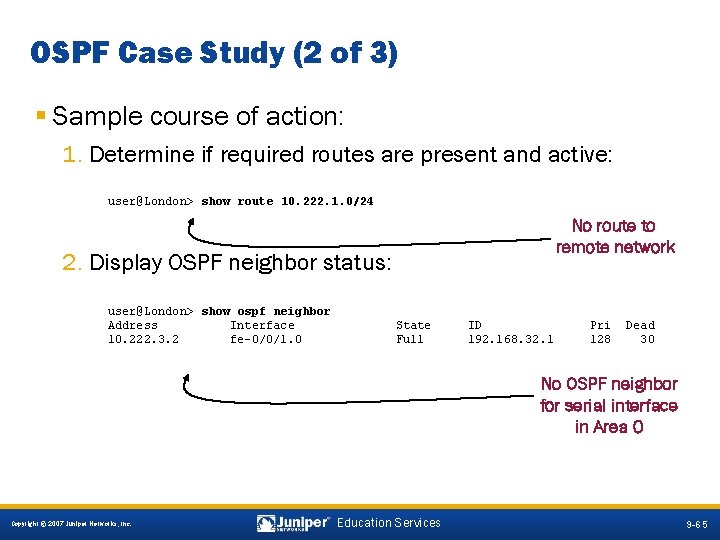
OSPF Case Study (2 of 3) § Sample course of action: 1. Determine if required routes are present and active: user@London> show route 10. 222. 1. 0/24 No route to remote network 2. Display OSPF neighbor status: user@London> show ospf neighbor Address Interface 10. 222. 3. 2 fe-0/0/1. 0 State Full ID 192. 168. 32. 1 Pri 128 Dead 30 No OSPF neighbor for serial interface in Area 0 9 -65 Copyright © 2007 Juniper Networks, Inc. Education Services 9 -65

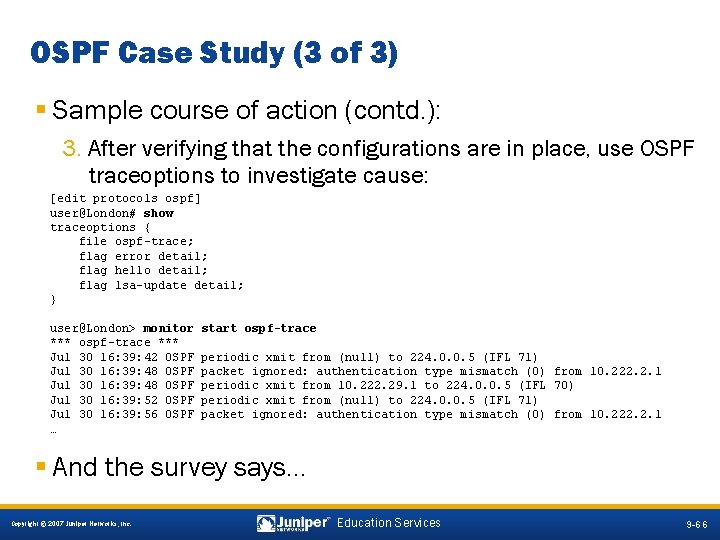
OSPF Case Study (3 of 3) § Sample course of action (contd. ): 3. After verifying that the configurations are in place, use OSPF traceoptions to investigate cause: [edit protocols ospf] user@London# show traceoptions { file ospf-trace; flag error detail; flag hello detail; flag lsa-update detail; } user@London> monitor *** ospf-trace *** Jul 30 16: 39: 42 OSPF Jul 30 16: 39: 48 OSPF Jul 30 16: 39: 52 OSPF Jul 30 16: 39: 56 OSPF … start ospf-trace periodic xmit from (null) to 224. 0. 0. 5 (IFL 71) packet ignored: authentication type mismatch (0) from 10. 222. 2. 1 periodic xmit from 10. 222. 29. 1 to 224. 0. 0. 5 (IFL 70) periodic xmit from (null) to 224. 0. 0. 5 (IFL 71) packet ignored: authentication type mismatch (0) from 10. 222. 2. 1 § And the survey says… 9 -66 Copyright © 2007 Juniper Networks, Inc. Education Services 9 -66

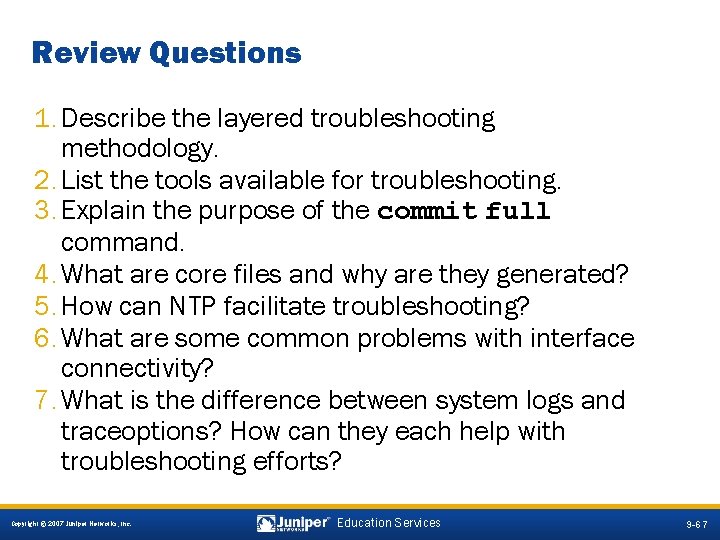
Review Questions 1. Describe the layered troubleshooting methodology. 2. List the tools available for troubleshooting. 3. Explain the purpose of the commit full command. 4. What are core files and why are they generated? 5. How can NTP facilitate troubleshooting? 6. What are some common problems with interface connectivity? 7. What is the difference between system logs and traceoptions? How can they each help with troubleshooting efforts? 9 -67 Copyright © 2007 Juniper Networks, Inc. Education Services 9 -67

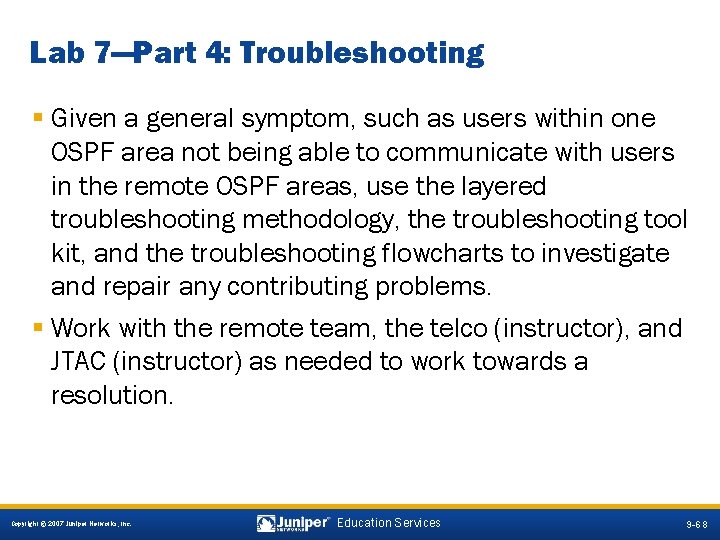
Lab 7—Part 4: Troubleshooting § Given a general symptom, such as users within one OSPF area not being able to communicate with users in the remote OSPF areas, use the layered troubleshooting methodology, the troubleshooting tool kit, and the troubleshooting flowcharts to investigate and repair any contributing problems. § Work with the remote team, the telco (instructor), and JTAC (instructor) as needed to work towards a resolution. 9 -68 Copyright © 2007 Juniper Networks, Inc. Education Services 9 -68

9 -69 Copyright © 2007 Juniper Networks, Inc. Education Services 9 -69