Open stomata allows for gas exchange CO 2

:")
:")
:")
:")
:")
 from wood cores of Aleppo pine")


- Slides: 15
Open stomata: allows for gas exchange: CO 2 in and water vapor out Atmospheric CO 2
Open stomata: allows for gas exchange: CO 2 in and water vapor out (R): Rubisco: one of the primary enzymes involved in photosynthesis
Open stomata: allows for gas exchange: CO 2 in and water vapor out (R): Rubisco: one of the primary enzymes involved in photosynthesis More 12 C fixed relative to 13 C: light isotopes react faster!
Open stomata: allows for gas exchange: CO 2 in and water vapor out (R): Rubisco: one of the primary enzymes involved in photosynthesis More 12 C fixed relative to 13 C: light isotopes react faster! Closed stomata: under water stress plant’s stomata remain closed, thus conserving water
Open stomata: allows for gas exchange: CO 2 in and water vapor out (R): Rubisco: one of the primary enzymes involved in photosynthesis More 12 C fixed relative to 13 C: light isotopes react faster! Closed stomata: under water stress plant’s stomata remain closed thus conserving water Increasing amounts of 13 C fixed via rubisco. 13 C builds up in concentration due to closed stomata and reduction in 12 C concentration.
Open stomata: allows for gas exchange: CO 2 in and water vapor out (R): Rubisco: one of the primary enzymes involved in photosynthesis More 12 C fixed relative to 13 C: light isotopes react faster! Closed stomata: under water stress plant’s stomata remain closed thus conserving water Increasing amounts of 13 C fixed via rubisco. 13 C builds up in concentration due to closed stomata and reduction in 12 C concentration Plant tissue becomes enriched in 13 C.
Relationship between carbon isotope composition (δ 13 C) from wood cores of Aleppo pine and mean annual precipitation Less Negative: Becoming enriched in 13 C
Heavier isotopes require more activation energy
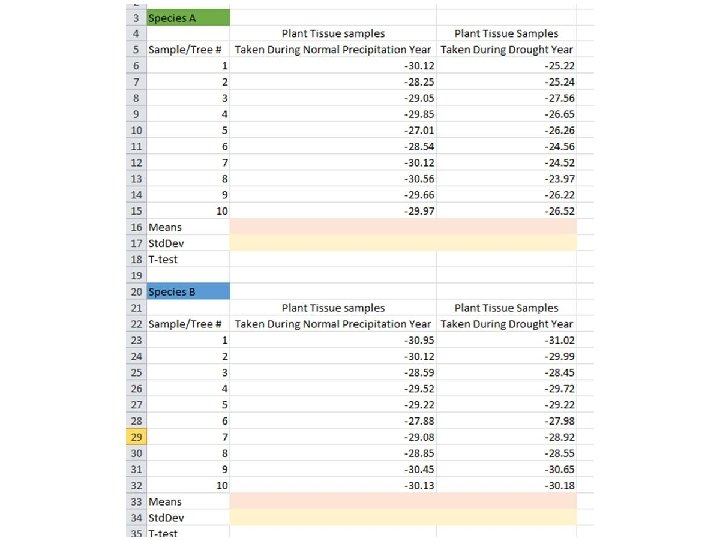
The t-test is used to statistically determine if 2 data sets represent the same population (Fig A) or from 2 different populations (Fig B) Response Variable (e. g. Plant growth rate) Represented as a distribution Bar graph with means & standard error P > 0. 05 P < 0. 05
Species A 0. 00 Species B -5. 00 -10. 00 -15. 00 -20. 00 -25. 00 B -30. 00 -35. 00 A Normal Precipitation Year Drought Year A A
Questions • Do trees growing during a drought show an isotopic signal that indicating drought stress? • Do both species respond in the same way to drought? Offer hypotheses to explain why you observed the pattern you did between species. • Compare these data to those published in specifically Figure 2: Zhang et al (1997) Carbon isotopic composition, gas exchange, and growth of three populations of ponderosa pine differing in drought tolerance. Tree Physiology 17: 461 -466. • Ask students: to these data show that drought has any effect on plants? • Ask students to discuss how they would experimentally test to determine if drought actually did have an effect on plants. • How could understanding carbon isotopes be useful in identifying sources of carbon dioxide emitted to the atmosphere?
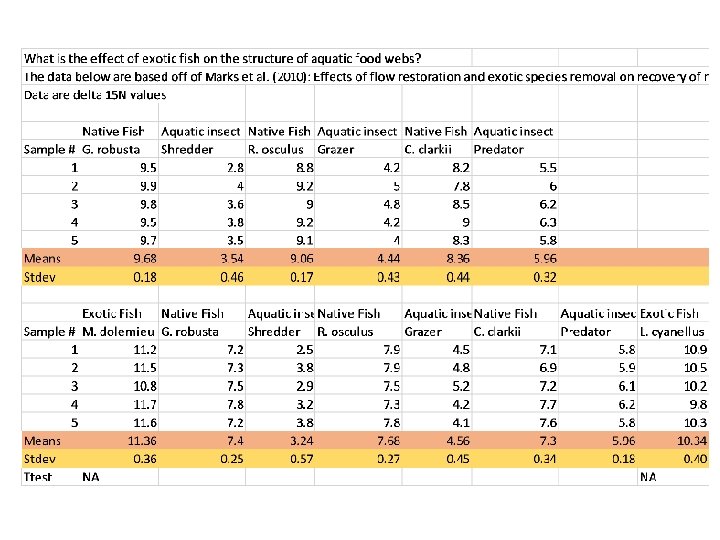
12 11. 36: M. dolemieu 11 Exotic Fish Absent 10. 34: L. cyanellus 10 Exotic Fish Present 9 8 7 6 5 4 3 2 tor da Pre C. c lar kii zer Gra lus os cu R. de red Sh G. ro bu sta 0 r 1
Questions • What is the effect of exotic fish on the structure of stream food webs? • Who does it appear that the exotic fish are feeding on? • Who would have higher 15 N values: a vegan or a person who consumed meat? • What are some other applications of nitrogen isotopes? (e. g. diets of human ancestors)