
Open data for science learning Mario Orsi Department
- Slides: 15
Open data for science learning Mario Orsi Department of Applied Sciences UWE Bristol
Acknowledgments • Faculty of Health and Applied Sciences • Learning & Teaching Innovation competition
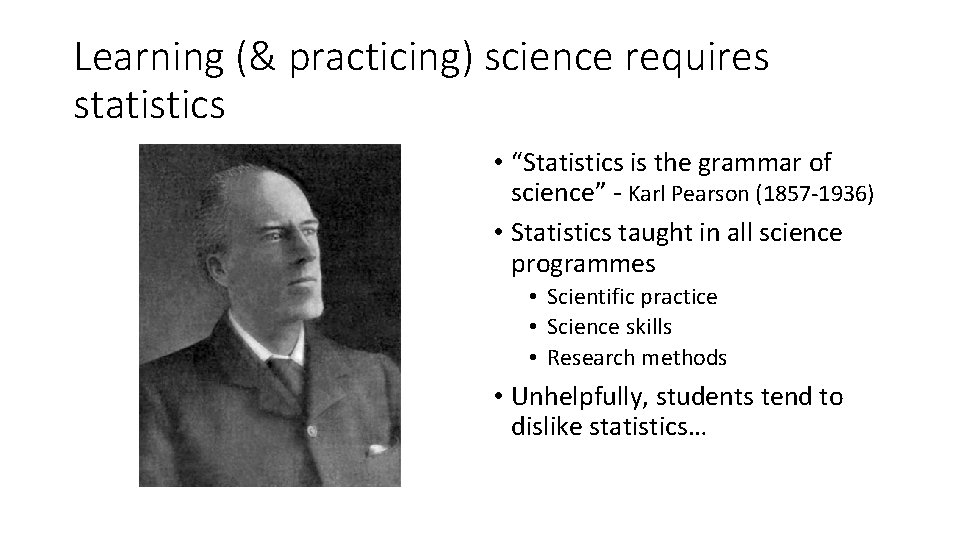
Learning (& practicing) science requires statistics • “Statistics is the grammar of science” - Karl Pearson (1857 -1936) • Statistics taught in all science programmes • Scientific practice • Science skills • Research methods • Unhelpfully, students tend to dislike statistics…
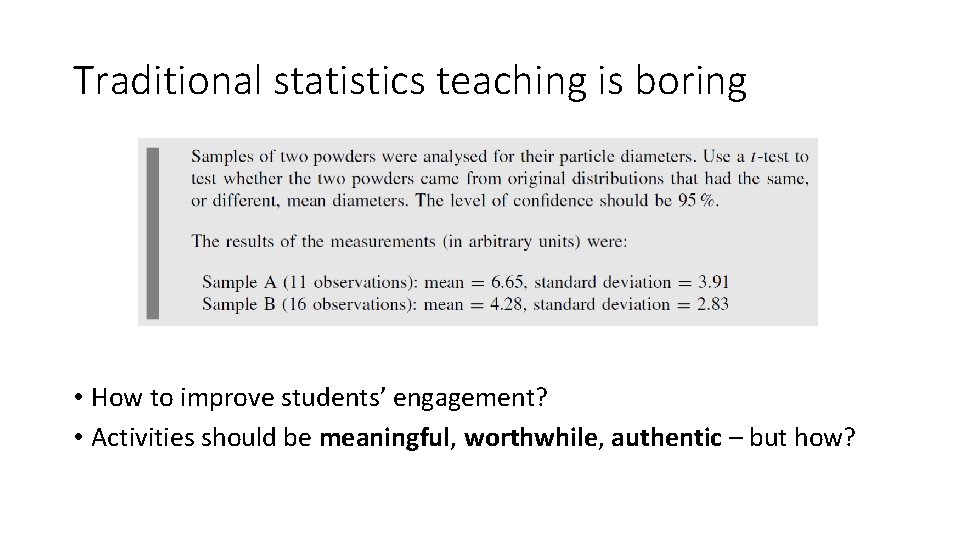
Traditional statistics teaching is boring • How to improve students’ engagement? • Activities should be meaningful, worthwhile, authentic – but how?
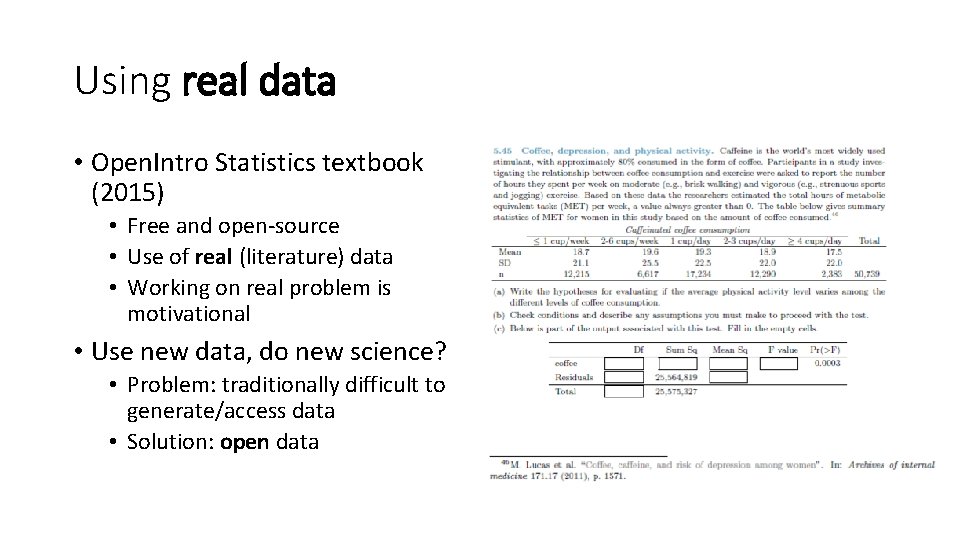
Using real data • Open. Intro Statistics textbook (2015) • Free and open-source • Use of real (literature) data • Working on real problem is motivational • Use new data, do new science? • Problem: traditionally difficult to generate/access data • Solution: open data
Open access to real data is fast increasing • “The Government is releasing public data to become more transparent and foster innovation” [data. gov. uk] • Research councils now promote use of “secondary data”
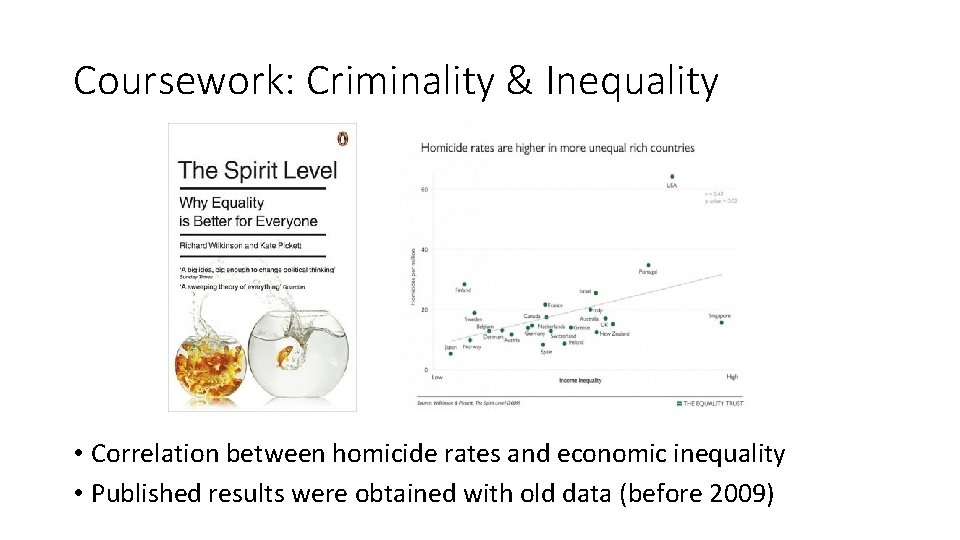
Coursework: Criminality & Inequality • Correlation between homicide rates and economic inequality • Published results were obtained with old data (before 2009)
Coursework: Criminality & Inequality • Task: reproduce correlation analysis • New data from public database (CIA World Factbook) • Students to perform new analysis of real problem on current data • Original finding not reproduced!
Unintended (yet very positive) outcomes • Confidence-building: • Learners directly experience (re)creation of published research • Critical thinking: • New data may disprove original findings • Demystification of science
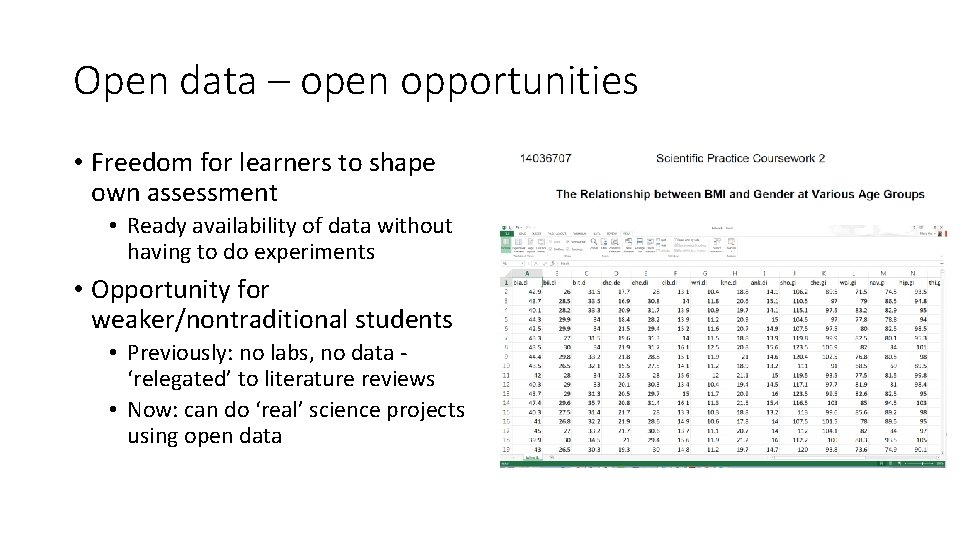
Open data – open opportunities • Freedom for learners to shape own assessment • Ready availability of data without having to do experiments • Opportunity for weaker/nontraditional students • Previously: no labs, no data - ‘relegated’ to literature reviews • Now: can do ‘real’ science projects using open data
New website under development (opendatastat. org) For students: • Curated data • Ideas for projects • Tutorials For staff: • Data repository (free publicity) • Collaboration • Secondary data research
Alignment to more general objectives • “Our graduates […] well equipped to make a positive contribution to society […] in developing a sustainable global society and knowledge economy […] globally responsible, future-facing. ” • "Statistical thinking will one day be as necessary for efficient citizenship as the ability to read and write“ - H. G. Wells (1866 -1946)
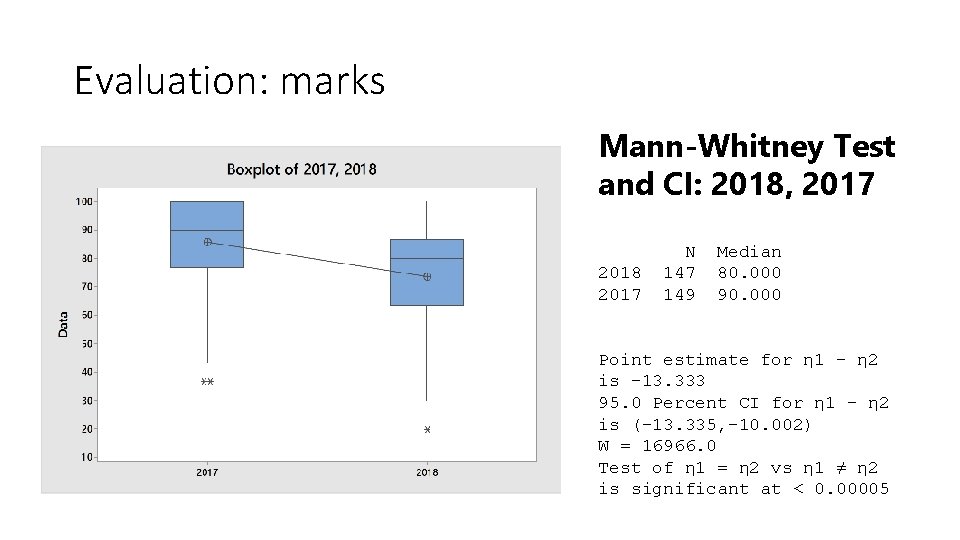
Evaluation: marks Mann-Whitney Test and CI: 2018, 2017 2018 2017 N 147 149 Median 80. 000 90. 000 Point estimate for η 1 - η 2 is -13. 333 95. 0 Percent CI for η 1 - η 2 is (-13. 335, -10. 002) W = 16966. 0 Test of η 1 = η 2 vs η 1 ≠ η 2 is significant at < 0. 00005
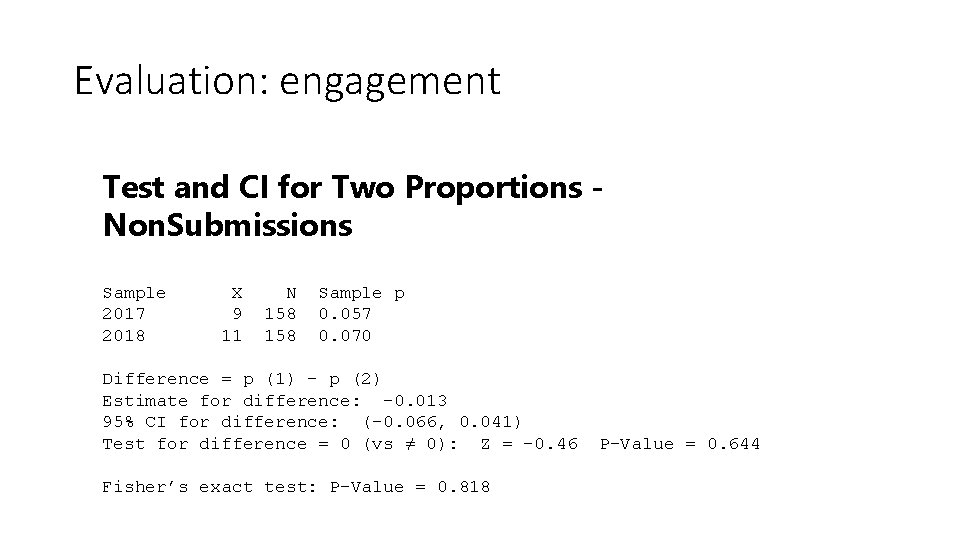
Evaluation: engagement Test and CI for Two Proportions Non. Submissions Sample 2017 2018 X 9 11 N 158 Sample p 0. 057 0. 070 Difference = p (1) - p (2) Estimate for difference: -0. 013 95% CI for difference: (-0. 066, 0. 041) Test for difference = 0 (vs ≠ 0): Z = -0. 46 Fisher’s exact test: P-Value = 0. 818 P-Value = 0. 644
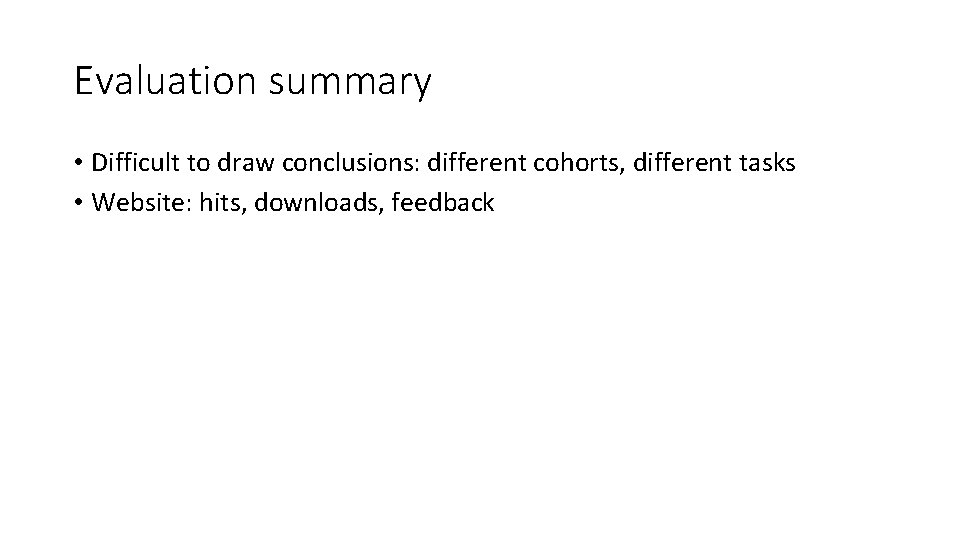
Evaluation summary • Difficult to draw conclusions: different cohorts, different tasks • Website: hits, downloads, feedback