Open Channel Flowmetering A General Overview of Methodology


 Flumes Parshall, Palmer-Bowlus, Leopold-Lagco,")


 Flow = 1. 486 n 5/3 S P 2/3 A 1/2")


 = A")

 • Radar Velocity (MMI)")


 Area Velocity Sensors • Raised Electrodes to reduce grease and debris build")


 • • • Characteristics of flow: solids, tss content? Temperature")
")


 options. If flowmeter has a")


- Slides: 70
Open Channel Flowmetering A General Overview of Methodology and Technology Presented by: Winston Tang, M. A. Sc. , P. Eng. President – EST Environmental Technologies Ltd.
Seminar Agenda / Timeline • 8: 00 am – Brief Introductions • • 8: 15 am – Use of Primary Devices • • Flowmeters 8: 45 am – Level Sensing Technologies • • Weirs / Flumes 8: 25 am – Use of Secondary Devices • • Purpose of Open Channel Flowmetering Ultrasonic Transducers, Submerged Pressure, Bubblers 9: 00 am – Flow Monitoring Accuracy • • Manning’s Equation Area Velocity Flow Measurement » The Continuity Equation (Q=V x A) » Reference & Direct Average Velocity » Radar Velocity & Latest Technologies
Seminar Agenda / Timeline • 9: 30 am - Choosing Open Channel Flow Measurement Systems • • • Portable vs. Permanent Stations Single vs. Multiple Sites Continuous vs. Temporary Measurement Maintenance Requirements Site Selection / Installation Considerations • 10 am – 10: 20 am: Coffee Break • 10: 40 am – Data Acquisition • • On Site Data collection, direct, RF Communications Remote Data Collection SCADA / PLC Web Based Monitoring • 11: 00 am – Flow Metering Questionnaire • 11: 15 am – 11: 30 am Conclusion / Q & A / Group Discussion
EST Environmental Product Lines “Working to Improve Water Quality for the World. . ”
• • Open Channel vs. Closed Pipe Open Channel Flow: gravity flow of liquid, includes rivers, ditches, canals, flumes, sewers and tunnels, flowing partially full and generally not under pressure. Also includes measurement of wastewater, industrial and process water combined with groundwater, surface water and storm water • Closed Pipe Flow: Pressurized flow in closed conduit. • This presentation will focus on Open Channel Flow most commonly found in municipal applications and wastewater treatment plants.
Purpose of Open Channel Flow Monitoring • • Quantification of flows for design and analysis Billing of end users (custody transfer) Process Control, Site Calibration. Plant Influent / Effluent Determining Inflow & Infiltration (I/I), CSO’s Meeting environmental regulations and guidelines Protection of property and environmental habitat
Basics of Open Channel Flow Measurement Primary Devices Can be used with a Secondary Device Area Velocity Many Available Technologies
Use of Primary Devices Primary Device Key features: • Man made • Calibrated • Hydraulic structure with an engineered restriction • Known depth-to-flow (or level to flow) relationship • Flow rate can be determined from single measurement of the level. • Geometric relationship between depth and rate of flow
Basic Categories of Primary Devices Weirs V-Notch, Rectangular, Trapezoidal (Cipolletti) Flumes Parshall, Palmer-Bowlus, Leopold-Lagco, H-Flumes
Primary Devices: Weirs: Basically dam like structures that liquid flows over. General Advantages: Easier to use and less expensive than flumes. How they work: • Rate of flow over a weir directly related to hydraulic head. • Install level sensor at a distance 4 x the maximum expected head. Cautions: accuracy can be affected by varying approach velocities Weirs can act as mini-dams and raise the upstream liquid levels so should be installed carefully by considering site conditions by experienced operators / suppliers, instrument techs or flow service providers. May require more maintenance as debris can builds up behind a weir.
Sample Weir Layout Configuration Diagram Reference: Control Electronics
Many Weirs, Many Configurations
Primary Devices: Flumes: man-made structures that force water through a narrow channel. General Advantages: Increased flow velocity gives flumes a self cleaning effect. How they work: Level-to-flow relationship is created: • By increasing velocity in the upstream section the level of the liquid is converged through the throat of the flume is changed, before the level decreases in the diverging section. • Flow is proportional to the depth of water in the flume and calculated easily by measuring the head upstream of the throat section of the flume. Cautions: accuracy can be affected by improper leveling (side to side and front and back) installation requires more expertise, typically more expensive than weirs.
Parshall Flume Configuration • Used in industrial, municipal sewer applications, sewage treatment plants. • Self-cleaning, and can operate over a wide flow range with good accuracy. • Size selection is determined by throat width, prefabricated fiberglass. • Most common flume, around since 1920’s. • More expensive than weirs or Palmer-Bowlus Flumes to install – permanent. Diagram Reference: Control Electronics
Palmer-Bowlus Flume Layout Diagram Reference: Control Electronics Designed for easier installation into an existing circular pipe with suitable slope (at least 2% typically). Size of flume determined by pipe size (ie. 8” pipe= 8” Palmer-Bowlus) Lower flow rate range, more sensitive to turbulence, and less measurement resolution. Installation should have a long straight-run section leading into flume (25 pipe diameters), flume should be installed level.
Many Flumes, Many Options
Secondary Devices: Flowmeters • Secondary Device: a flow meter that measures the liquid level of a primary device and converts it to an accurate flow rate. • Most flowmeters of this type use embedded / computer generated tables for instantaneous flow rate calculations based on proven math equations. • Output of flow rates to recorders, totalizers, SCADA systems, web-based wireless, or download to PC for historical / instantaneous flow data. • Often flowmeters trigger other devices like portable samplers, or actuate devices dependent on flow rate.
Level Sensing Technologies Most popular technologies are: • Ultrasonic Transducers • Submerged Pressure Transducers • Bubblers • Floats • Conductive Sensors
Quick Overview of Level Technologies Ultrasonic • Acoustic pulses transmitted to liquid surface and reflected back to a receiver. • Level is determined by measuring time lapse between pulse travel, proportional to distance. • Temperature compensation to adjust for acoustic pulse differences through air.
Submerged Pressure Transducers • Works by differential pressure and is placed in the flow stream to measure level. • Pressure over transducer is proportional to liquid level and changes with liquid level. • Converts level reading to flow rate.
Bubblers • Tubing is installed at a known depth. • Internal air pump pushes small volume of pressurized air through tubing to measurement point. • Pressure required to push air changes in proportion to liquid level. • Flowmeter converts level to flow.
Floats Measures liquid level with measurement graduated tape or beaded cable, counterweights and a pulley. Float moves the cable up or down to rotate the pulley (ie. Used in Rivers, flumes, etc) Conductivity Changing level cause change in an electrical circuit to indicate liquid level
Flow Monitoring Accuracy Two Basic Approaches Manning Equation Area Velocity Method
Manning’s Equation • Used originally as a rough estimate for flow. • Alternative to installing a primary device • Discharge tables were developed based on pipe diameter, level, slope and roughness coefficent. Published in engineering tables. • Accuracy between 10 – 30%. • Ideal for quick estimations (ie. Stormwater applications)
Manning Equation (Overview) Flow = 1. 486 n 5/3 S P 2/3 A 1/2 Where Flow = Flow Rate A = Cross Sectional Area P = Perimeter n = roughness coefficient S = slope (change in height over change in distance)
Area Velocity Method • Hydraulic structures are not always available or appropriate, and cannot be used to measure full-pipe, surcharge, or reverse flows. • The area velocity (AV) method, however, can accurately determine the flow rate in these and other conditions — including free-flow and backwater conditions — without a weir or a flume.
Area Velocity • This technique measures the cross-sectional area of the flow stream at a certain point as well as the average velocity of the flow in that cross section. • Area velocity flow meters measure flow by multiplying the area of the flow by its average velocity— a calculation known as the continuity equation:
Area Velocity • The Continuity Equation • • Where Q=the flow rate, A=the cross-sectional area of the flow, and V=the average velocity of the flow stream.
Area Velocity: • Applications – Anywhere flow must be measured Q (flow) = A x V
Area Velocity: • Features – accurate measurement under free flow, surcharged, and reverse flow conditions – eliminates the need for slope and roughness coefficient values – greater accuracy than Manning’s Q (flow) = A x V
Open Channel Velocity Methods • Continuous Wave Doppler (Sigma) • Radar Velocity (MMI)
Continuous Wave Doppler Velocity • Submerged Doppler velocity probes transmit a high frequency sound wave into the flow. This wave is reflected by entrained gases and/or suspended solids back to the probe. The changes or shifts in frequency reflect the spectrum velocity vectors throughout the cross-section area of the flow. Algorithms determine the peak velocity signal returned.
Continuous Wave Doppler Velocity Particles in Flow Stream FLOW Doppler Velocity Sensor
Continuous Wave Doppler Velocity Bernoulli Drawdown correction
Electromagnetic (EM) Area Velocity Sensors • Raised Electrodes to reduce grease and debris build up (designed as a non-fouling electrode) • Pressure transducer used to measure depth of the water (thin diaphragm converts pressure to an electronic signal) • Cross channel allows water pressure to reach transducer while protecting the diaphragm. Applications: Municipal Sewers, Storm Water, All Purpose Sensor, Cleaner water discharges with few particles
Electromagnetic Sensors Faraday’s Law of Electromagnetic Induction: • As water is a conductor, water moving through a magnetic field produces a voltage. • Magnitude of the voltage is directly proportional to the velocity of the water. • The open channel sensor generates an electromagnetic field, creating voltage in the water. • Two velocity electrodes along with the ground button measure this voltage. • The faster water velocity produces higher voltage. • By measuring this voltage, the velocity is determined.
Continuous Wave Doppler Velocity • Specific Applications – Monitor Infiltration and Inflow – Billing – Chemical Loading – Overflow Reporting – Government Requirement – Material Handling – System Capacity Analysis – Stormwater
Continuous Wave Doppler Velocity • Features/Benefits – Easy installation – Factory calibrated to reduce onsite calibration
Radar Doppler Velocity • A high frequency sound wave is transmited onto the surface of the flow stream. The Doppler shift of the return signal is measured and the average velocity is calculated using a correlation factor.
Radar Doppler Velocity
Non Contact Velocity and Level Measurement Using a combined radar and ultrasonic sensor
Radar Doppler Velocity
Surface Doppler Velocity • Specific Applications – Monitor Infiltration and Inflow – Billing – Chemical Loading – Overflow Reporting – Government Requirement – Material Handling – System Capacity Analysis – Stormwater
Multiple Sensor Technology – Non-Contact View Flash Demonstration
Surface Doppler Velocity • Features/Benefits – NON-CONTACT • Reduced maintenance – High velocity – No profile necessary – Clean data
Other Available Technologies • ADFM – Velocity Profiling, pulse doppler to measure velocity distribution in the flow (ISCO) • Quad Redundant Ultrasonic Sensor – Multiple crystals to generate individual depth readings (ADS) • Many other technologies exist, rapidly evolving field. Conclusion: There is a flowmeter technology suitable for each application. Selection of flowmeter depends on required measurement accuracy and site conditions.
How to Select the Flowmeter for your Application?
“Teaching you how to Fish for your Flowmeter”
Choosing Open Channel Flow Measurement Systems • • • Site Selection / Installation Considerations Portable vs. Permanent Stations Single vs. Multiple Site measurement Continuous vs. Temporary Measurement Maintenance Requirements
Flow Application Questionnaire • Type of application? Accuracy required? • How will meter be deployed? • Partially filled, surcharge conditions, existing primary device? • Shape of pipe? • Retrieval of data? • Power availability, or portable?
Flow Meter Questionnaire (cont’d) • • • Characteristics of flow: solids, tss content? Temperature limits / operating / ambient Approximate flow conditions Rapid changes to flow rate? Special site conditions, existing equipment? Lengths of straight run, pipe bends upstream, disturbances caused by structures? • Preferred technology? • Sketch, diagram, photos or site visits, valuable info.
Data Acquisition How do I retrieve my flowmeter data? • On-site data collection (manual) • Data logger (battery powered or otherwise) • RF communications / Telemetry • SCADA / PLC • Remote Access Devices / Add on Peripherals • Web Based Monitoring / Wireless
On-Site Data Collection • Use of a PC and communications cable typically. Manual download and programming of flowmeter Data Logger • Battery powered external data logger may be used to record 4 -20 m. A outputs or otherwise if unit does not have internal memory
RF Communications • Also known as “line of sight” downloading. • Typically has a range of up to 100 ft to download data without opening manhole lid. • Requires receiver and transceiver • Eliminates manhole entries / confined space • Eliminates traffic control & adverse weather • Reduced maintenance requirements
RF Data Communications Sample
SCADA / PLC SCADA or Programmable Logic Conroller (PLC) options. If flowmeter has a 4 -20 m. A output option or other communications protocol (HART, Fieldbus, LAN, otherwise), retrieving data can be fast, continuous and easy. Infrastructure considerations, initial costs.
Popular Peripheral Devices for Remote Access Capability Telog Instruments allows connections to a wide variety of popular flowmeter brands for remote access wirelessly
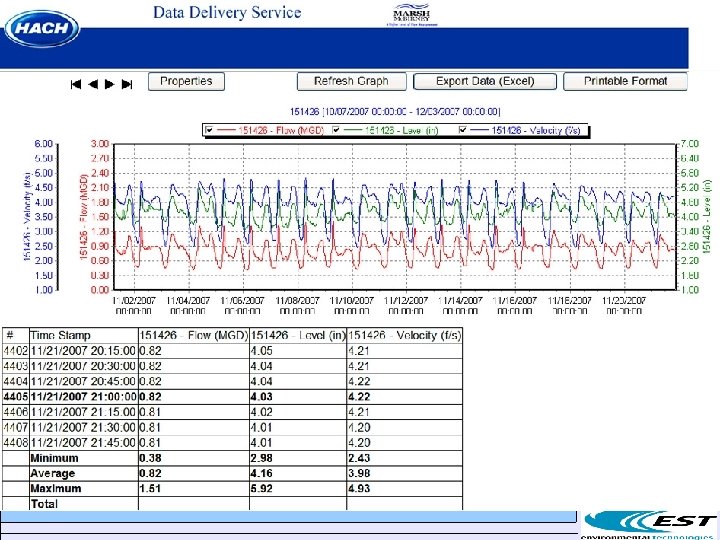
Web Based Communications Popular Regional Examples: • Hach DDS – Data Delivery Service • KWL’s Emerald System • SFE Online – Flow Service Providers … Many other providers in the future….
Data Delivery Services
Data Delivery Services
Flow Data Hydrographs, Tabular Data, 24/7 Secure Browser Access
Scatter Plots Quick Analytical Tool
Event Notification to Client Staff via: PDA E-mail Mobile Phone Pager Flexible Notification Schemes
24/7 Access • Flow Data Accessible “Anytime, Anywhere”
KWL’s Advanced Emerald System
SFE Online – Wireless Data Acquistion
Summary, Conclusions, Q&A • General Overview of Flow Metering Approaches & Technologies Only. • Technologies are always evolving and getting better • Selection of appropriate technology for your application depends on your needs and requirements. • There is a wide range of available technologies and compare technologies but also consider the maintenance requirements and product support.
Open Channel Flowmetering An Overview of Applications & Technology Happy Fishing for your Flowmeter! Enjoy the Process! Presented by: Winston Tang, M. A. Sc. , P. Eng. President – EST Environmental Technologies Ltd.
EST Environmental Product Lines “Working to Improve Water Quality for the World. . ”