
OpAmp Noise Calculation and Measurement Art Kay Senior

- Slides: 105
Op-Amp Noise Calculation and Measurement Art Kay Senior Applications Engineer Texas Instruments Inc – Tucson kay_art@ti. com 1
Noise Presentation Contents • • • Review of white noise and 1/f noise Noise Hand Calculations Tina Spice Noise Analysis Noise Measurement Appendix 1 – Measurement Example Appendix 2 – Analysis Details 2
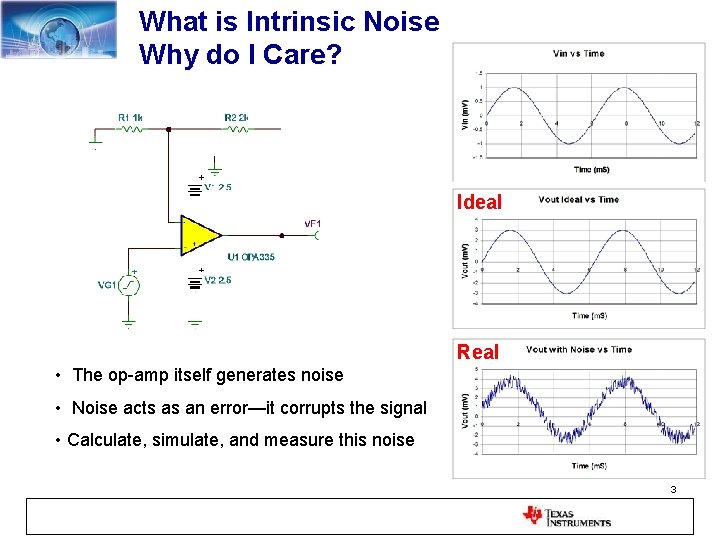
What is Intrinsic Noise Why do I Care? Ideal Real • The op-amp itself generates noise • Noise acts as an error—it corrupts the signal • Calculate, simulate, and measure this noise 3
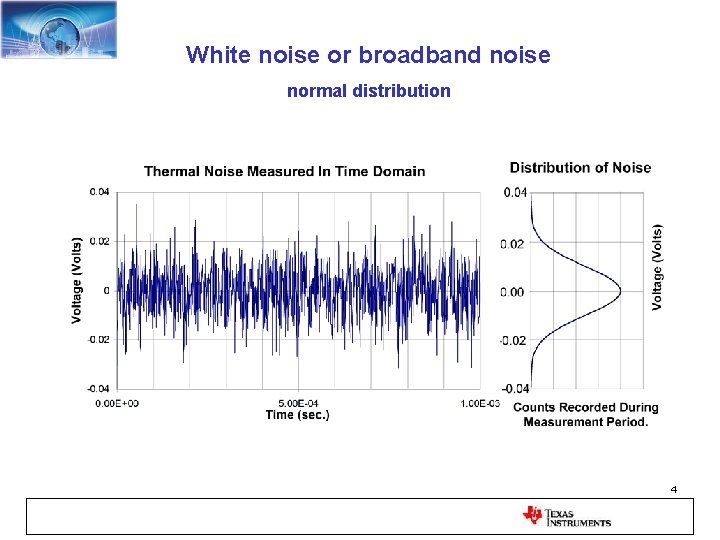
White noise or broadband noise normal distribution 4
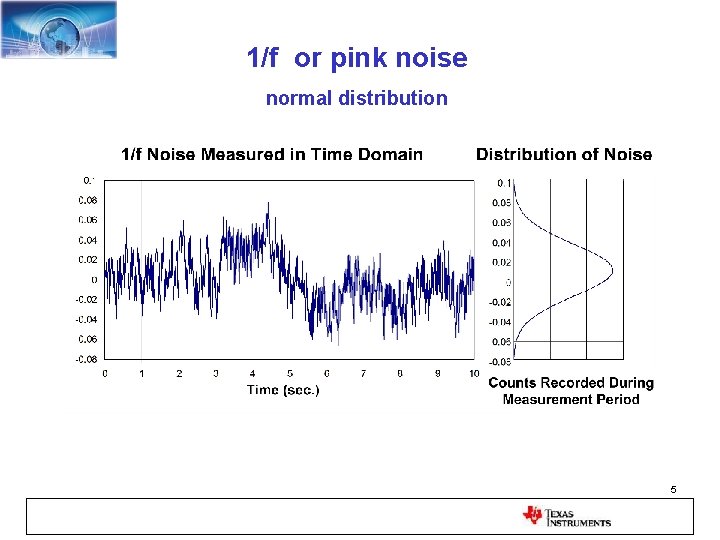
1/f or pink noise normal distribution 5
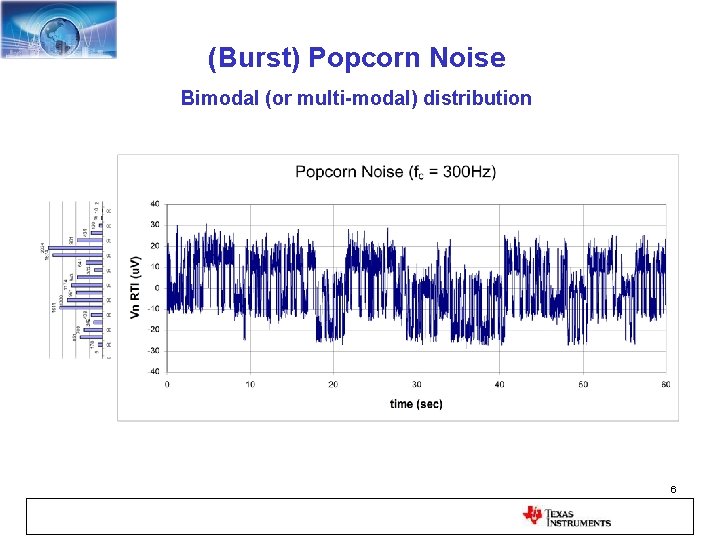
(Burst) Popcorn Noise Bimodal (or multi-modal) distribution 6
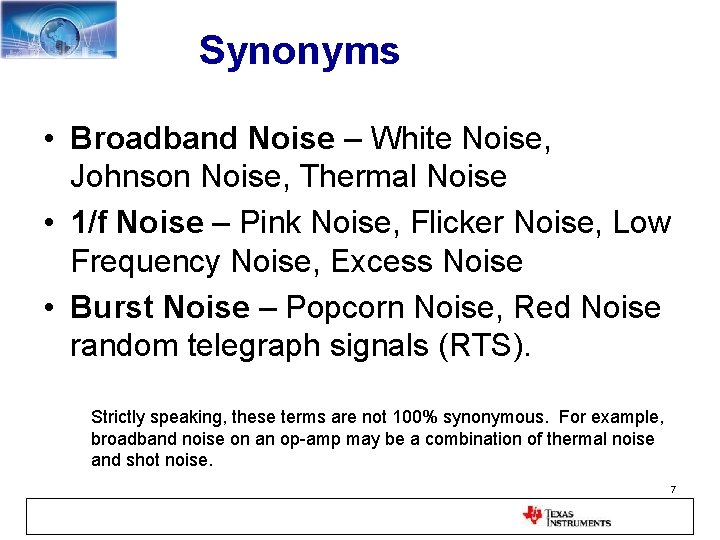
Synonyms • Broadband Noise – White Noise, Johnson Noise, Thermal Noise • 1/f Noise – Pink Noise, Flicker Noise, Low Frequency Noise, Excess Noise • Burst Noise – Popcorn Noise, Red Noise random telegraph signals (RTS). Strictly speaking, these terms are not 100% synonymous. For example, broadband noise on an op-amp may be a combination of thermal noise and shot noise. 7
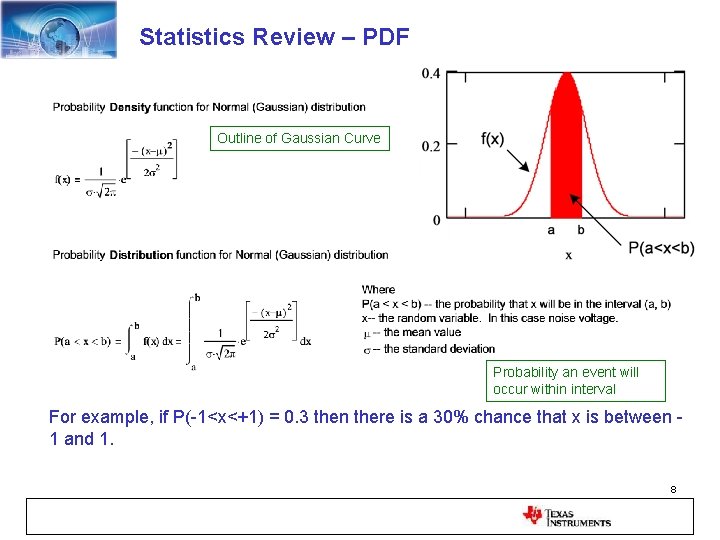
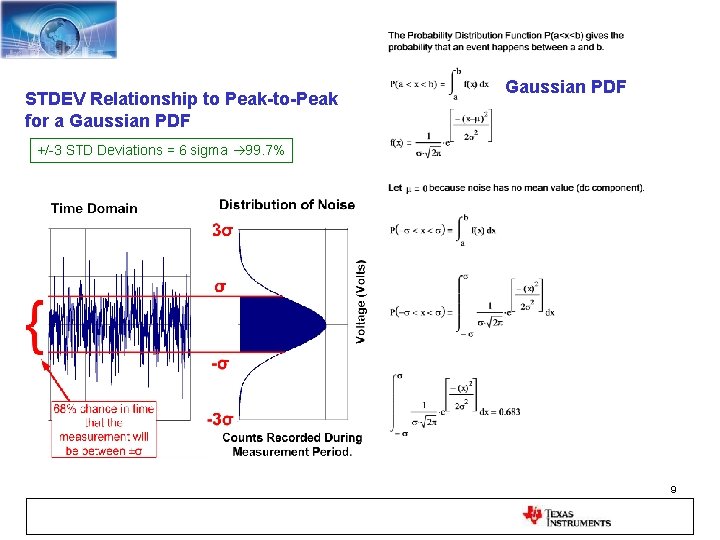
Statistics Review – PDF Outline of Gaussian Curve Probability an event will occur within interval For example, if P(-1<x<+1) = 0. 3 then there is a 30% chance that x is between 1 and 1. 8
STDEV Relationship to Peak-to-Peak for a Gaussian PDF +/-3 STD Deviations = 6 sigma 99. 7% 9
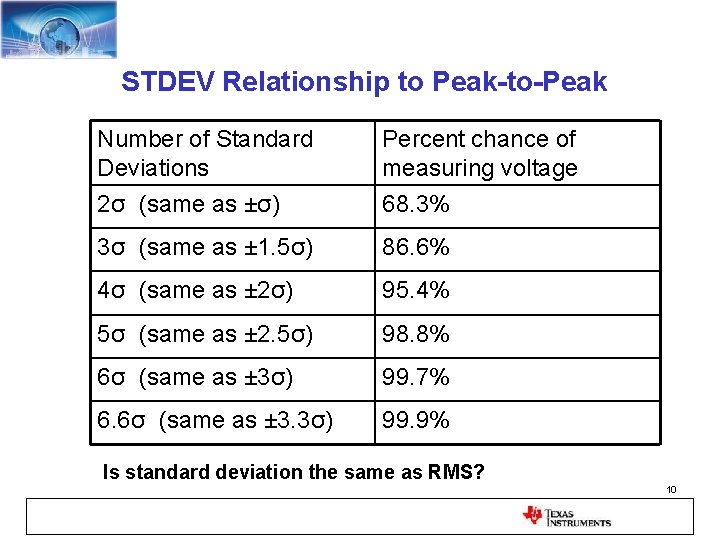
STDEV Relationship to Peak-to-Peak Number of Standard Deviations 2σ (same as ±σ) Percent chance of measuring voltage 68. 3% 3σ (same as ± 1. 5σ) 86. 6% 4σ (same as ± 2σ) 95. 4% 5σ (same as ± 2. 5σ) 98. 8% 6σ (same as ± 3σ) 99. 7% 6. 6σ (same as ± 3. 3σ) 99. 9% Is standard deviation the same as RMS? 10
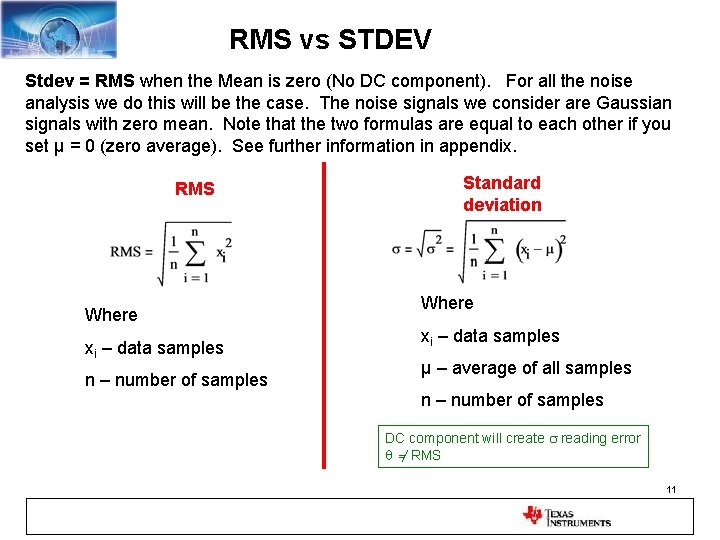
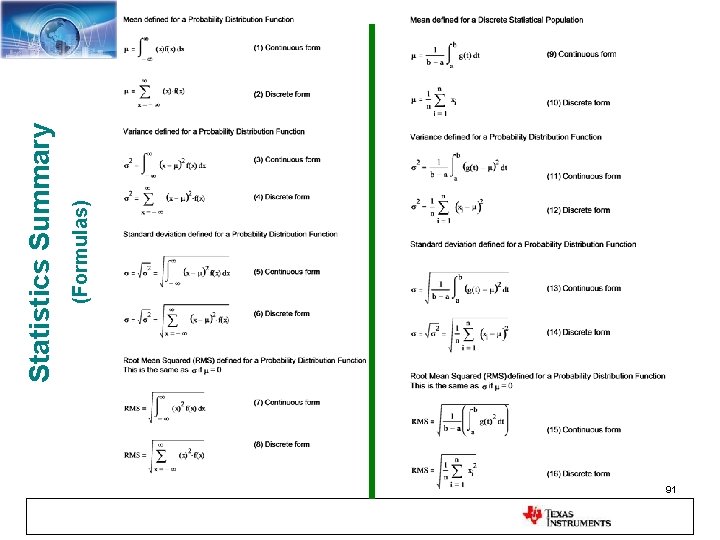
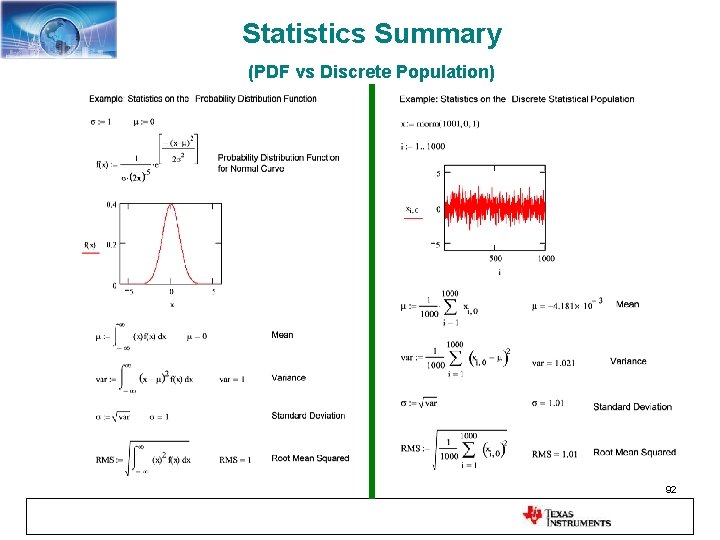
RMS vs STDEV Stdev = RMS when the Mean is zero (No DC component). For all the noise analysis we do this will be the case. The noise signals we consider are Gaussian signals with zero mean. Note that the two formulas are equal to each other if you set μ = 0 (zero average). See further information in appendix. RMS Where xi – data samples n – number of samples Standard deviation Where xi – data samples μ – average of all samples n – number of samples DC component will create s reading error q = RMS 11
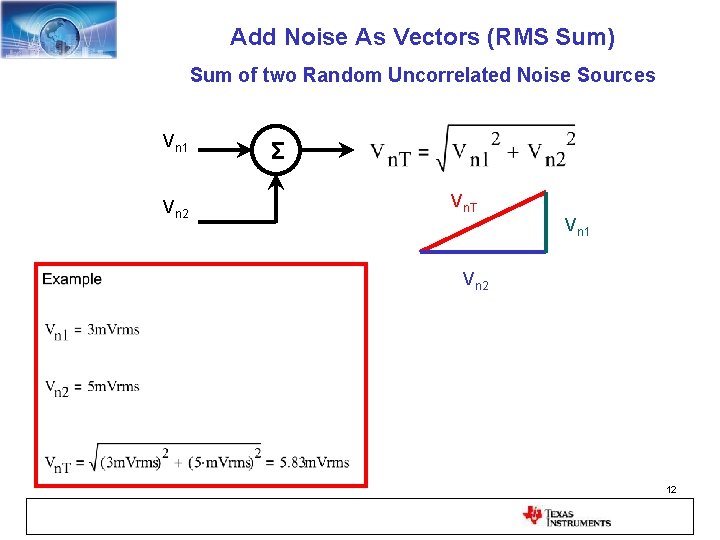
Add Noise As Vectors (RMS Sum) Sum of two Random Uncorrelated Noise Sources Vn 1 Vn 2 Σ Vn. T Vn 1 Vn 2 12
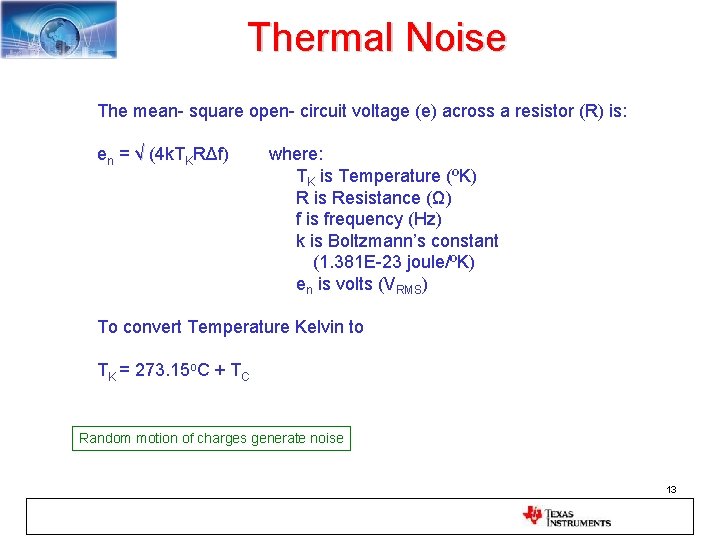
Thermal Noise The mean- square open- circuit voltage (e) across a resistor (R) is: en = √ (4 k. TKRΔf) where: TK is Temperature (ºK) R is Resistance (Ω) f is frequency (Hz) k is Boltzmann’s constant (1. 381 E-23 joule/ºK) en is volts (VRMS) To convert Temperature Kelvin to TK = 273. 15 o. C + TC Random motion of charges generate noise 13
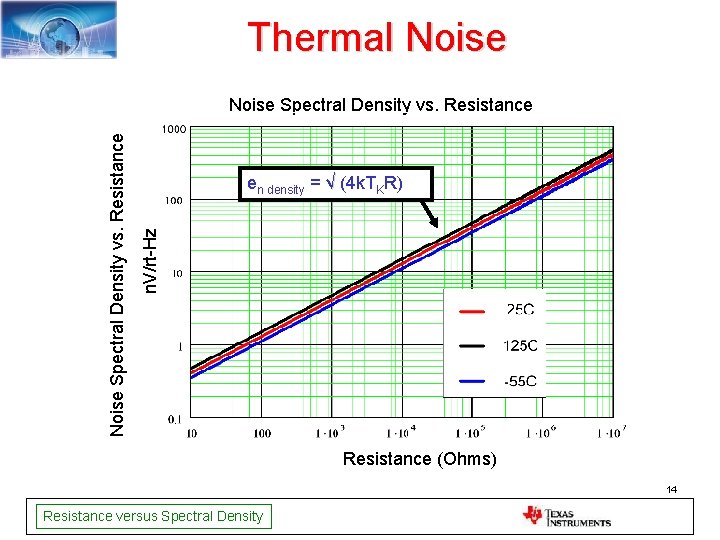
Thermal Noise en density = √ (4 k. TKR) n. V/rt-Hz Noise Spectral Density vs. Resistance (Ohms) 14 Resistance versus Spectral Density
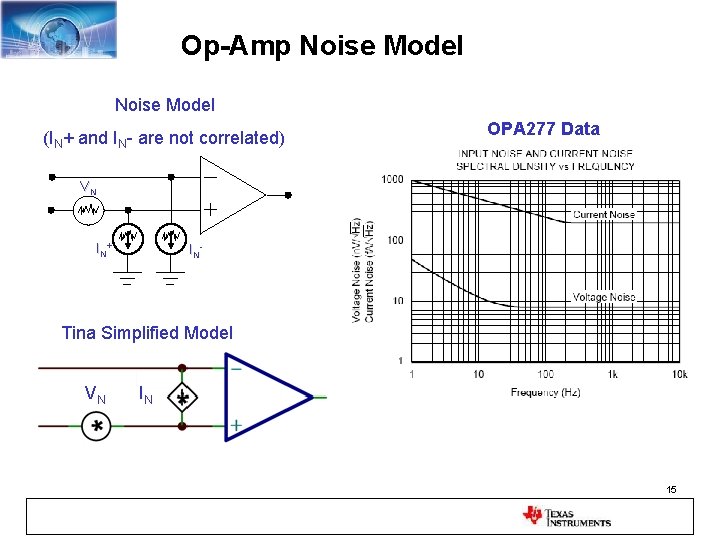
Op-Amp Noise Model (IN+ and IN- are not correlated) OPA 277 Data VN IN+ IN- Tina Simplified Model VN IN 15
16
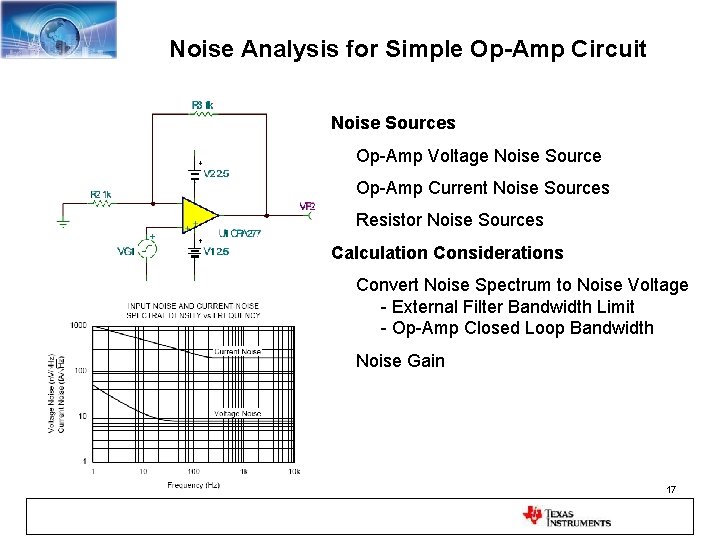
Noise Analysis for Simple Op-Amp Circuit Noise Sources Op-Amp Voltage Noise Source Op-Amp Current Noise Sources Resistor Noise Sources Calculation Considerations Convert Noise Spectrum to Noise Voltage - External Filter Bandwidth Limit - Op-Amp Closed Loop Bandwidth Noise Gain 17
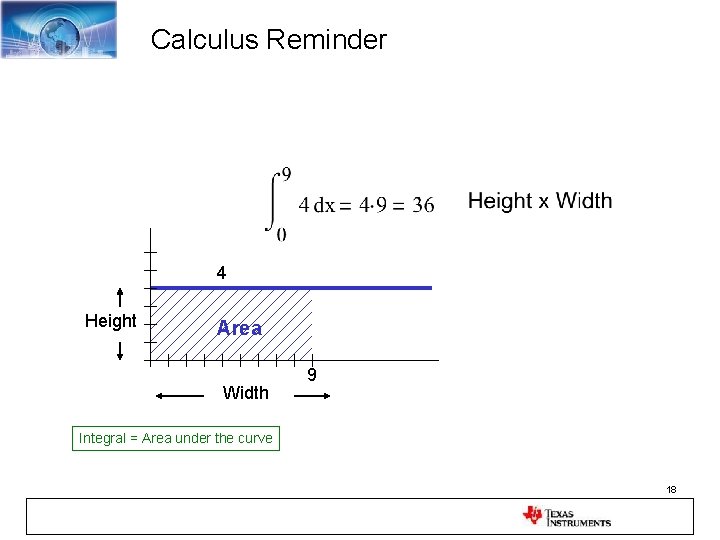
Calculus Reminder 4 Height Area Width 9 Integral = Area under the curve 18
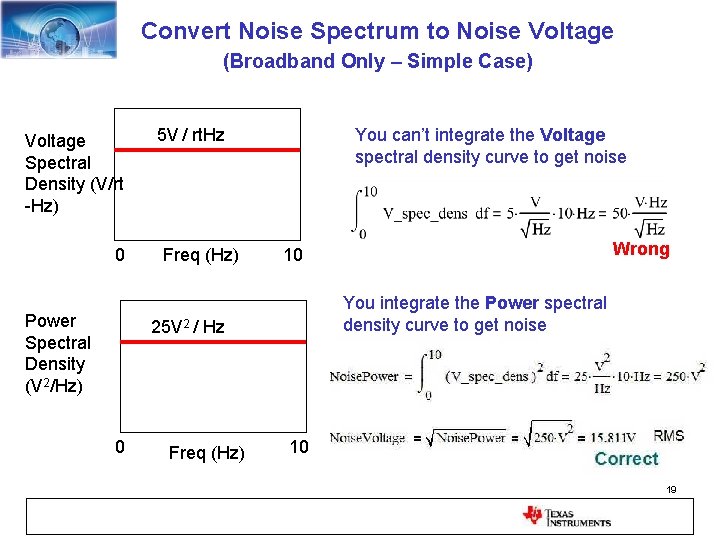
Convert Noise Spectrum to Noise Voltage (Broadband Only – Simple Case) Voltage Spectral Density (V/rt -Hz) 0 Power Spectral Density (V 2/Hz) 5 V / rt. Hz Freq (Hz) You can’t integrate the Voltage spectral density curve to get noise You integrate the Power spectral density curve to get noise 25 V 2 / Hz 0 Freq (Hz) Wrong 10 10 Correct 19
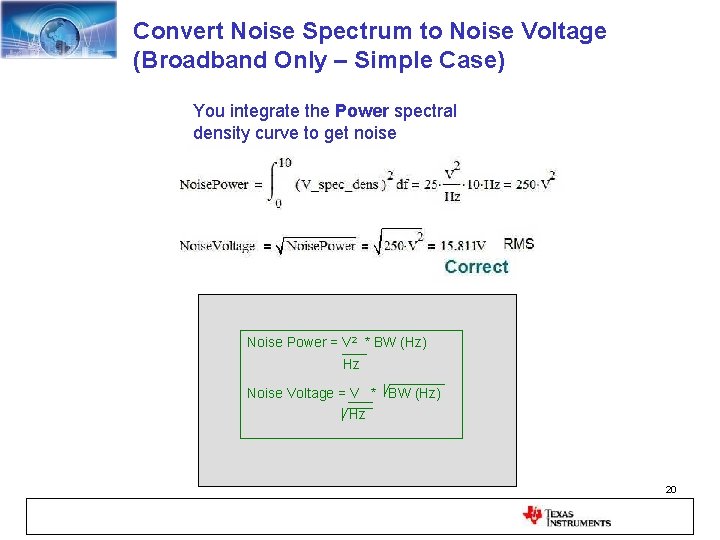
Convert Noise Spectrum to Noise Voltage (Broadband Only – Simple Case) You integrate the Power spectral density curve to get noise Correct Noise Power = V 2 * BW (Hz) Hz Noise Voltage = V * BW (Hz) Hz 20
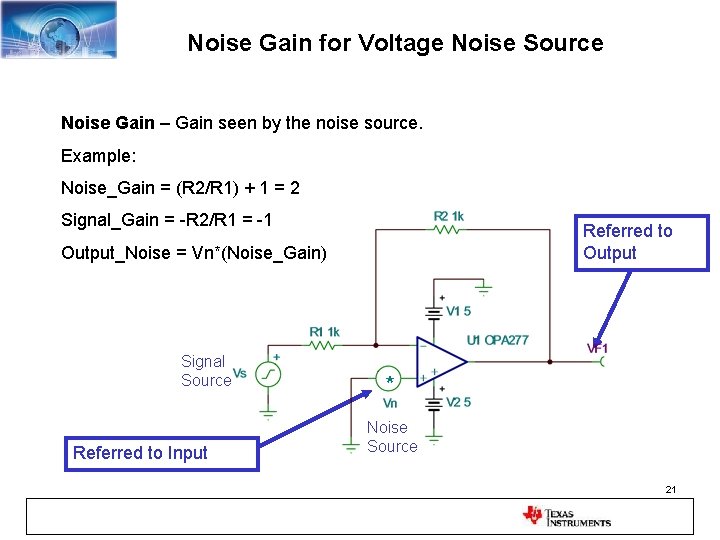
Noise Gain for Voltage Noise Source Noise Gain – Gain seen by the noise source. Example: Noise_Gain = (R 2/R 1) + 1 = 2 Signal_Gain = -R 2/R 1 = -1 Referred to Output_Noise = Vn*(Noise_Gain) Signal Source Referred to Input * Noise Source 21
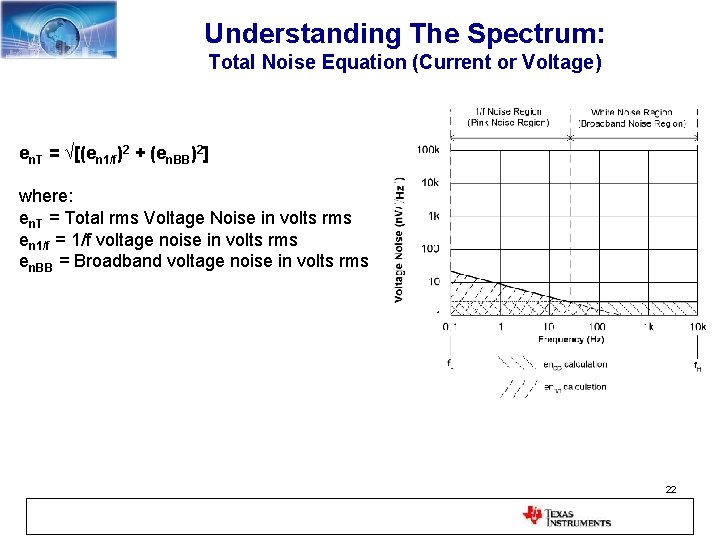
Understanding The Spectrum: Total Noise Equation (Current or Voltage) en. T = √[(en 1/f)2 + (en. BB)2] where: en. T = Total rms Voltage Noise in volts rms en 1/f = 1/f voltage noise in volts rms en. BB = Broadband voltage noise in volts rms 22
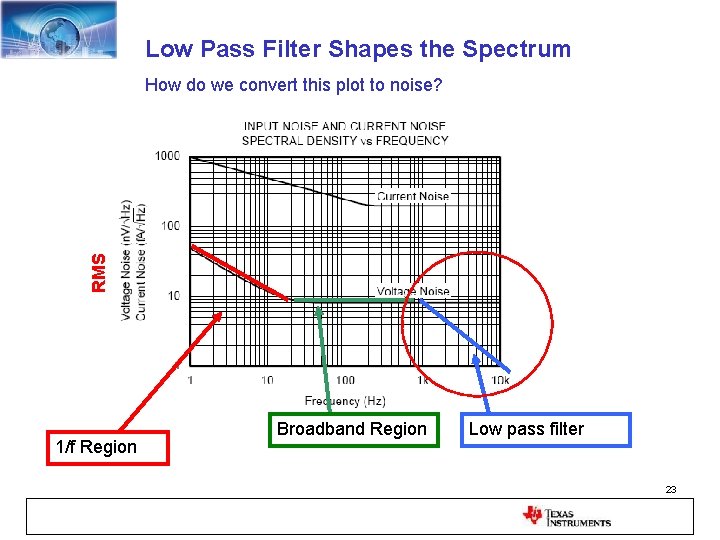
Low Pass Filter Shapes the Spectrum RMS How do we convert this plot to noise? 1/f Region Broadband Region Low pass filter 23
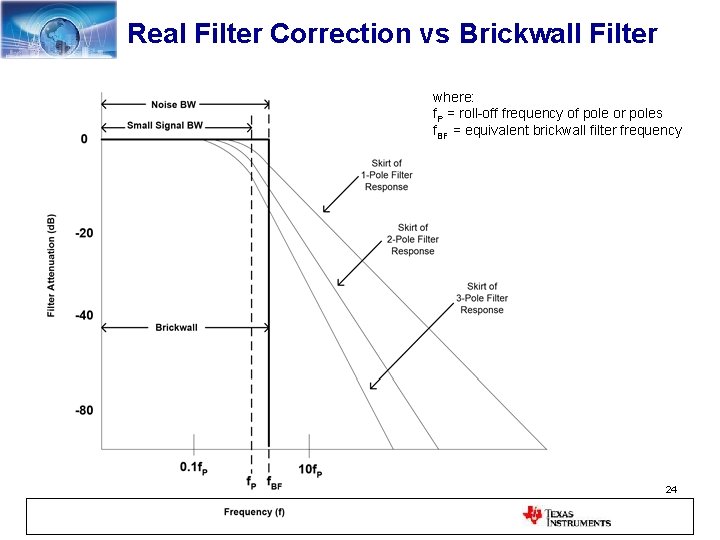
Real Filter Correction vs Brickwall Filter where: f. P = roll-off frequency of pole or poles f. BF = equivalent brickwall filter frequency 24
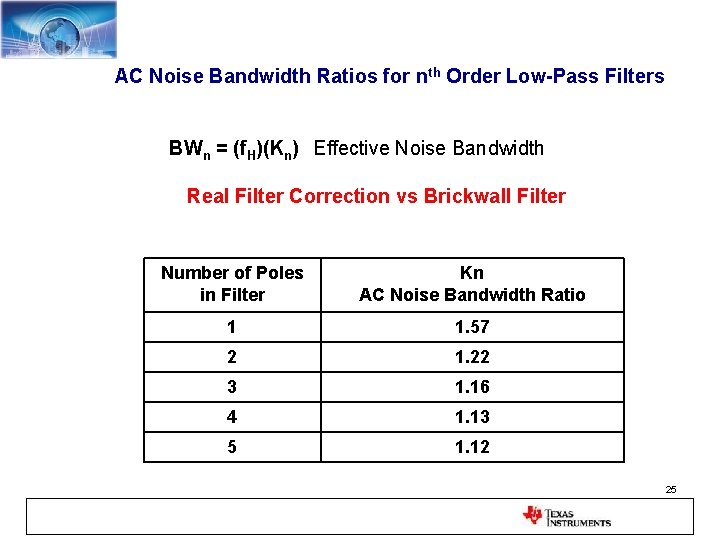
AC Noise Bandwidth Ratios for nth Order Low-Pass Filters BWn = (f. H)(Kn) Effective Noise Bandwidth Real Filter Correction vs Brickwall Filter Number of Poles in Filter Kn AC Noise Bandwidth Ratio 1 1. 57 2 1. 22 3 1. 16 4 1. 13 5 1. 12 25
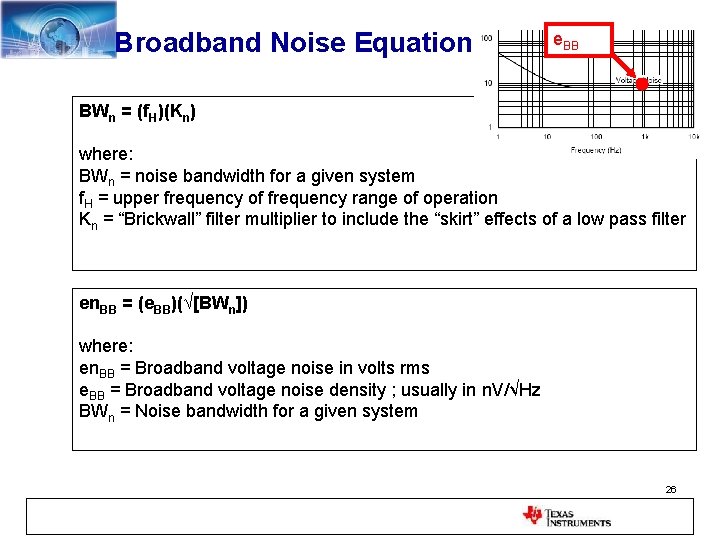
Broadband Noise Equation e. BB BWn = (f. H)(Kn) where: BWn = noise bandwidth for a given system f. H = upper frequency of frequency range of operation Kn = “Brickwall” filter multiplier to include the “skirt” effects of a low pass filter en. BB = (e. BB)(√[BWn]) where: en. BB = Broadband voltage noise in volts rms e. BB = Broadband voltage noise density ; usually in n. V/√Hz BWn = Noise bandwidth for a given system 26
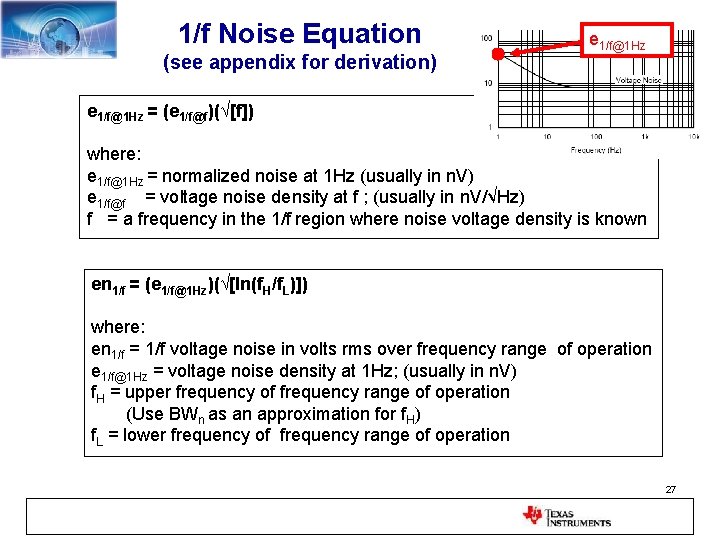
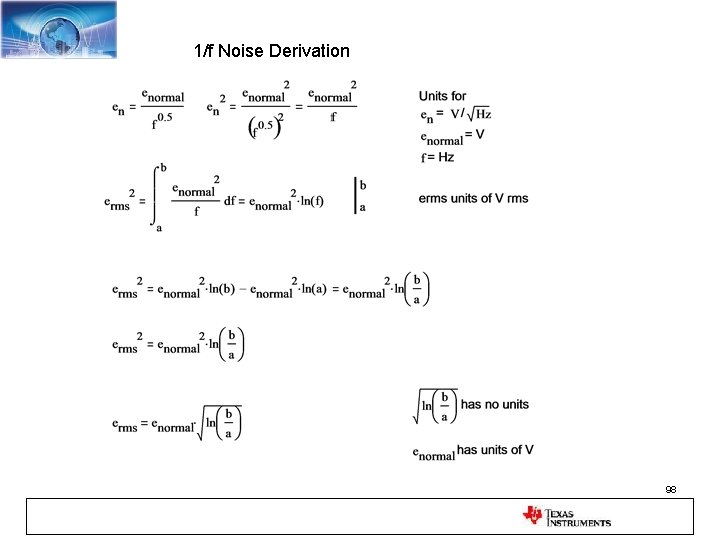
1/f Noise Equation (see appendix for derivation) e 1/f@1 Hz = (e 1/f@f)(√[f]) where: e 1/f@1 Hz = normalized noise at 1 Hz (usually in n. V) e 1/f@f = voltage noise density at f ; (usually in n. V/√Hz) f = a frequency in the 1/f region where noise voltage density is known en 1/f = (e 1/f@1 Hz)(√[ln(f. H/f. L)]) where: en 1/f = 1/f voltage noise in volts rms over frequency range of operation e 1/f@1 Hz = voltage noise density at 1 Hz; (usually in n. V) f. H = upper frequency of frequency range of operation (Use BWn as an approximation for f. H) f. L = lower frequency of frequency range of operation 27
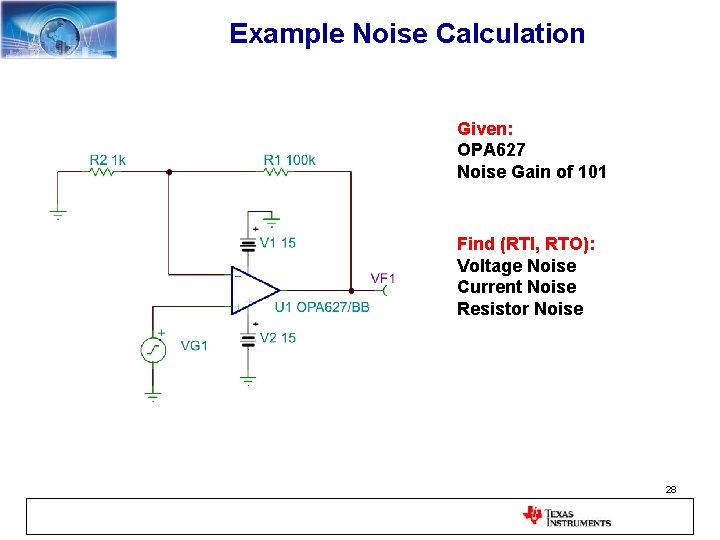
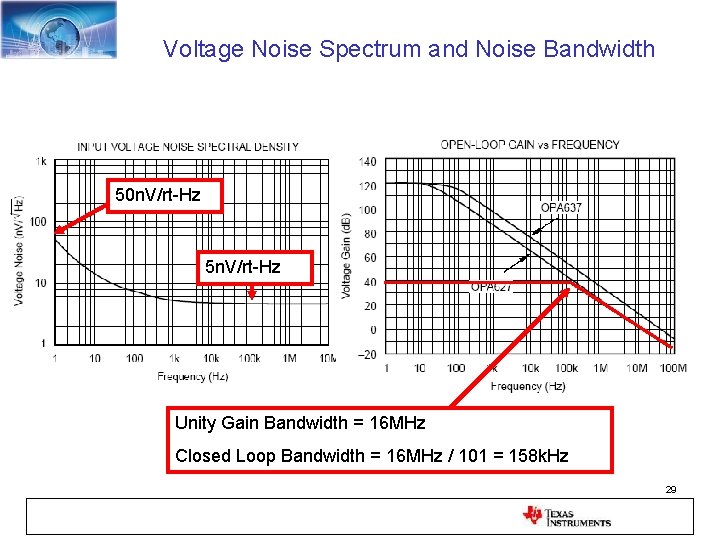
Example Noise Calculation Given: OPA 627 Noise Gain of 101 Find (RTI, RTO): Voltage Noise Current Noise Resistor Noise 28
Voltage Noise Spectrum and Noise Bandwidth 50 n. V/rt-Hz 5 n. V/rt-Hz Unity Gain Bandwidth = 16 MHz Closed Loop Bandwidth = 16 MHz / 101 = 158 k. Hz 29
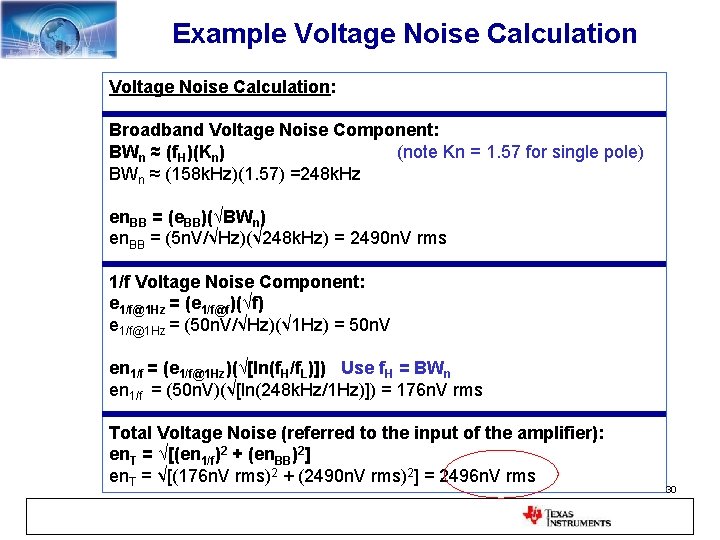
Example Voltage Noise Calculation: Broadband Voltage Noise Component: BWn ≈ (f. H)(Kn) (note Kn = 1. 57 for single pole) BWn ≈ (158 k. Hz)(1. 57) =248 k. Hz en. BB = (e. BB)(√BWn) en. BB = (5 n. V/√Hz)(√ 248 k. Hz) = 2490 n. V rms 1/f Voltage Noise Component: e 1/f@1 Hz = (e 1/f@f)(√f) e 1/f@1 Hz = (50 n. V/√Hz)(√ 1 Hz) = 50 n. V en 1/f = (e 1/f@1 Hz)(√[ln(f. H/f. L)]) Use f. H = BWn en 1/f = (50 n. V)(√[ln(248 k. Hz/1 Hz)]) = 176 n. V rms Total Voltage Noise (referred to the input of the amplifier): en. T = √[(en 1/f)2 + (en. BB)2] en. T = √[(176 n. V rms)2 + (2490 n. V rms)2] = 2496 n. V rms 30
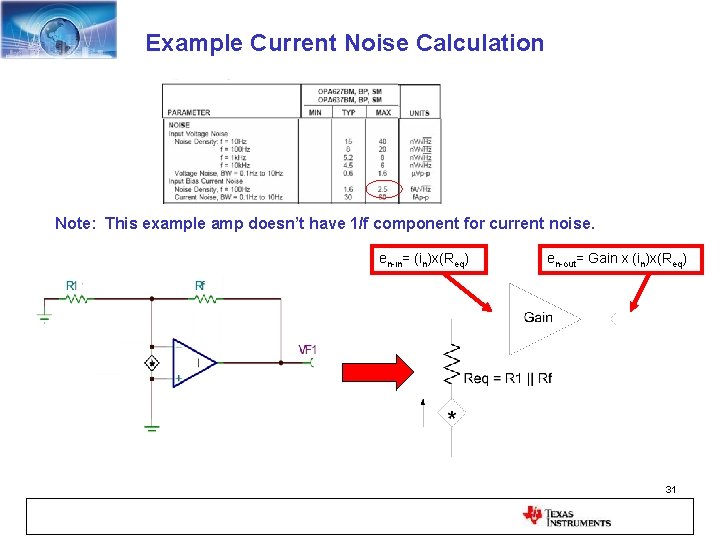
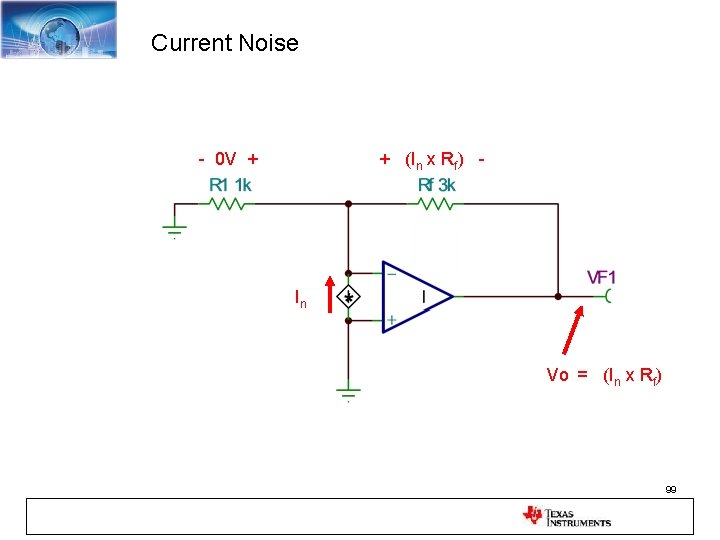
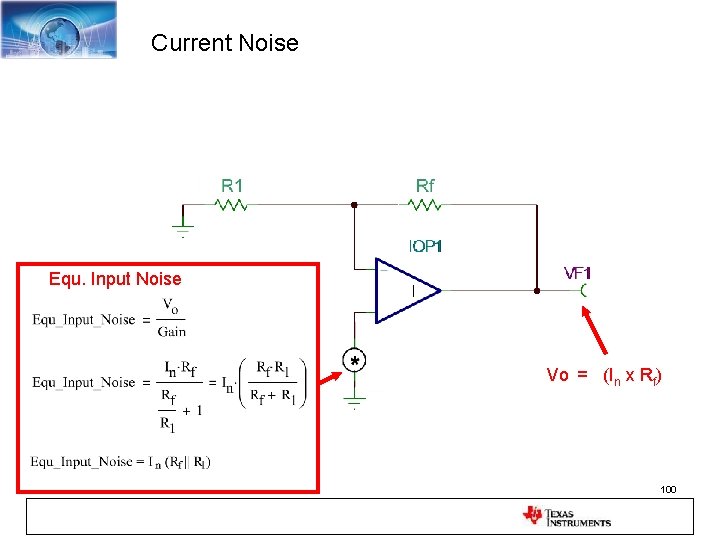
Example Current Noise Calculation Note: This example amp doesn’t have 1/f component for current noise. en-in= (in)x(Req) en-out= Gain x (in)x(Req) 31
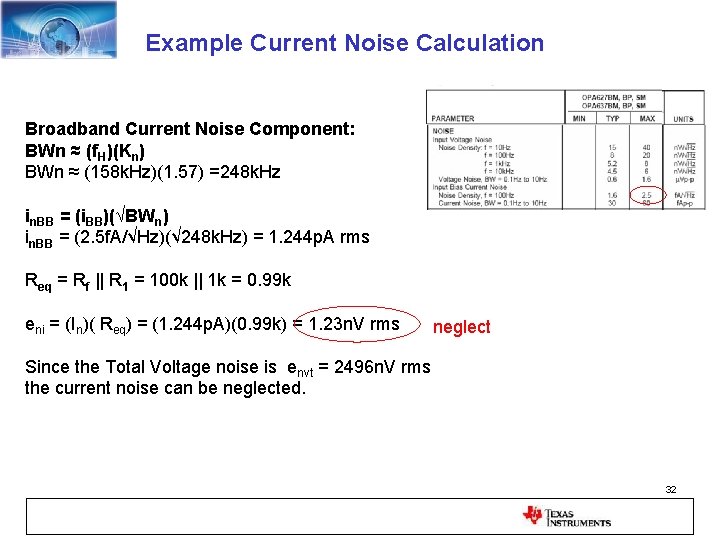
Example Current Noise Calculation Broadband Current Noise Component: BWn ≈ (f. H)(Kn) BWn ≈ (158 k. Hz)(1. 57) =248 k. Hz in. BB = (i. BB)(√BWn) in. BB = (2. 5 f. A/√Hz)(√ 248 k. Hz) = 1. 244 p. A rms Req = Rf || R 1 = 100 k || 1 k = 0. 99 k eni = (In)( Req) = (1. 244 p. A)(0. 99 k) = 1. 23 n. V rms neglect Since the Total Voltage noise is envt = 2496 n. V rms the current noise can be neglected. 32
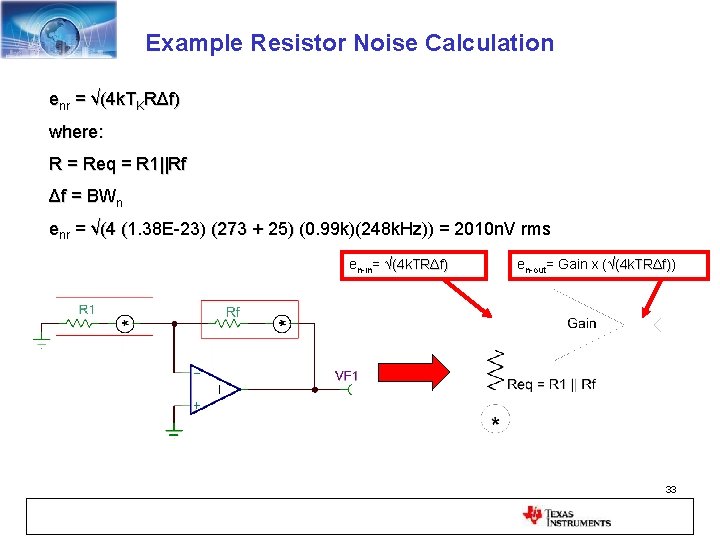
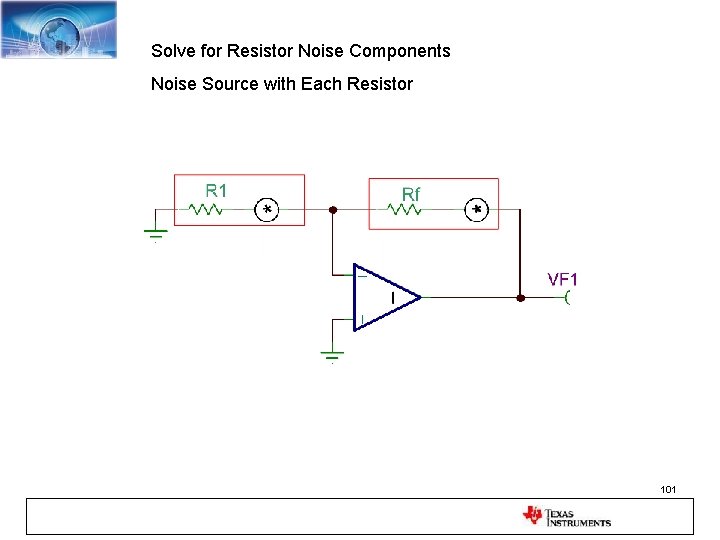
Example Resistor Noise Calculation enr = √(4 k. TKRΔf) where: R = Req = R 1||Rf Δf = BWn enr = √(4 (1. 38 E-23) (273 + 25) (0. 99 k)(248 k. Hz)) = 2010 n. V rms ( (0. 99 k)( en-in= √(4 k. TRΔf) en-out= Gain x (√(4 k. TRΔf)) f) 33
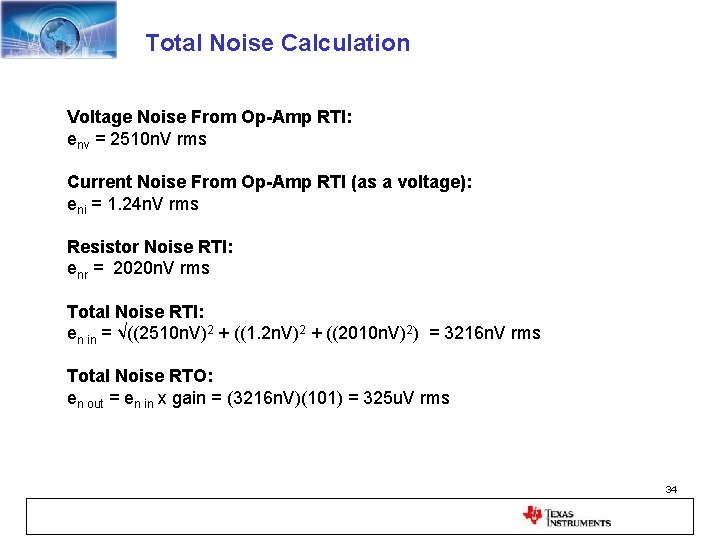
Total Noise Calculation Voltage Noise From Op-Amp RTI: env = 2510 n. V rms Current Noise From Op-Amp RTI (as a voltage): eni = 1. 24 n. V rms Resistor Noise RTI: enr = 2020 n. V rms Total Noise RTI: en in = √((2510 n. V)2 + ((1. 2 n. V)2 + ((2010 n. V)2) = 3216 n. V rms Total Noise RTO: en out = en in x gain = (3216 n. V)(101) = 325 u. V rms 34
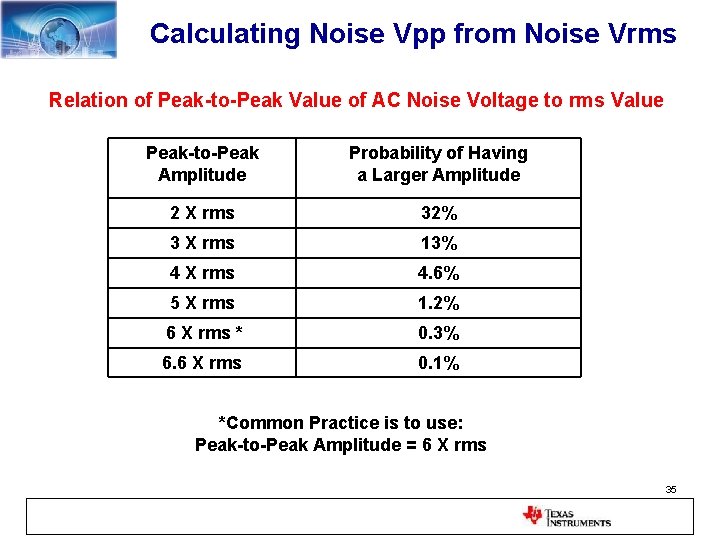
Calculating Noise Vpp from Noise Vrms Relation of Peak-to-Peak Value of AC Noise Voltage to rms Value Peak-to-Peak Amplitude Probability of Having a Larger Amplitude 2 X rms 32% 3 X rms 13% 4 X rms 4. 6% 5 X rms 1. 2% 6 X rms * 0. 3% 6. 6 X rms 0. 1% *Common Practice is to use: Peak-to-Peak Amplitude = 6 X rms 35
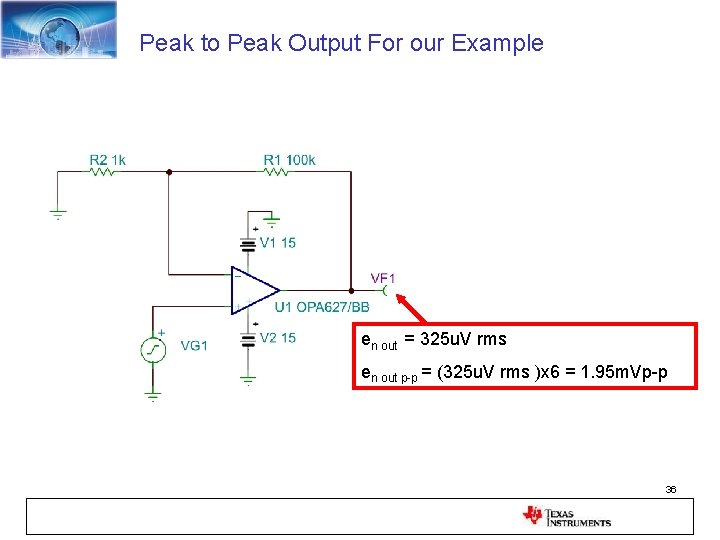
Peak to Peak Output For our Example en out = 325 u. V rms en out p-p = (325 u. V rms )x 6 = 1. 95 m. Vp-p 36
37
Tina Spice – Free simulation software • • DC, AC, Transient, and Noise simulation Includes all Texas Instruments op-amps Unlimited Nodes Does not include some options (e. g. Monte Carlo analysis) • Search for “Tina Spice” on www. ti. com – Download free – Application circuits available 38
Tina Spice Analysis 1. How to Verify that the Tina Model is Accurate 2. How to Build Your Own Model 3. How to Compute Input and Output Noise 39
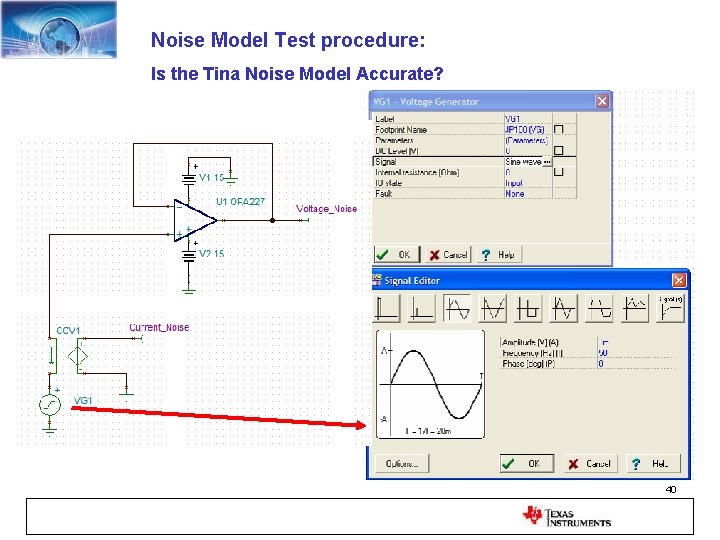
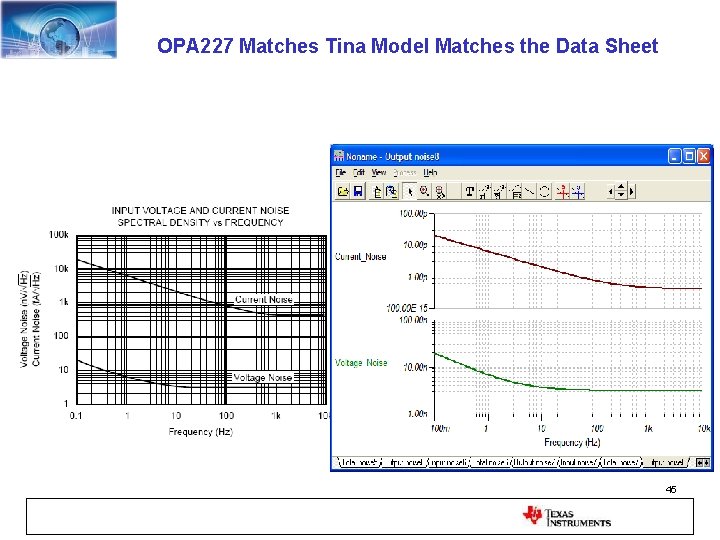
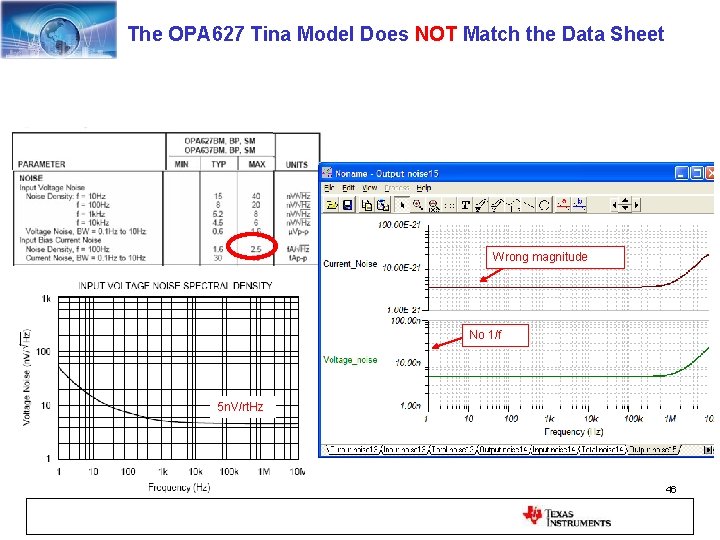
Noise Model Test procedure: Is the Tina Noise Model Accurate? 40
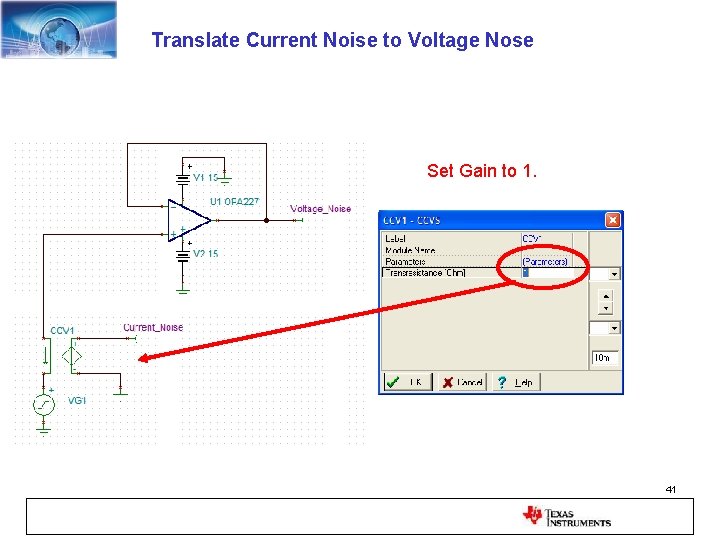
Translate Current Noise to Voltage Nose Set Gain to 1. 41
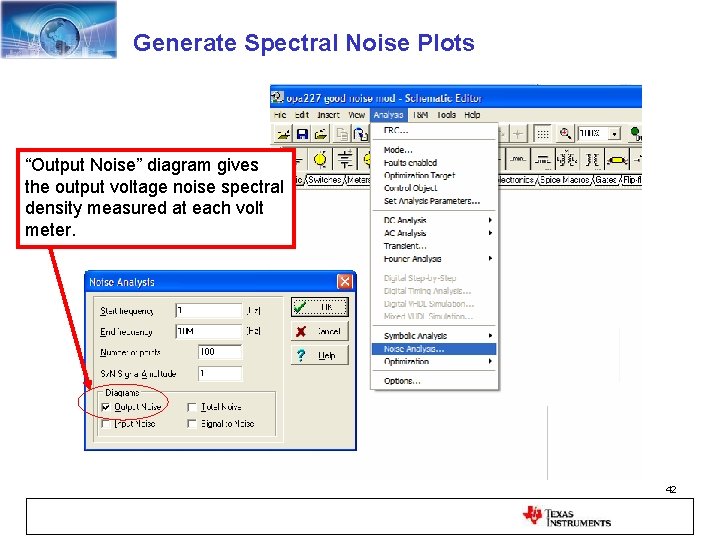
Generate Spectral Noise Plots “Output Noise” diagram gives the output voltage noise spectral density measured at each volt meter. 42
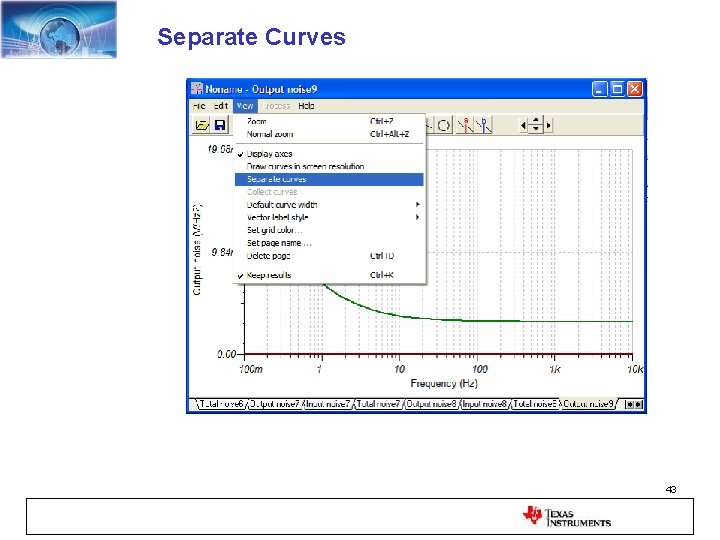
Separate Curves 43
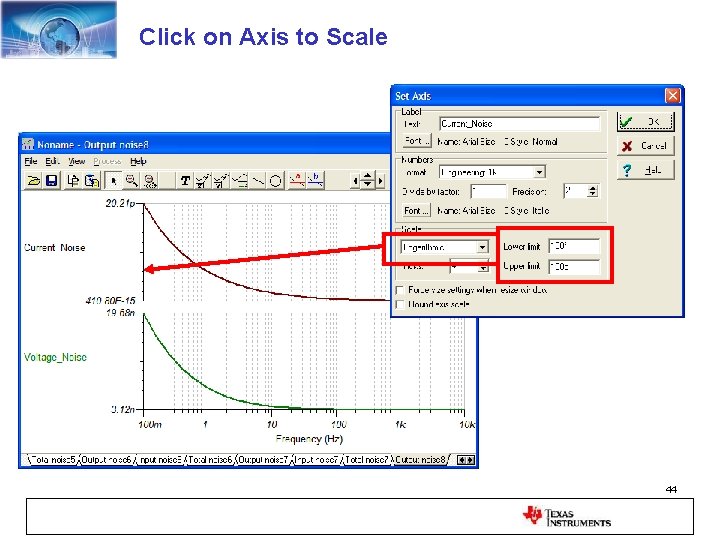
Click on Axis to Scale 44
OPA 227 Matches Tina Model Matches the Data Sheet 45
The OPA 627 Tina Model Does NOT Match the Data Sheet Wrong magnitude No 1/f 5 n. V/rt. Hz 46
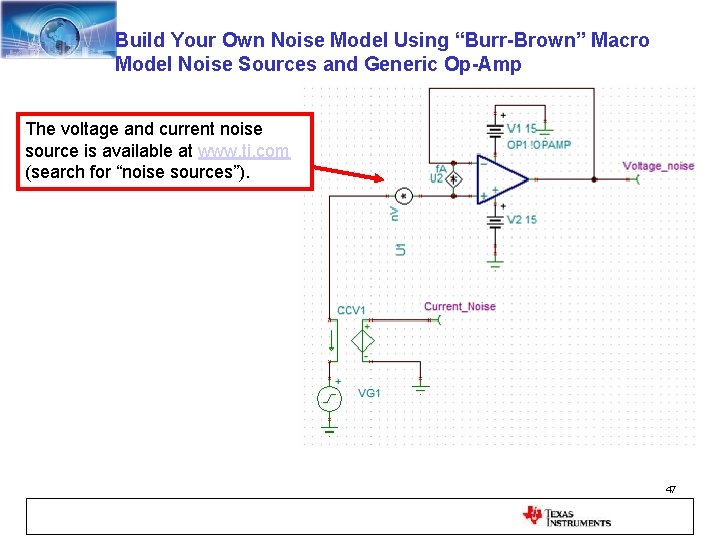
Build Your Own Noise Model Using “Burr-Brown” Macro Model Noise Sources and Generic Op-Amp The voltage and current noise source is available at www. ti. com (search for “noise sources”). 47
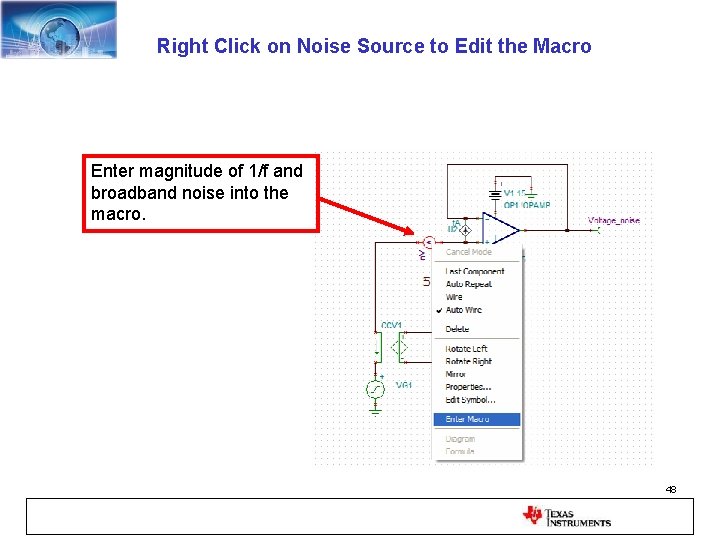
Right Click on Noise Source to Edit the Macro Enter magnitude of 1/f and broadband noise into the macro. 48
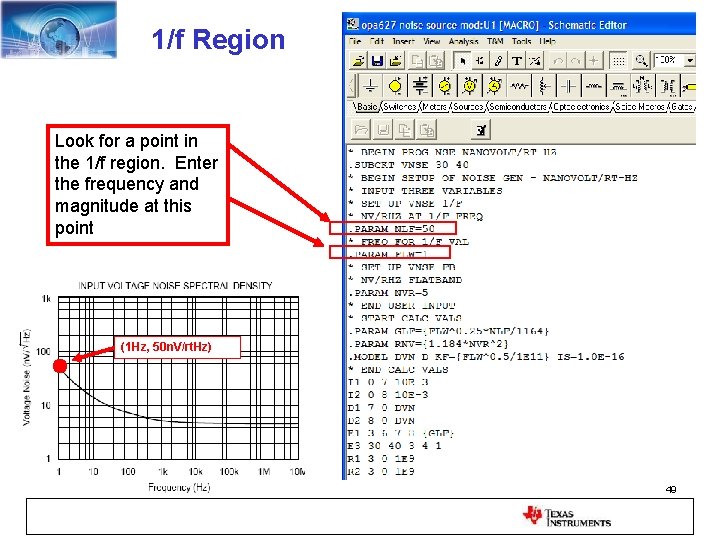
1/f Region Look for a point in the 1/f region. Enter the frequency and magnitude at this point (1 Hz, 50 n. V/rt. Hz) 49
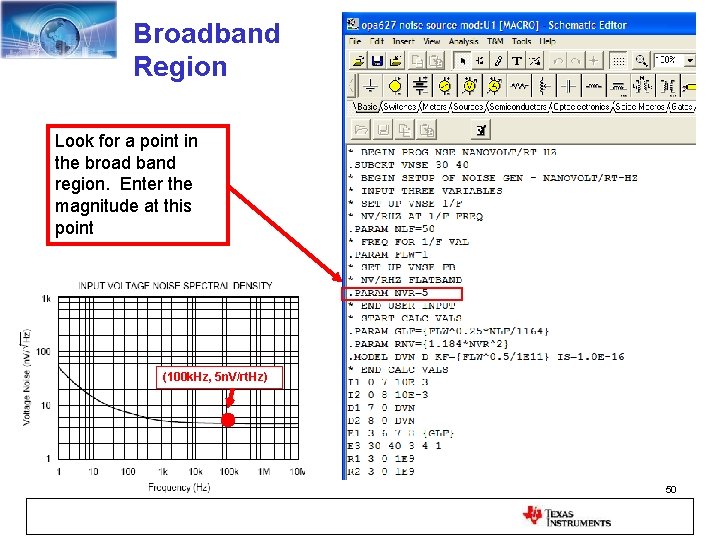
Broadband Region Look for a point in the broad band region. Enter the magnitude at this point (100 k. Hz, 5 n. V/rt. Hz) 50
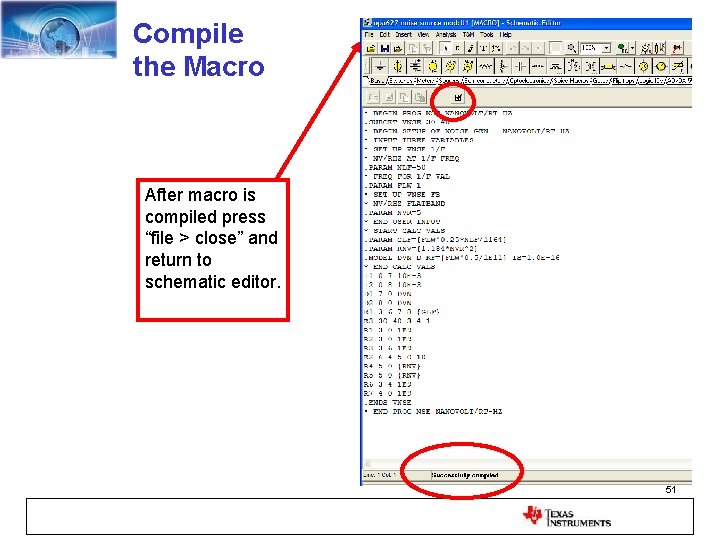
Compile the Macro After macro is compiled press “file > close” and return to schematic editor. 51
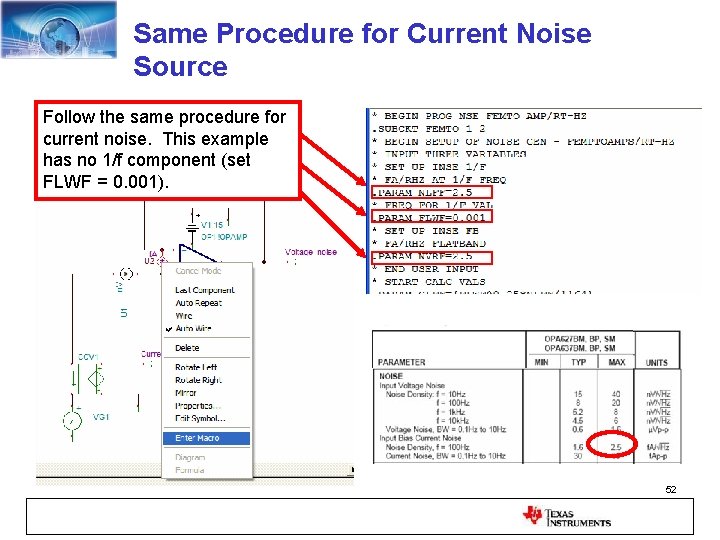
Same Procedure for Current Noise Source Follow the same procedure for current noise. This example has no 1/f component (set FLWF = 0. 001). 52
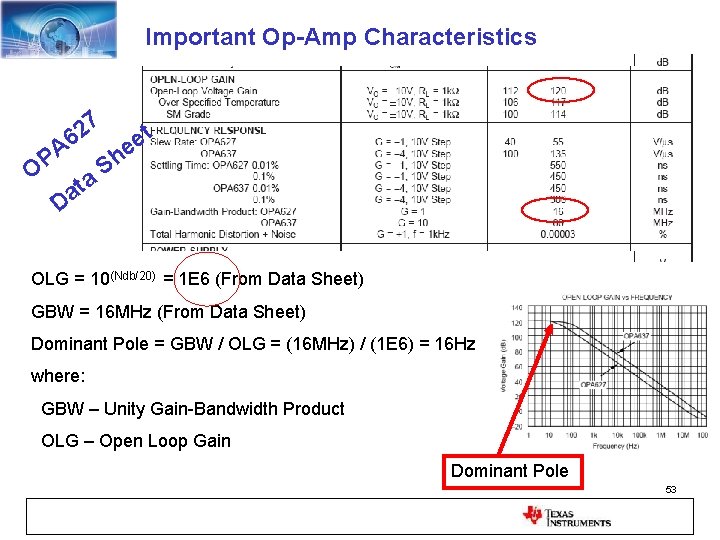
Important Op-Amp Characteristics 7 2 A 6 OP a t a D t e e h S OLG = 10(Ndb/20) = 1 E 6 (From Data Sheet) GBW = 16 MHz (From Data Sheet) Dominant Pole = GBW / OLG = (16 MHz) / (1 E 6) = 16 Hz where: GBW – Unity Gain-Bandwidth Product OLG – Open Loop Gain Dominant Pole 53
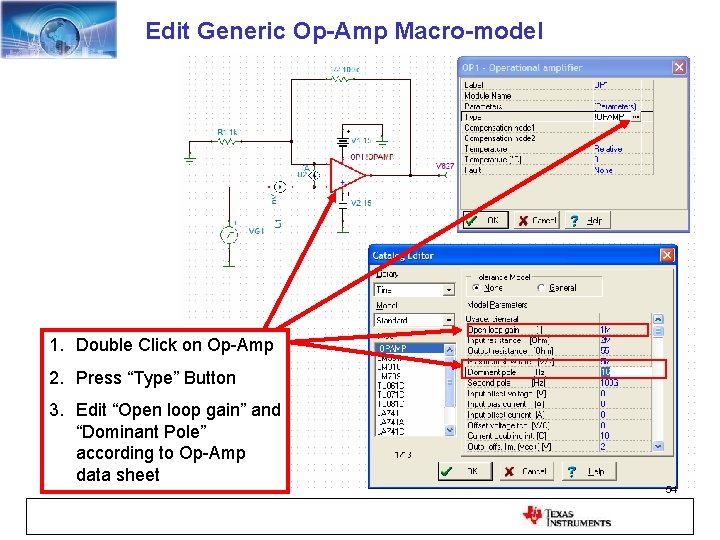
Edit Generic Op-Amp Macro-model 1. Double Click on Op-Amp 2. Press “Type” Button 3. Edit “Open loop gain” and “Dominant Pole” according to Op-Amp data sheet 54
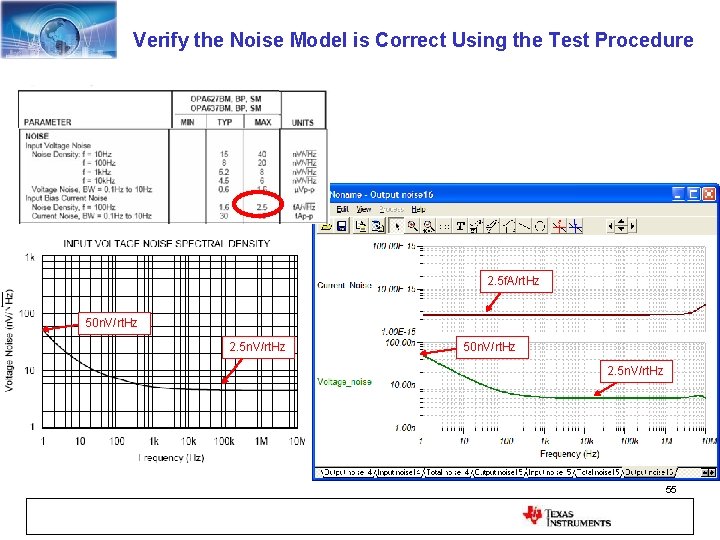
Verify the Noise Model is Correct Using the Test Procedure 2. 5 f. A/rt. Hz 50 n. V/rt. Hz 2. 5 n. V/rt. Hz 55
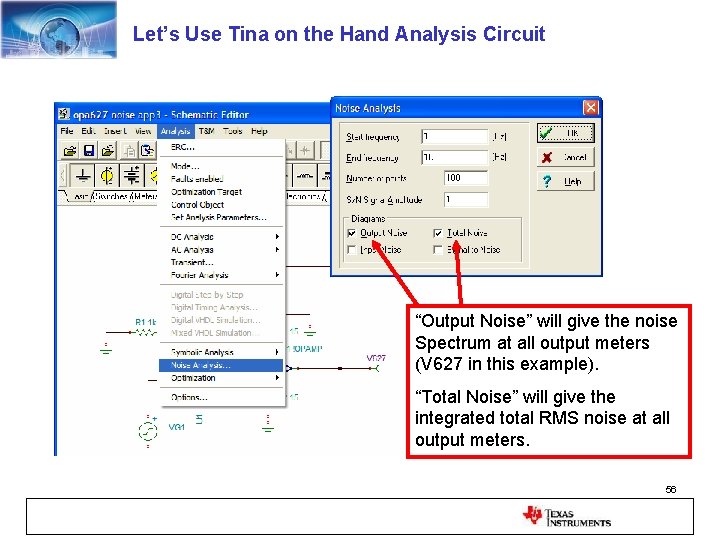
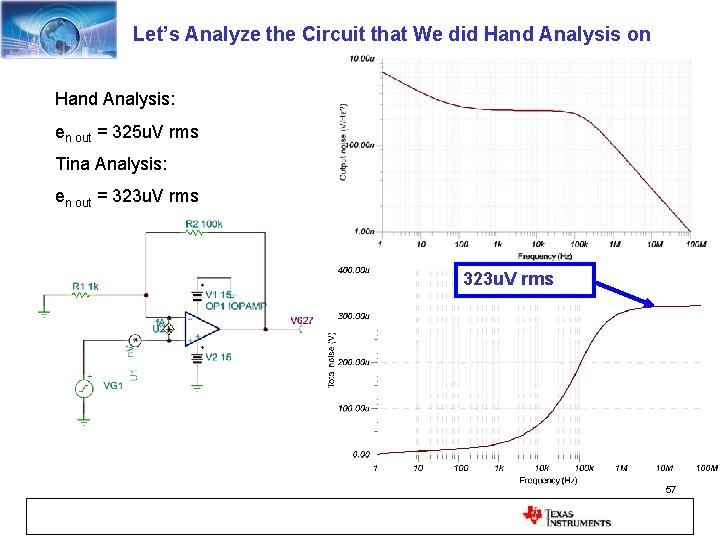
Let’s Use Tina on the Hand Analysis Circuit “Output Noise” will give the noise Spectrum at all output meters (V 627 in this example). “Total Noise” will give the integrated total RMS noise at all output meters. 56
Let’s Analyze the Circuit that We did Hand Analysis on Hand Analysis: en out = 325 u. V rms Tina Analysis: en out = 323 u. V rms 57
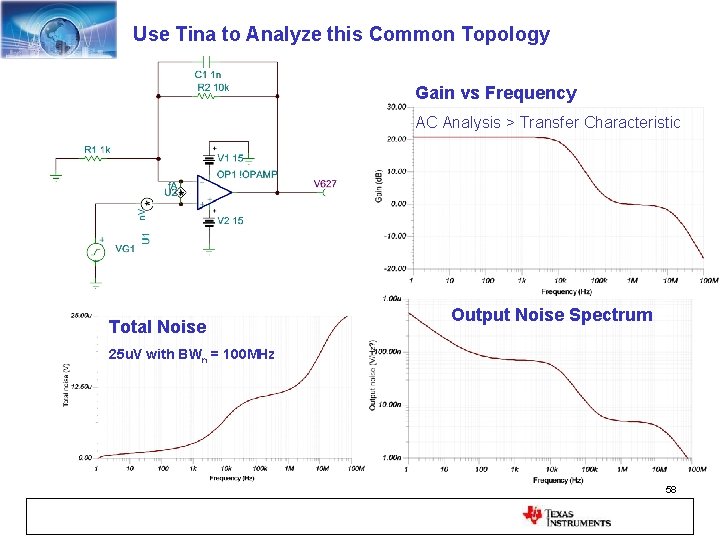
Use Tina to Analyze this Common Topology Gain vs Frequency AC Analysis > Transfer Characteristic Total Noise Output Noise Spectrum 25 u. V with BWn = 100 MHz 58
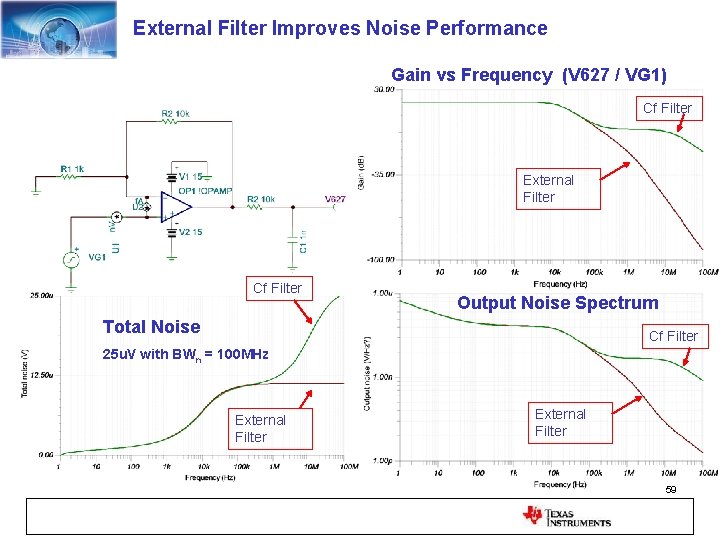
External Filter Improves Noise Performance Gain vs Frequency (V 627 / VG 1) Cf Filter External Filter Cf Filter Output Noise Spectrum Total Noise Cf Filter 25 u. V with BWn = 100 MHz External Filter 59
60
Instruments For Noise Measurements 1. True RMS Meter 2. Oscilloscope 3. Spectrum Analyzer / Signal Analyzer 61
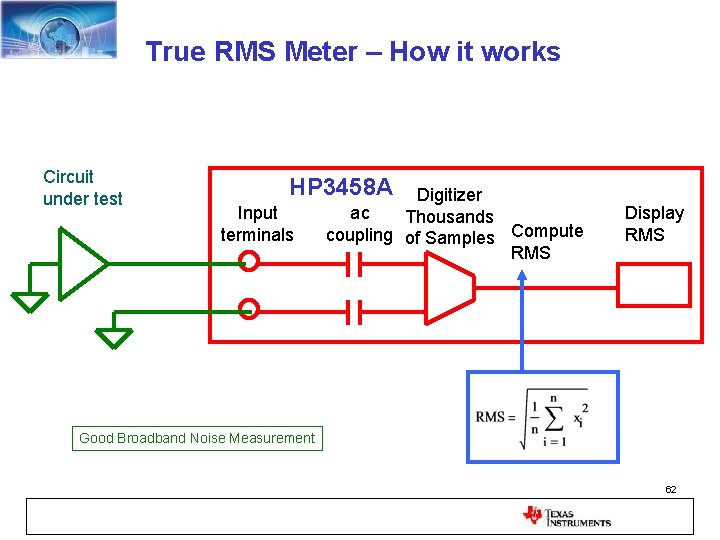
True RMS Meter – How it works Circuit under test HP 3458 A Input terminals Digitizer ac Thousands coupling of Samples Compute RMS Display RMS Good Broadband Noise Measurement 62
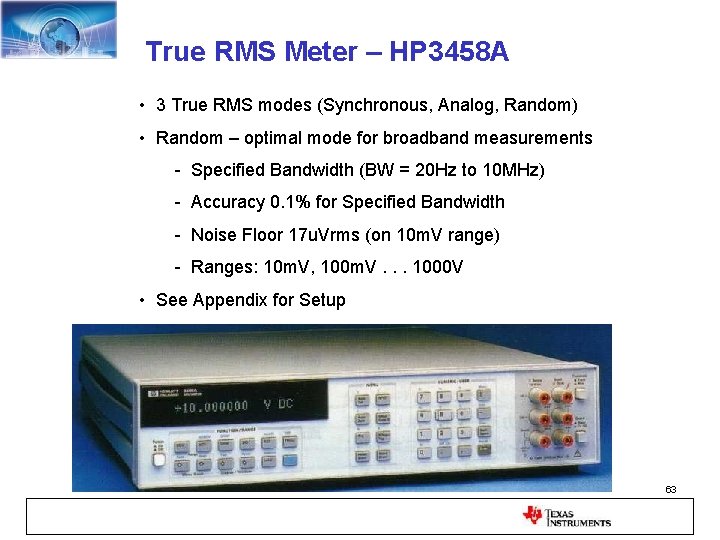
True RMS Meter – HP 3458 A • 3 True RMS modes (Synchronous, Analog, Random) • Random – optimal mode for broadband measurements - Specified Bandwidth (BW = 20 Hz to 10 MHz) - Accuracy 0. 1% for Specified Bandwidth - Noise Floor 17 u. Vrms (on 10 m. V range) - Ranges: 10 m. V, 100 m. V. . . 1000 V • See Appendix for Setup 63
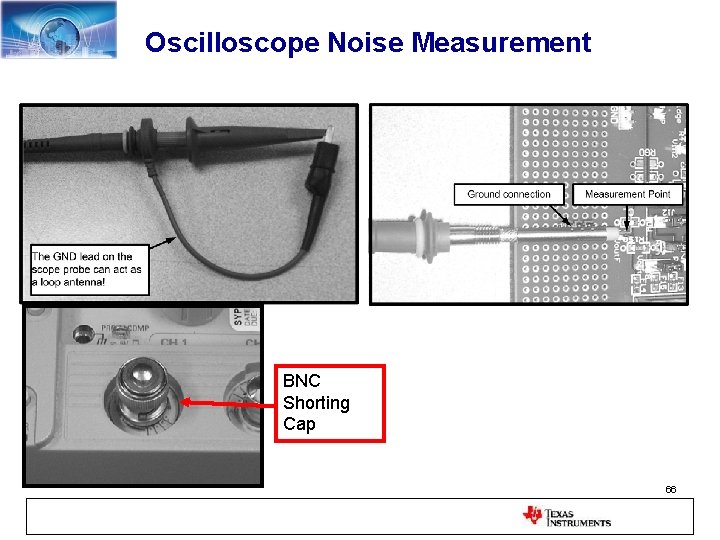
Oscilloscope Noise Measurements • Do NOT use 10 x Probes for low noise measurements • Use direct BNC Connection (10 times better noise floor) • Use Male BNC Shorting Cap to Measure Noise Floor • Use BW Limiting if Appropriate • Use digital scope in dc coupling for 1/f noise measurements (ac coupling has a 60 Hz high pass) • Use AC coupling for broadband measurements if necessary 64
TDS 460 A Digitizing Oscilloscope Example Best Noise Floor = 0. 2 m. V BW Limit = 20 MHz BNC Shorting Cap Noise measurements use BNC cables Noise Floor = 0. 8 m. V BW FULL = 400 MHz BNC Shorting Cap Worst Noise Floor = 8 m. V BW FULL = 400 MHz 10 x Scope Probe 65
Oscilloscope Noise Measurement BNC Shorting Cap 66
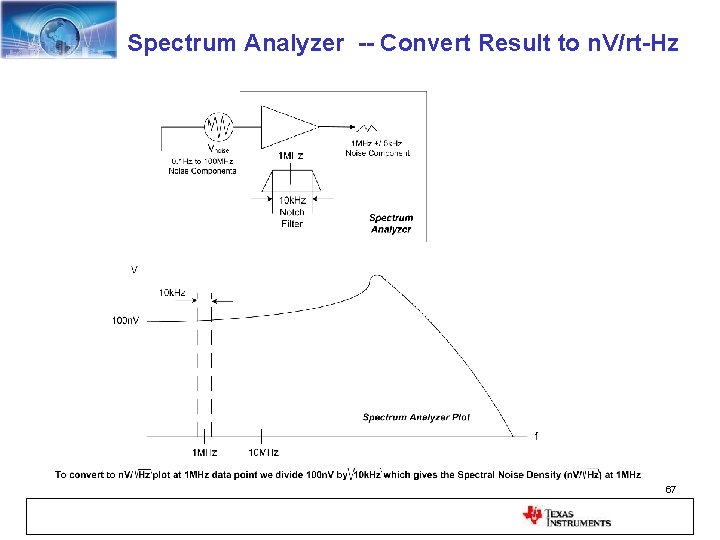
Spectrum Analyzer -- Convert Result to n. V/rt-Hz 67
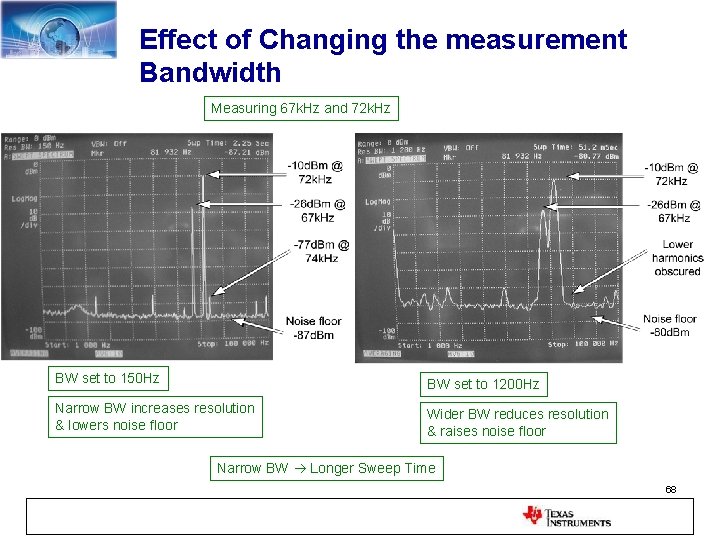
Effect of Changing the measurement Bandwidth Measuring 67 k. Hz and 72 k. Hz BW set to 150 Hz BW set to 1200 Hz Narrow BW increases resolution & lowers noise floor Wider BW reduces resolution & raises noise floor Narrow BW Longer Sweep Time 68
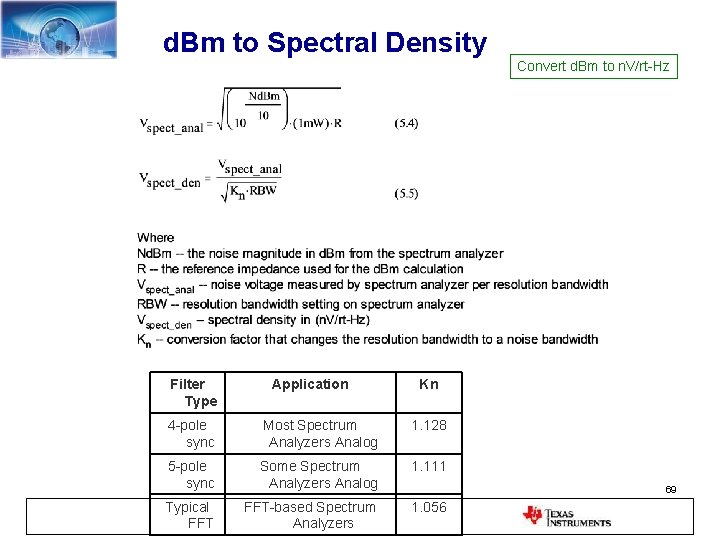
d. Bm to Spectral Density Convert d. Bm to n. V/rt-Hz Filter Type Application Kn 4 -pole sync Most Spectrum Analyzers Analog 1. 128 5 -pole sync Some Spectrum Analyzers Analog 1. 111 Typical FFT-based Spectrum Analyzers 1. 056 69
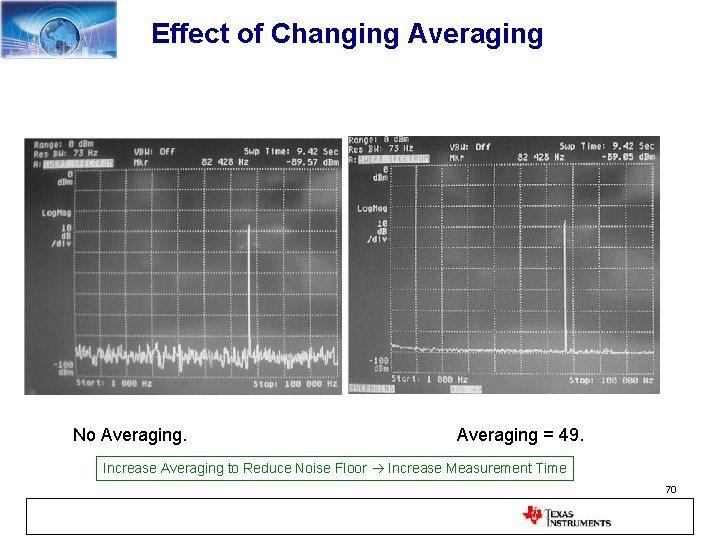
Effect of Changing Averaging No Averaging = 49. Increase Averaging to Reduce Noise Floor Increase Measurement Time 70
71
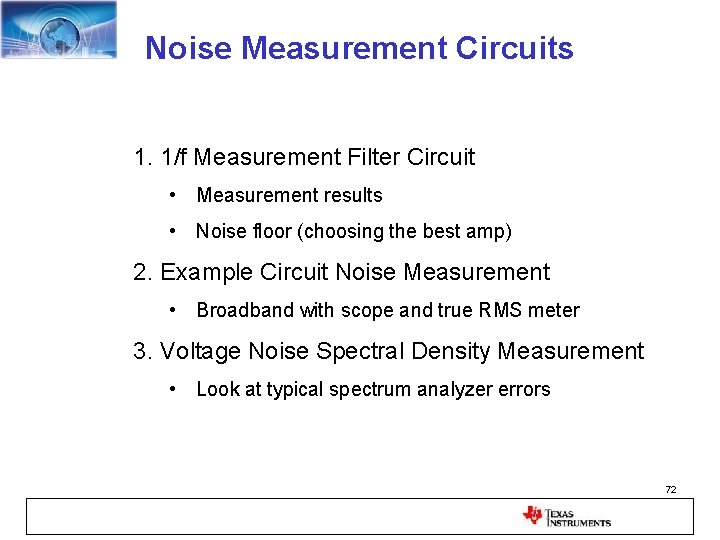
Noise Measurement Circuits 1. 1/f Measurement Filter Circuit • Measurement results • Noise floor (choosing the best amp) 2. Example Circuit Noise Measurement • Broadband with scope and true RMS meter 3. Voltage Noise Spectral Density Measurement • Look at typical spectrum analyzer errors 72
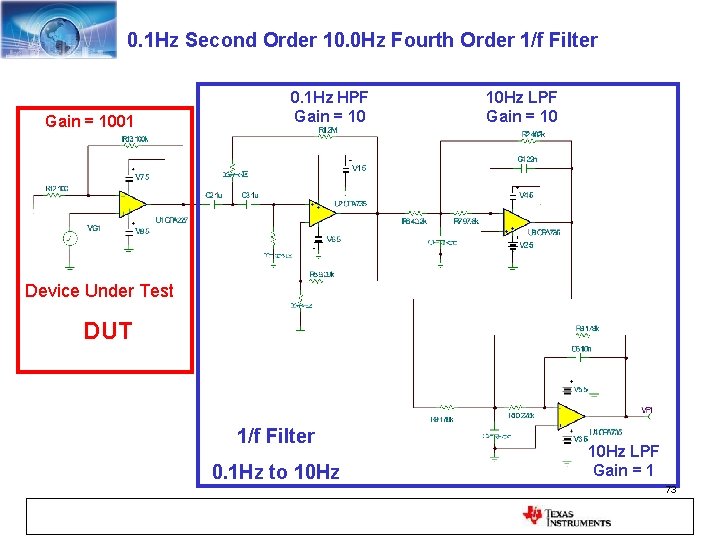
0. 1 Hz Second Order 10. 0 Hz Fourth Order 1/f Filter Gain = 1001 0. 1 Hz HPF Gain = 10 10 Hz LPF Gain = 10 Device Under Test DUT 1/f Filter 0. 1 Hz to 10 Hz LPF Gain = 1 73
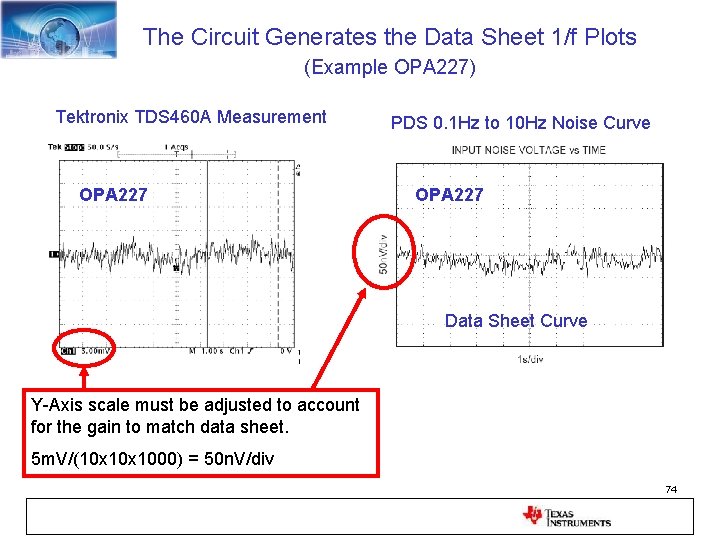
The Circuit Generates the Data Sheet 1/f Plots (Example OPA 227) Tektronix TDS 460 A Measurement OPA 227 PDS 0. 1 Hz to 10 Hz Noise Curve OPA 227 Data Sheet Curve Y-Axis scale must be adjusted to account for the gain to match data sheet. 5 m. V/(10 x 1000) = 50 n. V/div 74
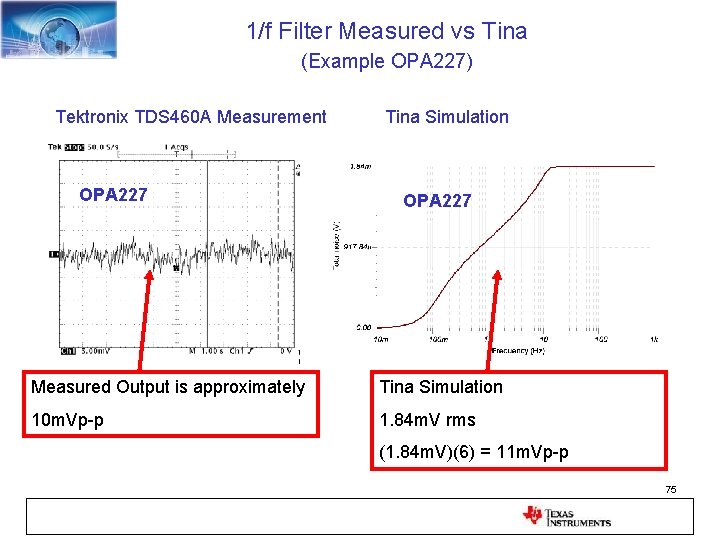
1/f Filter Measured vs Tina (Example OPA 227) Tektronix TDS 460 A Measurement OPA 227 Tina Simulation OPA 227 Measured Output is approximately Tina Simulation 10 m. Vp-p 1. 84 m. V rms (1. 84 m. V)(6) = 11 m. Vp-p 75
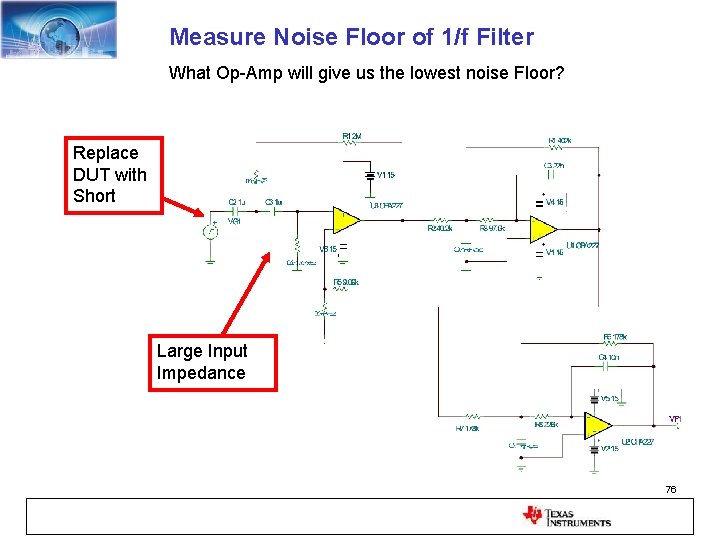
Measure Noise Floor of 1/f Filter What Op-Amp will give us the lowest noise Floor? Replace DUT with Short Large Input Impedance 76
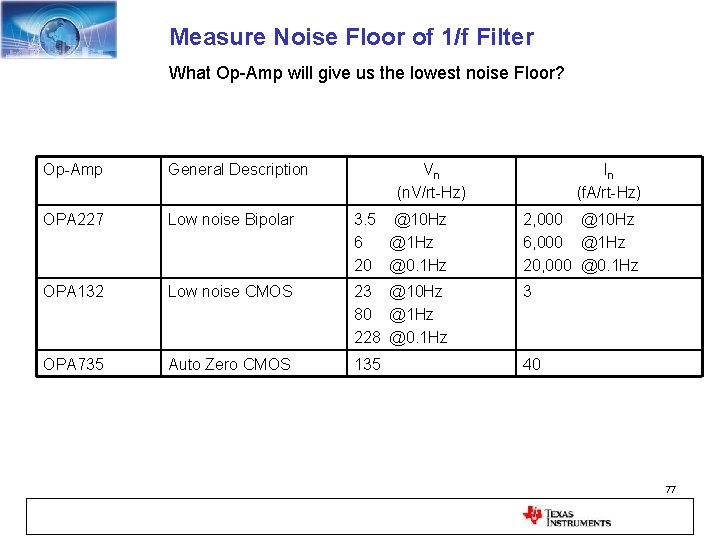
Measure Noise Floor of 1/f Filter What Op-Amp will give us the lowest noise Floor? Op-Amp General Description Vn (n. V/rt-Hz) In (f. A/rt-Hz) OPA 227 Low noise Bipolar 3. 5 @10 Hz 6 @1 Hz 20 @0. 1 Hz 2, 000 @10 Hz 6, 000 @1 Hz 20, 000 @0. 1 Hz OPA 132 Low noise CMOS 23 @10 Hz 80 @1 Hz 228 @0. 1 Hz 3 OPA 735 Auto Zero CMOS 135 40 77
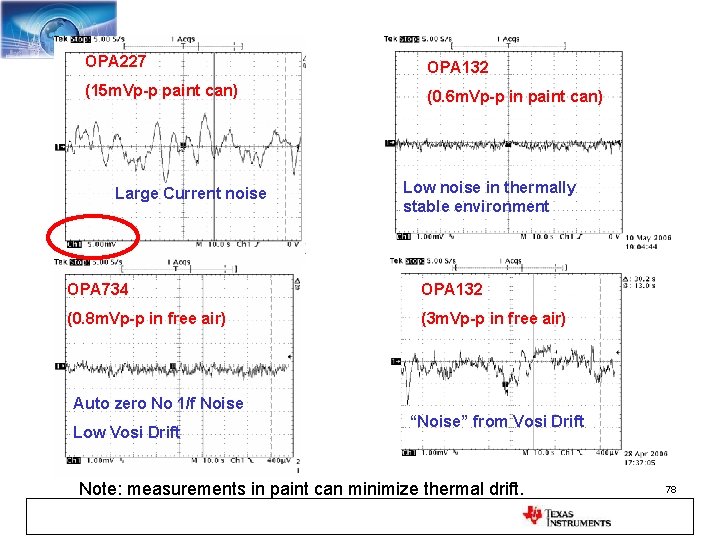
OPA 227 OPA 132 (15 m. Vp-p paint can) (0. 6 m. Vp-p in paint can) Large Current noise Low noise in thermally stable environment OPA 734 OPA 132 (0. 8 m. Vp-p in free air) (3 m. Vp-p in free air) Auto zero No 1/f Noise Low Vosi Drift “Noise” from Vosi Drift Note: measurements in paint can minimize thermal drift. 78
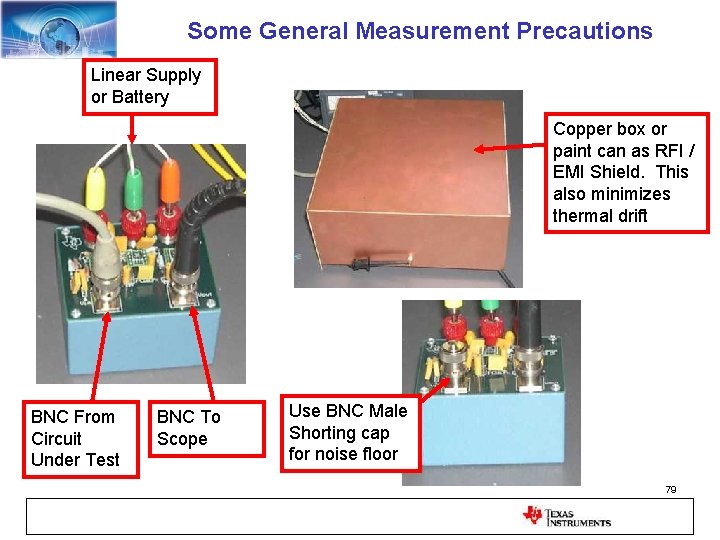
Some General Measurement Precautions Linear Supply or Battery Copper box or paint can as RFI / EMI Shield. This also minimizes thermal drift BNC From Circuit Under Test BNC To Scope Use BNC Male Shorting cap for noise floor 79
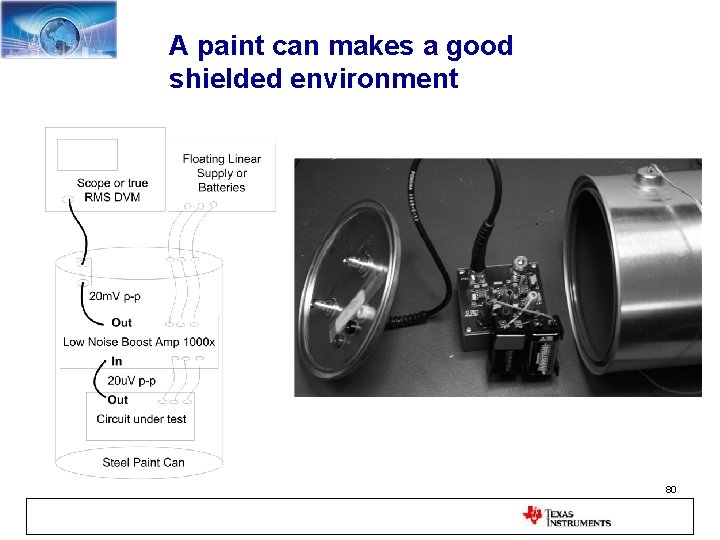
A paint can makes a good shielded environment 80
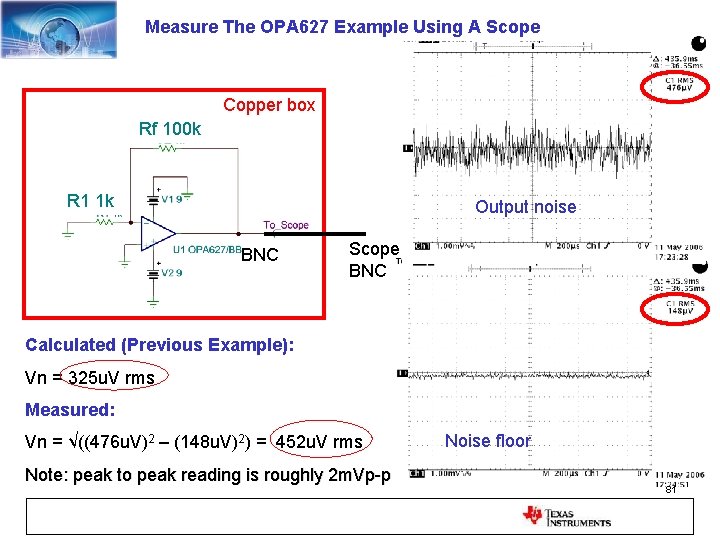
Measure The OPA 627 Example Using A Scope Copper box Rf 100 k R 1 1 k Output noise BNC Scope BNC Calculated (Previous Example): Vn = 325 u. V rms Measured: Vn = √((476 u. V)2 – (148 u. V)2) = 452 u. V rms Note: peak to peak reading is roughly 2 m. Vp-p Noise floor 81
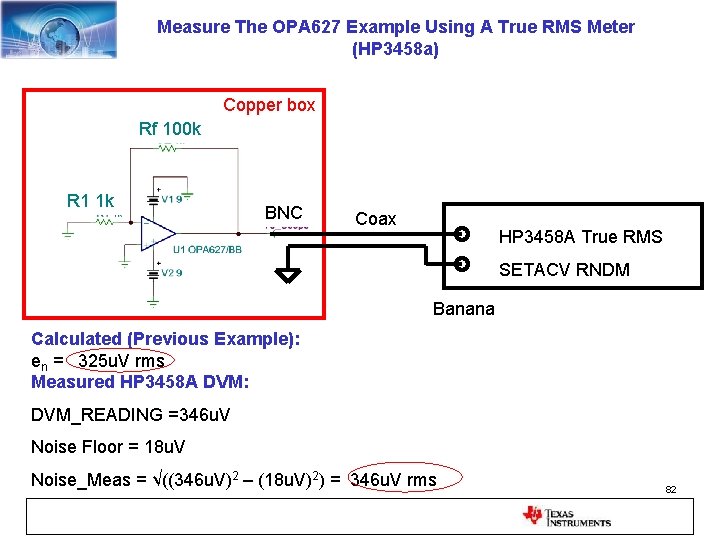
Measure The OPA 627 Example Using A True RMS Meter (HP 3458 a) Copper box Rf 100 k R 1 1 k BNC Coax HP 3458 A True RMS SETACV RNDM Banana Calculated (Previous Example): en = 325 u. V rms Measured HP 3458 A DVM: DVM_READING =346 u. V Noise Floor = 18 u. V Noise_Meas = √((346 u. V)2 – (18 u. V)2) = 346 u. V rms 82
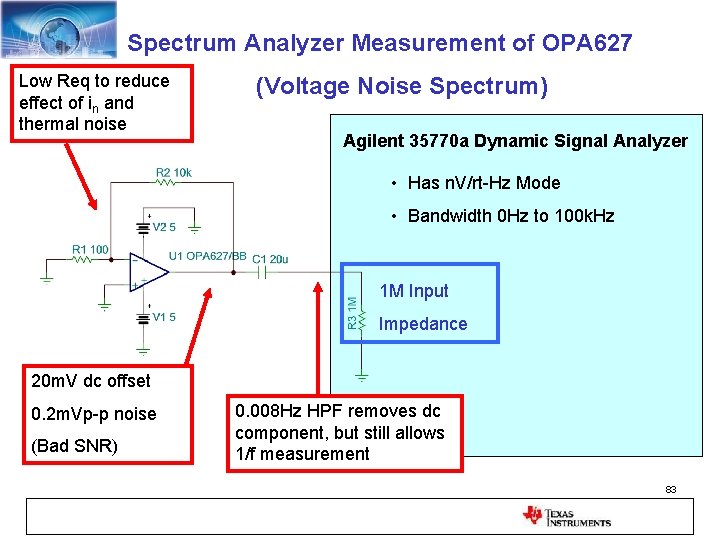
Spectrum Analyzer Measurement of OPA 627 Low Req to reduce effect of in and thermal noise (Voltage Noise Spectrum) Agilent 35770 a Dynamic Signal Analyzer • Has n. V/rt-Hz Mode • Bandwidth 0 Hz to 100 k. Hz 1 M Input Impedance 20 m. V dc offset 0. 2 m. Vp-p noise (Bad SNR) 0. 008 Hz HPF removes dc component, but still allows 1/f measurement 83
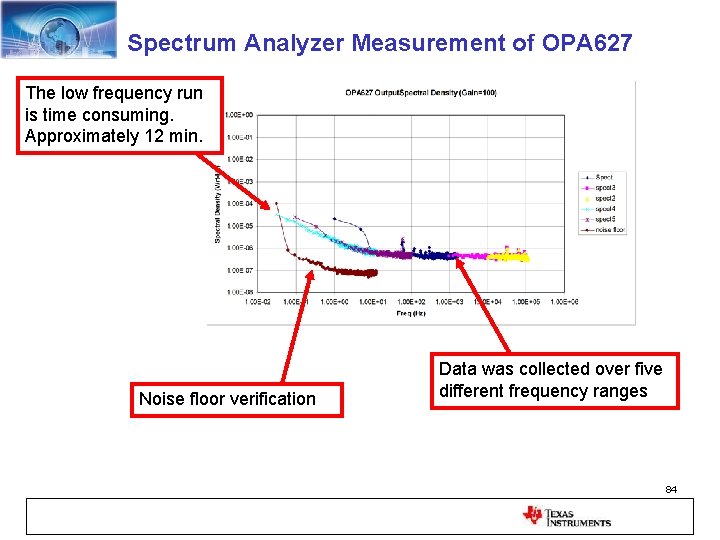
Spectrum Analyzer Measurement of OPA 627 The low frequency run is time consuming. Approximately 12 min. Noise floor verification Data was collected over five different frequency ranges 84
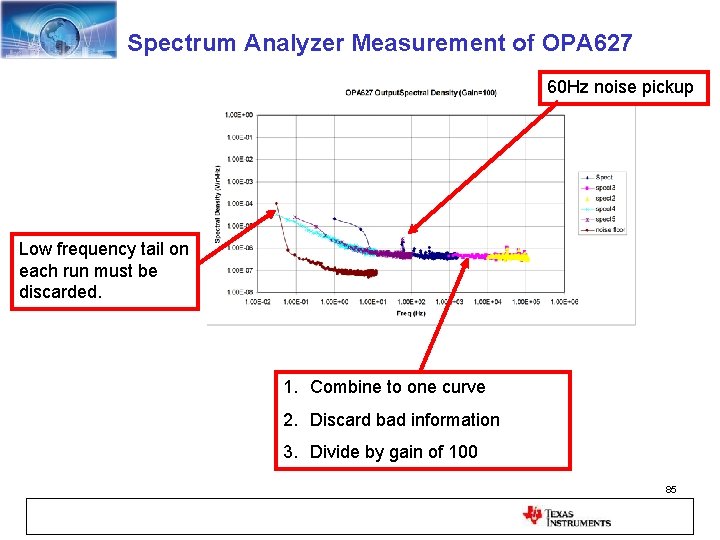
Spectrum Analyzer Measurement of OPA 627 60 Hz noise pickup Low frequency tail on each run must be discarded. 1. Combine to one curve 2. Discard bad information 3. Divide by gain of 100 85
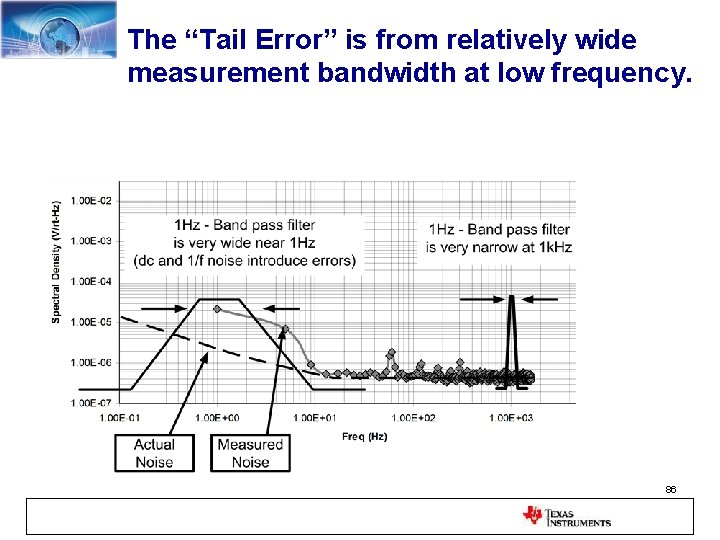
The “Tail Error” is from relatively wide measurement bandwidth at low frequency. 86
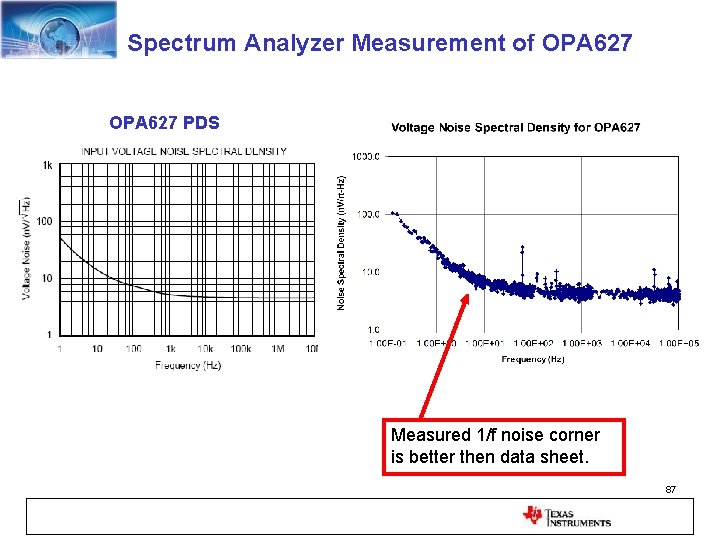
Spectrum Analyzer Measurement of OPA 627 PDS Measured 1/f noise corner is better then data sheet. 87
References 1. 2. 3. Robert V. Hogg, and Elliot A Tanis, Probability and Statistical Inference, 3 rd Edition, Macmillan Publishing Co C. D. Motchenbacher, and J. A. Connelly, Low-Noise Electronic System Design, A Wiley-Interscience Publication Henry W. Ott, Noise Reduction Techniques in Electronics Systems, John Wiley and Sons Acknowledgments: 1. 2. 3. 4. 8. R. Burt, Technique for Computing Noise based on Data Sheet Curves, General Noise Information N. Albaugh, General Noise Information, AFA Deep-Dive Seminar T. Green, General Information B. Trump, General Information B. Sands, Noise Models Noise Article Series (www. en-genius. net) http: //www. en-genius. net/site/zones/audiovideo. ZONE/technical_notes/avt_022508 88
Thank You for Your Interest in Noise – Calculation and Measurement Comments, Questions, Technical Discussions Welcome: Art Kay 520 -746 -6072 kay_art@ti. com 89
90
91 (Formulas) Statistics Summary
Statistics Summary (PDF vs Discrete Population) 92
Statistics Summary (RMS and STDEV) 93
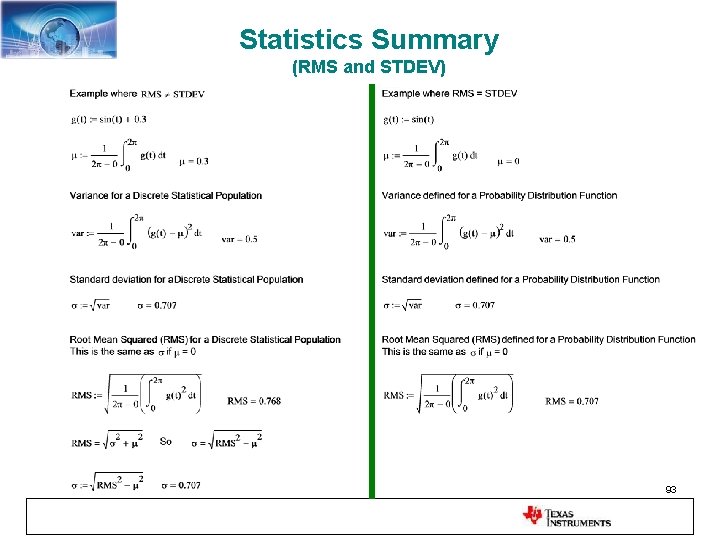
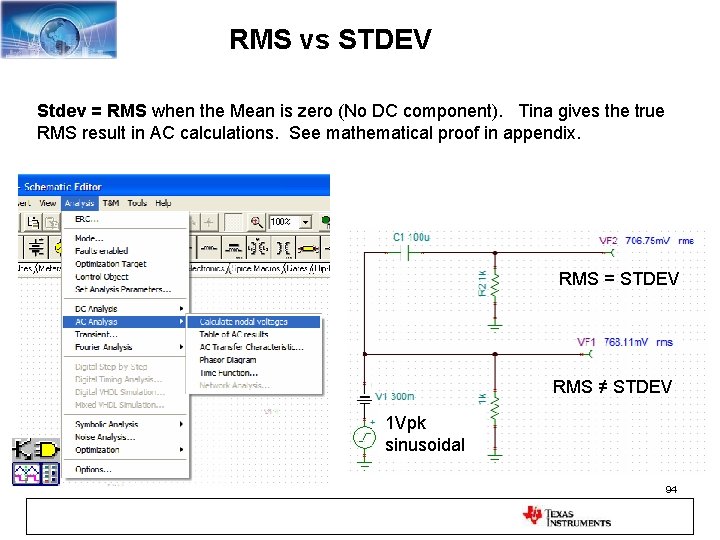
RMS vs STDEV Stdev = RMS when the Mean is zero (No DC component). Tina gives the true RMS result in AC calculations. See mathematical proof in appendix. RMS = STDEV RMS ≠ STDEV 1 Vpk sinusoidal 94
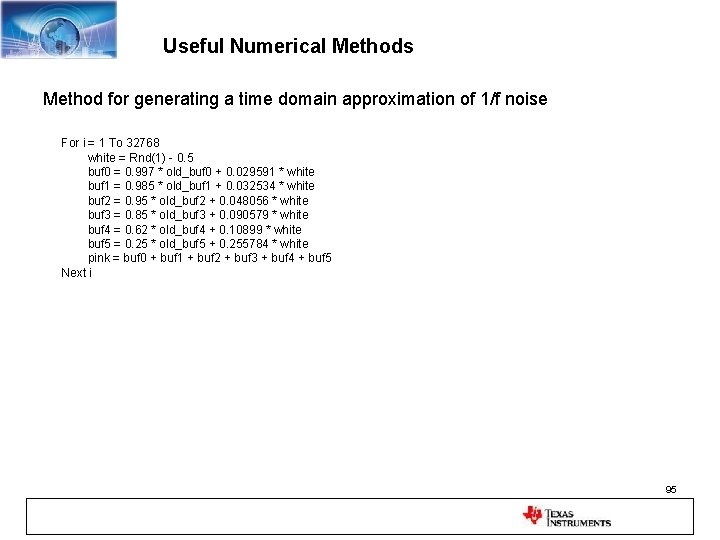
Useful Numerical Methods Method for generating a time domain approximation of 1/f noise For i = 1 To 32768 white = Rnd(1) - 0. 5 buf 0 = 0. 997 * old_buf 0 + 0. 029591 * white buf 1 = 0. 985 * old_buf 1 + 0. 032534 * white buf 2 = 0. 95 * old_buf 2 + 0. 048056 * white buf 3 = 0. 85 * old_buf 3 + 0. 090579 * white buf 4 = 0. 62 * old_buf 4 + 0. 10899 * white buf 5 = 0. 25 * old_buf 5 + 0. 255784 * white pink = buf 0 + buf 1 + buf 2 + buf 3 + buf 4 + buf 5 Next i 95
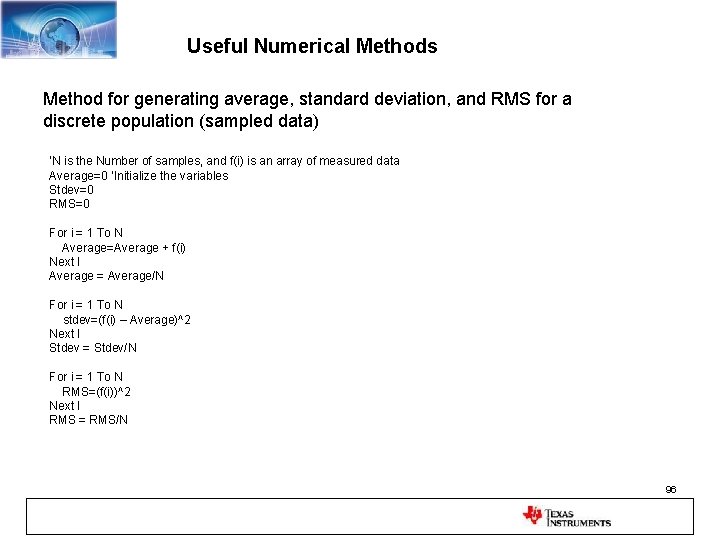
Useful Numerical Methods Method for generating average, standard deviation, and RMS for a discrete population (sampled data) ‘N is the Number of samples, and f(i) is an array of measured data Average=0 ‘Initialize the variables Stdev=0 RMS=0 For i = 1 To N Average=Average + f(i) Next I Average = Average/N For i = 1 To N stdev=(f(i) – Average)^2 Next I Stdev = Stdev/N For i = 1 To N RMS=(f(i))^2 Next I RMS = RMS/N 96
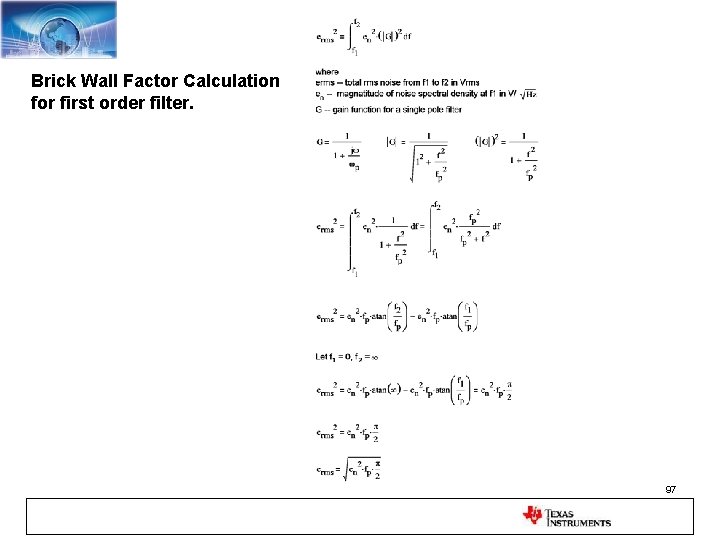
Brick Wall Factor Calculation for first order filter. 97
1/f Noise Derivation 98
Current Noise - 0 V + + (In x Rf) - In Vo = (In x Rf) 99
Current Noise Equ. Input Noise Vo = (In x Rf) 100
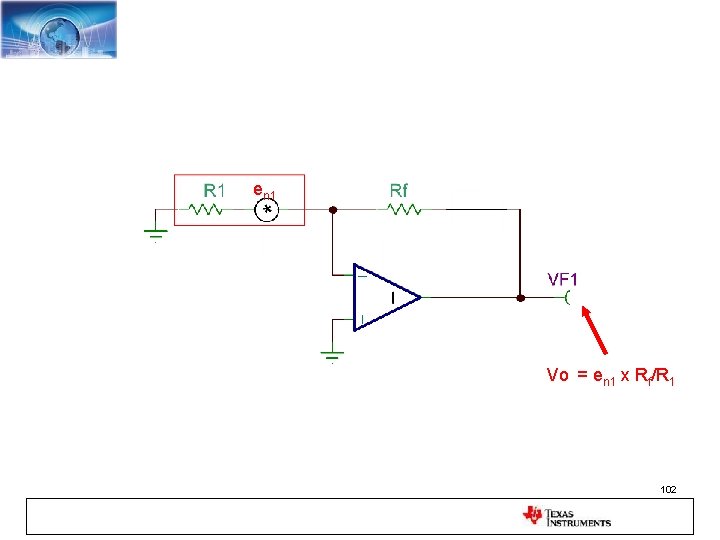
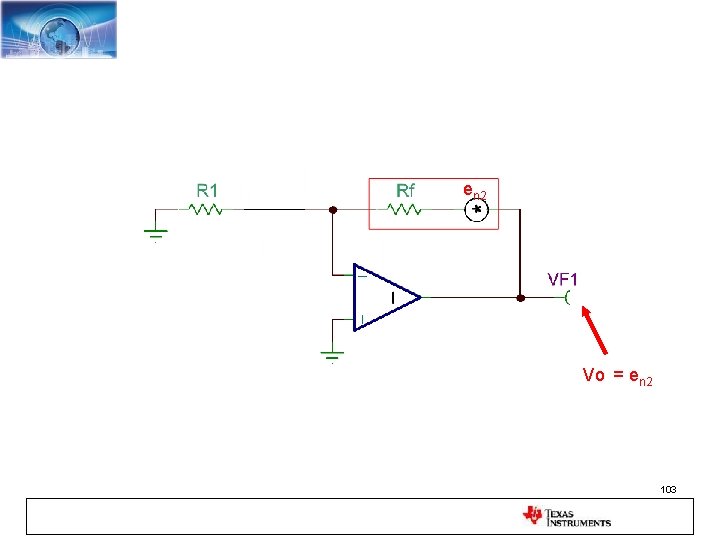
Solve for Resistor Noise Components Noise Source with Each Resistor 101
en 1 Vo = en 1 x Rf/R 1 102
en 2 Vo = en 2 103
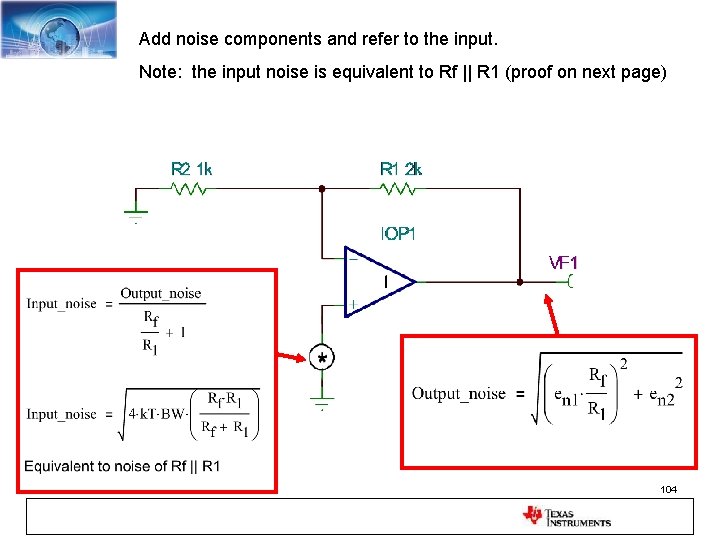
Add noise components and refer to the input. Note: the input noise is equivalent to Rf || R 1 (proof on next page) 104
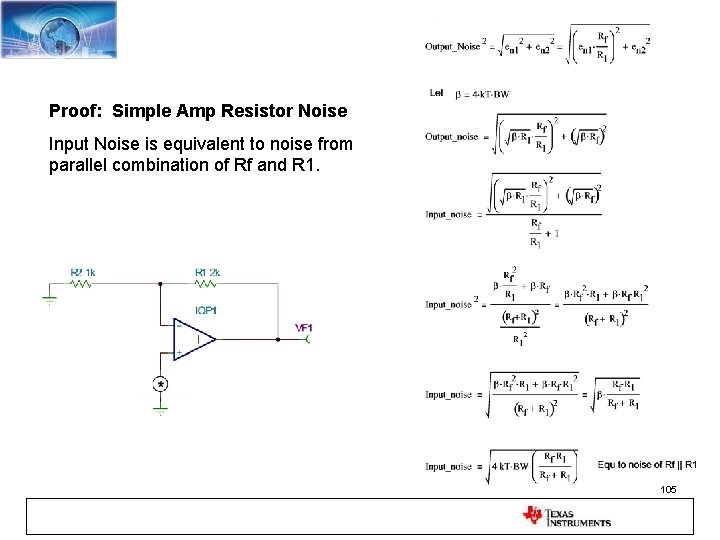
Proof: Simple Amp Resistor Noise Input Noise is equivalent to noise from parallel combination of Rf and R 1. 105