
Ooredoo Group 9 M 2018 Results September 2018
Ooredoo Group 9 M 2018 Results September 2018 Ooredoo Group 9 M 2018 Results |
Disclaimer • Ooredoo (parent company Ooredoo Q. P. S. C. ) and the group of companies which it forms part of (“Ooredoo Group”) cautions investors that certain statements contained in this document state Ooredoo Group management's intentions, hopes, beliefs, expectations, or predictions of the future and, as such, are forward-looking statements • Ooredoo Group management wishes to further caution the reader that forward-looking statements are not historical facts and are only estimates or predictions. Actual results may differ materially from those projected as a result of risks and uncertainties including, but not limited to: • • • Our ability to manage domestic and international growth and maintain a high level of customer service Future sales growth Market acceptance of our product and service offerings Our ability to secure adequate financing or equity capital to fund our operations Network expansion Performance of our network and equipment Our ability to enter into strategic alliances or transactions Cooperation of incumbent local exchange carriers in provisioning lines and interconnecting our equipment Regulatory approval processes Changes in technology Price competition Other market conditions and associated risks • This presentation does not constitute an offering of securities or otherwise constitute an invitation or inducement to any person to underwrite, subscribe for or otherwise acquire or dispose of securities in any company within the Ooredoo Group • The Ooredoo Group undertakes no obligation to update publicly or otherwise any forward-looking statements, whether as a result of future events, new information, or otherwise Ooredoo Group 9 M 2018 Results | 2
Contents 1. Results review 2. Operations review 3. Additional information Ooredoo Group 9 M 2018 Results | 3
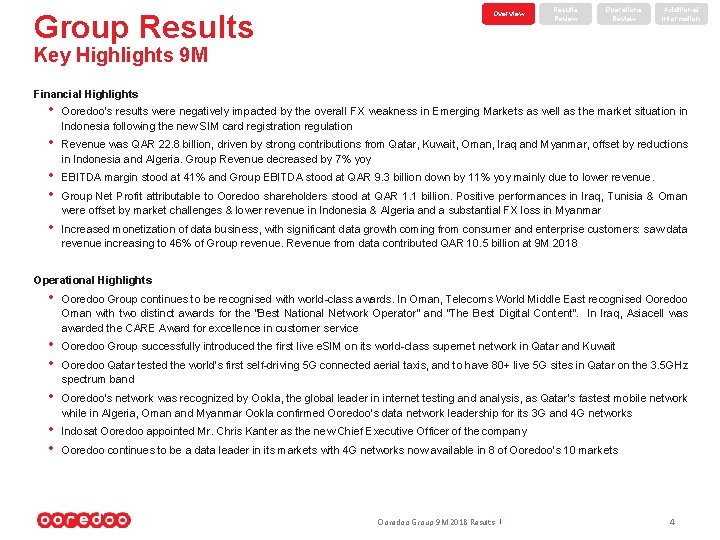
Group Results Overview Results Review Operations Review Additional Information Key Highlights 9 M Financial Highlights • Ooredoo’s results were negatively impacted by the overall FX weakness in Emerging Markets as well as the market situation in Indonesia following the new SIM card registration regulation • Revenue was QAR 22. 8 billion, driven by strong contributions from Qatar, Kuwait, Oman, Iraq and Myanmar, offset by reductions in Indonesia and Algeria. Group Revenue decreased by 7% yoy • • EBITDA margin stood at 41% and Group EBITDA stood at QAR 9. 3 billion down by 11% yoy mainly due to lower revenue. • Increased monetization of data business, with significant data growth coming from consumer and enterprise customers: saw data revenue increasing to 46% of Group revenue. Revenue from data contributed QAR 10. 5 billion at 9 M 2018 Group Net Profit attributable to Ooredoo shareholders stood at QAR 1. 1 billion. Positive performances in Iraq, Tunisia & Oman were offset by market challenges & lower revenue in Indonesia & Algeria and a substantial FX loss in Myanmar Operational Highlights • Ooredoo Group continues to be recognised with world-class awards. In Oman, Telecoms World Middle East recognised Ooredoo Oman with two distinct awards for the “Best National Network Operator” and “The Best Digital Content”. In Iraq, Asiacell was awarded the CARE Award for excellence in customer service • • Ooredoo Group successfully introduced the first live e. SIM on its world-class supernet network in Qatar and Kuwait • Ooredoo’s network was recognized by Ookla, the global leader in internet testing and analysis, as Qatar’s fastest mobile network while in Algeria, Oman and Myanmar Ookla confirmed Ooredoo’s data network leadership for its 3 G and 4 G networks • • Indosat Ooredoo appointed Mr. Chris Kanter as the new Chief Executive Officer of the company Ooredoo Qatar tested the world’s first self-driving 5 G connected aerial taxis, and to have 80+ live 5 G sites in Qatar on the 3. 5 GHz spectrum band Ooredoo continues to be a data leader in its markets with 4 G networks now available in 8 of Ooredoo’s 10 markets Ooredoo Group 9 M 2018 Results | 4
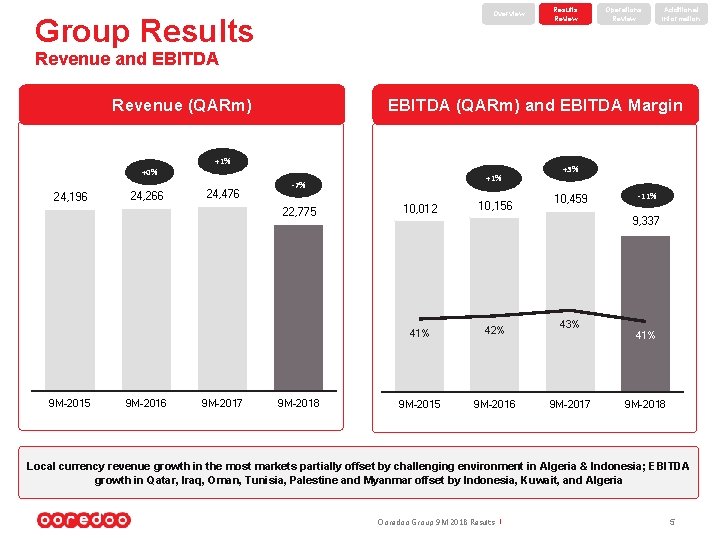
Overview Group Results Review Operations Review Additional Information Revenue and EBITDA Revenue (QARm) +0% 24, 196 24, 266 EBITDA (QARm) and EBITDA Margin +1% 24, 476 -7% 22, 775 9 M-2016 9 M-2017 +1% 9 M-2018 10, 012 10, 156 41% 42% 9 M-2015 9 M-2016 +3% 10, 459 -11% 9, 337 43% 9 M-2017 41% 9 M-2018 Local currency revenue growth in the most markets partially offset by challenging environment in Algeria & Indonesia; EBITDA growth in Qatar, Iraq, Oman, Tunisia, Palestine and Myanmar offset by Indonesia, Kuwait, and Algeria Ooredoo Group 9 M 2018 Results | 5
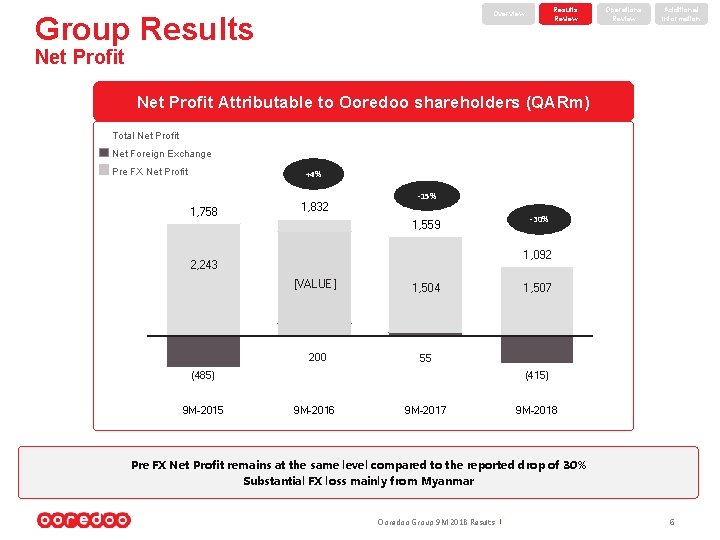
Results Review Overview Group Results Operations Review Additional Information Net Profit Attributable to Ooredoo shareholders (QARm) Total Net Profit Net Foreign Exchange Pre FX Net Profit +4% 1, 758 1, 832 -15% 1, 559 1, 092 2, 243 [VALUE] 1, 504 200 55 1, 507 (415) (485) 9 M-2015 -30% 9 M-2016 9 M-2017 9 M-2018 Pre FX Net Profit remains at the same level compared to the reported drop of 30% Substantial FX loss mainly from Myanmar Ooredoo Group 9 M 2018 Results | 6
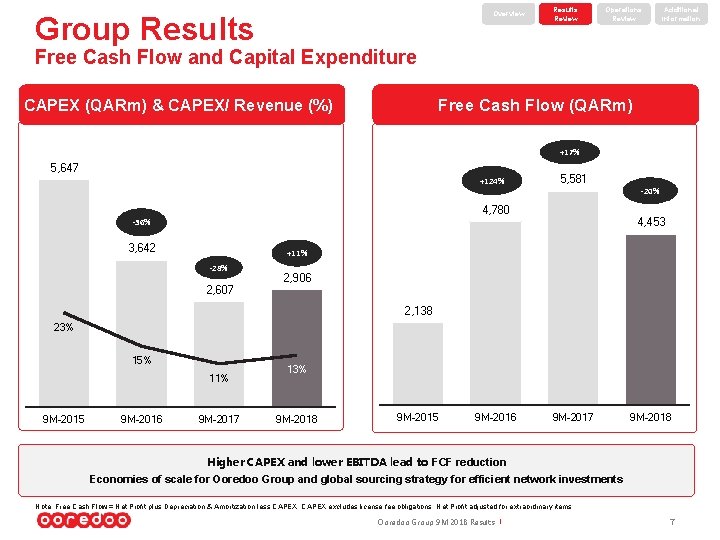
Overview Group Results Review Operations Review Additional Information Free Cash Flow and Capital Expenditure Free Cash Flow (QARm) CAPEX (QARm) & CAPEX/ Revenue (%) +17% 5, 647 +124% 5, 581 -20% 4, 780 4, 453 -36% 3, 642 +11% -28% 2, 607 2, 906 2, 138 23% 15% 11% 9 M-2015 9 M-2016 9 M-2017 13% 9 M-2018 9 M-2015 9 M-2016 9 M-2017 9 M-2018 Higher CAPEX and lower EBITDA lead to FCF reduction Economies of scale for Ooredoo Group and global sourcing strategy for efficient network investments Note: Free Cash Flow = Net Profit plus Depreciation & Amortization less CAPEX; CAPEX excludes license fee obligations; Net Profit adjusted for extraordinary items Ooredoo Group 9 M 2018 Results | 7
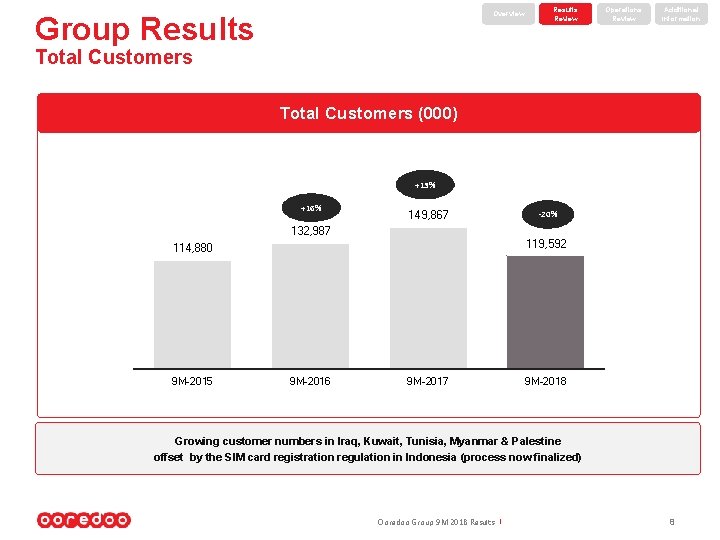
Overview Group Results Review Operations Review Additional Information Total Customers (000) +13% +16% 149, 867 -20% 132, 987 119, 592 114, 880 9 M-2015 9 M-2016 9 M-2017 9 M-2018 Growing customer numbers in Iraq, Kuwait, Tunisia, Myanmar & Palestine offset by the SIM card registration regulation in Indonesia (process now finalized) Ooredoo Group 9 M 2018 Results | 8
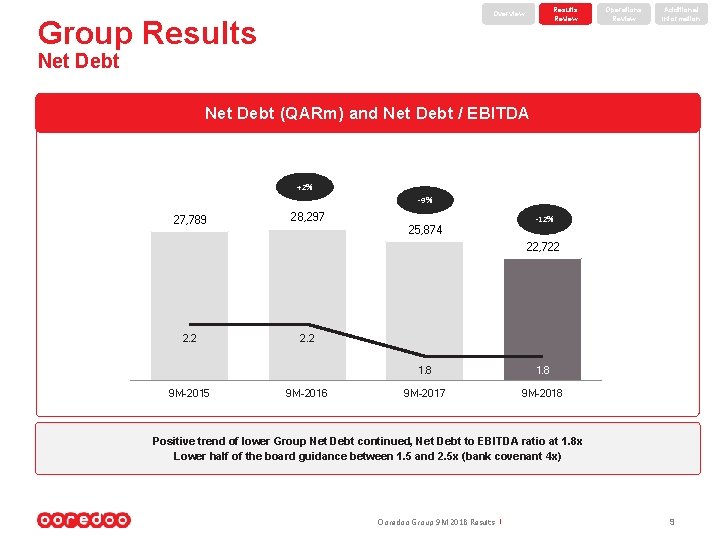
Results Review Overview Group Results Operations Review Additional Information Net Debt (QARm) and Net Debt / EBITDA +2% -9% 27, 789 28, 297 25, 874 -12% 22, 722 2. 2 9 M-2015 2. 2 9 M-2016 1. 8 9 M-2017 9 M-2018 Positive trend of lower Group Net Debt continued, Net Debt to EBITDA ratio at 1. 8 x Lower half of the board guidance between 1. 5 and 2. 5 x (bank covenant 4 x) Ooredoo Group 9 M 2018 Results | 9
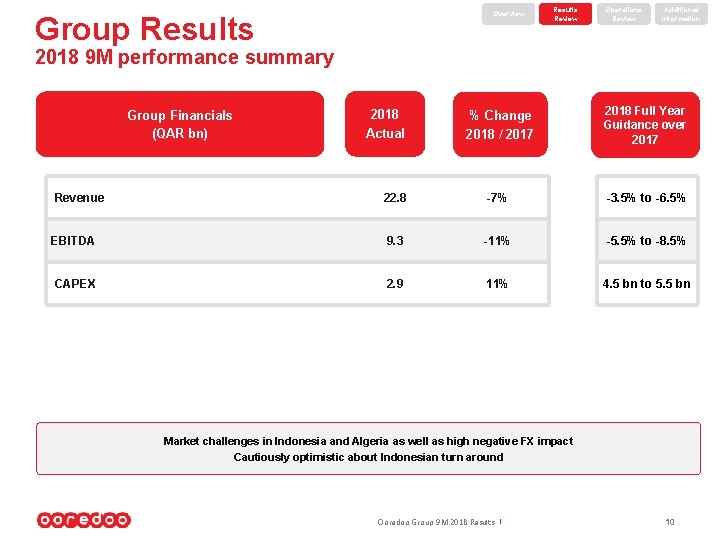
Overview Group Results Review Operations Review Additional Information 2018 9 M performance summary Group Financials (QAR bn) 2018 Actual % Change 2018 / 2017 2018 Full Year Guidance over 2017 Revenue 22. 8 -7% -3. 5% to -6. 5% EBITDA 9. 3 -11% -5. 5% to -8. 5% CAPEX 2. 9 11% 4. 5 bn to 5. 5 bn Market challenges in Indonesia and Algeria as well as high negative FX impact Cautiously optimistic about Indonesian turn around Ooredoo Group 9 M 2018 Results | 10
Contents 1. Results review 2. Operations review 3. Additional information Ooredoo Group 9 M 2018 Results | 11
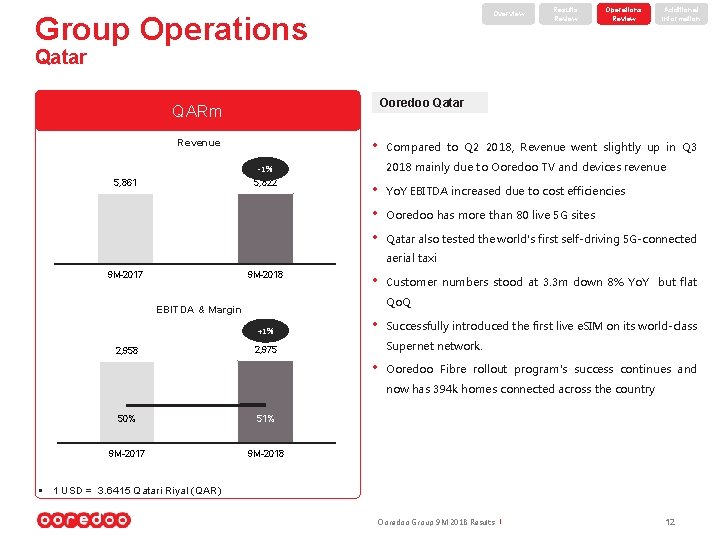
Overview Group Operations Results Review Operations Review Additional Information Qatar Ooredoo Qatar QARm Revenue • 2018 mainly due to Ooredoo TV and devices revenue -1% 5, 861 5, 822 Compared to Q 2 2018, Revenue went slightly up in Q 3 • • • Yo. Y EBITDA increased due to cost efficiencies Ooredoo has more than 80 live 5 G sites Qatar also tested the world's first self-driving 5 G-connected aerial taxi 9 M-2017 9 M-2018 • Qo. Q EBITDA & Margin +1% 2, 958 Customer numbers stood at 3. 3 m down 8% Yo. Y but flat • Successfully introduced the first live e. SIM on its world-class Supernet network. 2, 975 • Ooredoo Fibre rollout program's success continues and now has 394 k homes connected across the country 50% 51% 9 M-2017 9 M-2018 § 1 USD = 3. 6415 Qatari Riyal (QAR) Ooredoo Group 9 M 2018 Results | 12
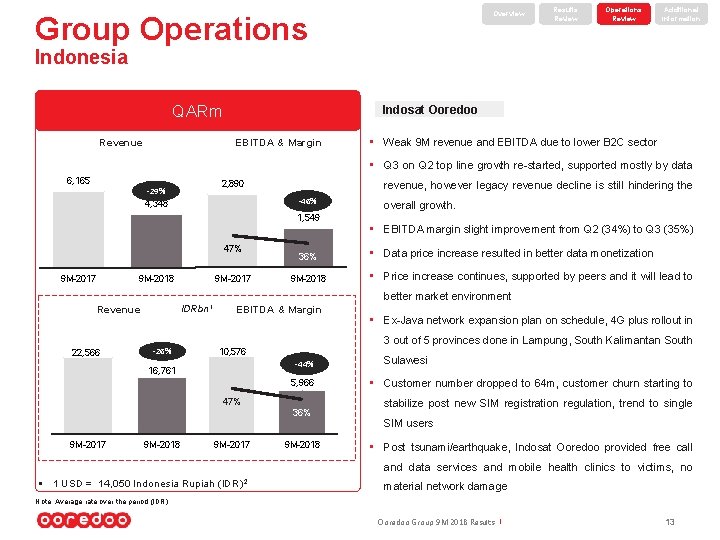
Overview Group Operations Results Review Operations Review Additional Information Indonesia QARm Revenue Indosat Ooredoo EBITDA & Margin 6, 165 • Q 3 on Q 2 top line growth re-started, supported mostly by data 2, 890 -29% 4, 348 revenue, however legacy revenue decline is still hindering the -46% 1, 549 47% 9 M-2017 9 M-2018 • Weak 9 M revenue and EBITDA due to lower B 2 C sector 36% 9 M-2018 overall growth. • EBITDA margin slight improvement from Q 2 (34%) to Q 3 (35%) • Data price increase resulted in better data monetization • Price increase continues, supported by peers and it will lead to better market environment IDRbn 1 Revenue EBITDA & Margin 22, 566 -26% 3 out of 5 provinces done in Lampung, South Kalimantan South 10, 576 -44% 16, 761 5, 966 47% 36% 9 M-2017 9 M-2018 • Ex-Java network expansion plan on schedule, 4 G plus rollout in 9 M-2017 9 M-2018 Sulawesi • Customer number dropped to 64 m, customer churn starting to stabilize post new SIM registration regulation, trend to single SIM users • Post tsunami/earthquake, Indosat Ooredoo provided free call and data services and mobile health clinics to victims, no § 1 USD = 14, 050 Indonesia Rupiah (IDR) 2 material network damage Note: Average rate over the period (IDR) Ooredoo Group 9 M 2018 Results | 13
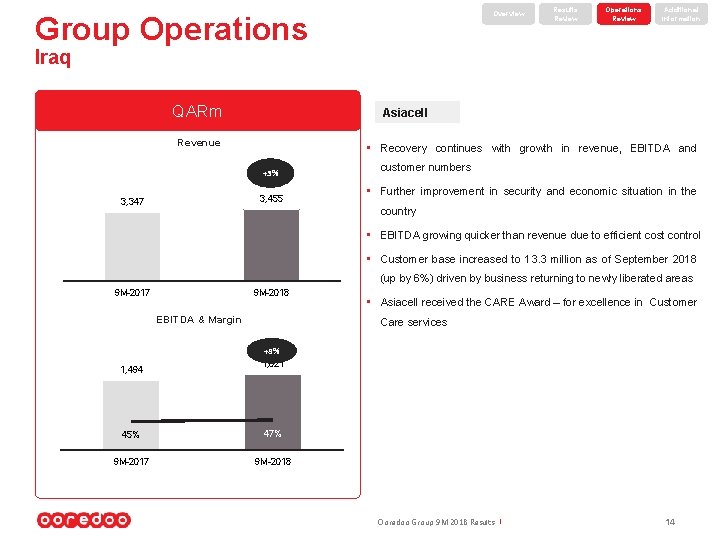
Overview Group Operations Results Review Operations Review Additional Information Iraq QARm Asiacell Revenue • Recovery continues with growth in revenue, EBITDA and +3% 3, 455 3, 347 customer numbers • Further improvement in security and economic situation in the country • EBITDA growing quicker than revenue due to efficient cost control • Customer base increased to 13. 3 million as of September 2018 (up by 6%) driven by business returning to newly liberated areas 9 M-2017 9 M-2018 EBITDA & Margin 1, 494 • Asiacell received the CARE Award – for excellence in Customer Care services +8% 1, 621 45% 47% 9 M-2017 9 M-2018 Ooredoo Group 9 M 2018 Results | 14
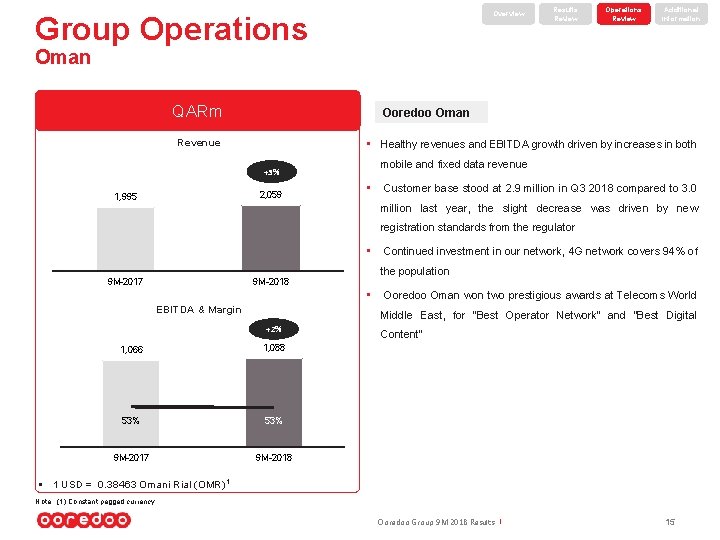
Overview Group Operations Results Review Operations Review Additional Information Oman QARm Ooredoo Oman Revenue • Healthy revenues and EBITDA growth driven by increases in both +3% 2, 059 1, 995 mobile and fixed data revenue • Customer base stood at 2. 9 million in Q 3 2018 compared to 3. 0 million last year, the slight decrease was driven by new registration standards from the regulator • Continued investment in our network, 4 G network covers 94% of 9 M-2017 9 M-2018 the population • Ooredoo Oman won two prestigious awards at Telecoms World EBITDA & Margin Middle East, for “Best Operator Network” and “Best Digital +2% 1, 066 1, 088 53% 9 M-2017 9 M-2018 Content” § 1 USD = 0. 38463 Omani Rial (OMR)1 Note: (1) Constant pegged currency Ooredoo Group 9 M 2018 Results | 15
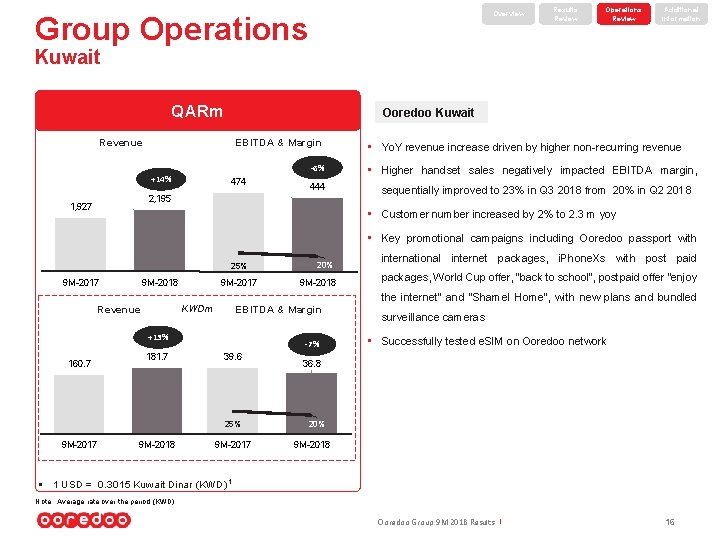
Overview Group Operations Results Review Operations Review Additional Information Kuwait QARm Ooredoo Kuwait Revenue EBITDA & Margin +14% -6% 474 444 2, 195 1, 927 • Yo. Y revenue increase driven by higher non-recurring revenue • Higher handset sales negatively impacted EBITDA margin, sequentially improved to 23% in Q 3 2018 from 20% in Q 2 2018 • Customer number increased by 2% to 2. 3 m yoy • Key promotional campaigns including Ooredoo passport with 25% 9 M-2017 9 M-2018 KWDm Revenue +13% 160. 7 9 M-2017 181. 7 9 M-2018 EBITDA & Margin -7% 39. 6 25% 9 M-2017 20% 9 M-2017 international internet packages, i. Phone. Xs with post paid packages, World Cup offer, “back to school”, postpaid offer “enjoy the internet” and “Shamel Home”, with new plans and bundled surveillance cameras • Successfully tested e. SIM on Ooredoo network 36. 8 20% 9 M-2018 § 1 USD = 0. 3015 Kuwait Dinar (KWD) 1 Note: Average rate over the period (KWD) Ooredoo Group 9 M 2018 Results | 16
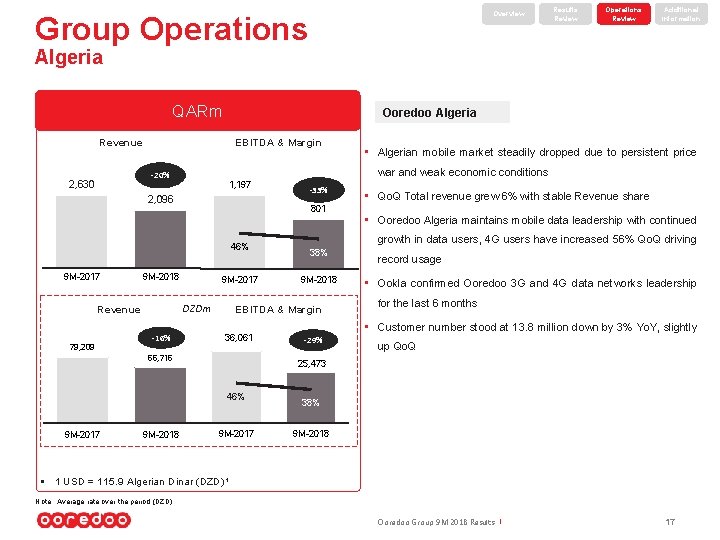
Overview Group Operations Results Review Operations Review Additional Information Algeria QARm Ooredoo Algeria Revenue EBITDA & Margin -20% 2, 630 war and weak economic conditions 1, 197 2, 096 9 M-2018 79, 209 9 M-2017 DZDm Revenue -16% 36, 061 • Ooredoo Algeria maintains mobile data leadership with continued 9 M-2018 record usage • Ookla confirmed Ooredoo 3 G and 4 G data networks leadership for the last 6 months • Customer number stood at 13. 8 million down by 3% Yo. Y, slightly -29% up Qo. Q 25, 473 46% 9 M-2018 • Qo. Q Total revenue grew 6% with stable Revenue share growth in data users, 4 G users have increased 56% Qo. Q driving 38% EBITDA & Margin 66, 716 9 M-2017 -33% 801 46% 9 M-2017 • Algerian mobile market steadily dropped due to persistent price 9 M-2017 38% 9 M-2018 § 1 USD = 115. 9 Algerian Dinar (DZD)¹ Note: Average rate over the period (DZD) Ooredoo Group 9 M 2018 Results | 17
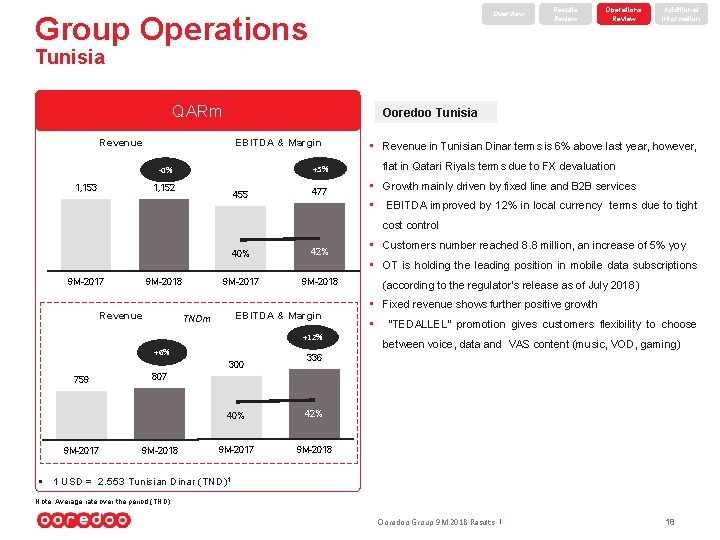
Overview Group Operations Results Review Operations Review Additional Information Tunisia QARm Ooredoo Tunisia Revenue EBITDA & Margin -0% 1, 153 +5% 1, 152 455 477 • Revenue in Tunisian Dinar terms is 6% above last year, however, flat in Qatari Riyals terms due to FX devaluation • Growth mainly driven by fixed line and B 2 B services • EBITDA improved by 12% in local currency terms due to tight cost control 9 M-2017 9 M-2018 Revenue 40% 42% 9 M-2017 9 M-2018 • OT is holding the leading position in mobile data subscriptions EBITDA & Margin TNDm +12% +6% 300 759 9 M-2017 • Customers number reached 8. 8 million, an increase of 5% yoy (according to the regulator’s release as of July 2018) • Fixed revenue shows further positive growth • “TEDALLEL” promotion gives customers flexibility to choose between voice, data and VAS content (music, VOD, gaming) 336 807 9 M-2018 40% 42% 9 M-2017 9 M-2018 § 1 USD = 2. 553 Tunisian Dinar (TND)1 Note: Average rate over the period (TND) Ooredoo Group 9 M 2018 Results | 18
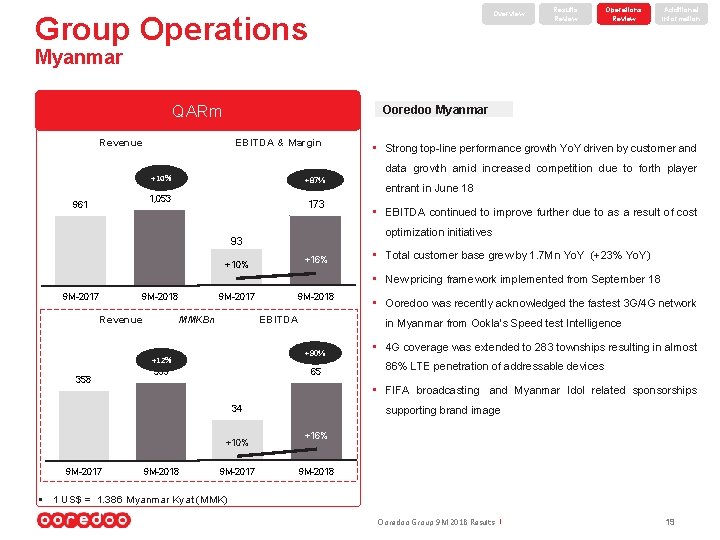
Overview Group Operations Results Review Operations Review Additional Information Myanmar QARm Ooredoo Myanmar Revenue EBITDA & Margin data growth amid increased competition due to forth player +10% +87% 1, 053 961 • Strong top-line performance growth Yo. Y driven by customer and 173 entrant in June 18 • EBITDA continued to improve further due to as a result of cost optimization initiatives 93 +16% +10% • Total customer base grew by 1. 7 Mn Yo. Y (+23% Yo. Y) • New pricing framework implemented from September 18 9 M-2017 MMKBn Revenue 9 M-2017 9 M-2018 358 +12% 399 9 M-2018 EBITDA in Myanmar from Ookla’s Speed test Intelligence +90% 65 • 4 G coverage was extended to 283 townships resulting in almost 86% LTE penetration of addressable devices • FIFA broadcasting and Myanmar Idol related sponsorships 34 +10% 9 M-2017 • Ooredoo was recently acknowledged the fastest 3 G/4 G network 9 M-2018 9 M-2017 supporting brand image +16% 9 M-2018 § 1 US$ = 1. 386 Myanmar Kyat (MMK) Ooredoo Group 9 M 2018 Results | 19
Contents 1. Results review 2. Operations review 3. Additional information Ooredoo Group 9 M 2018 Results | 20
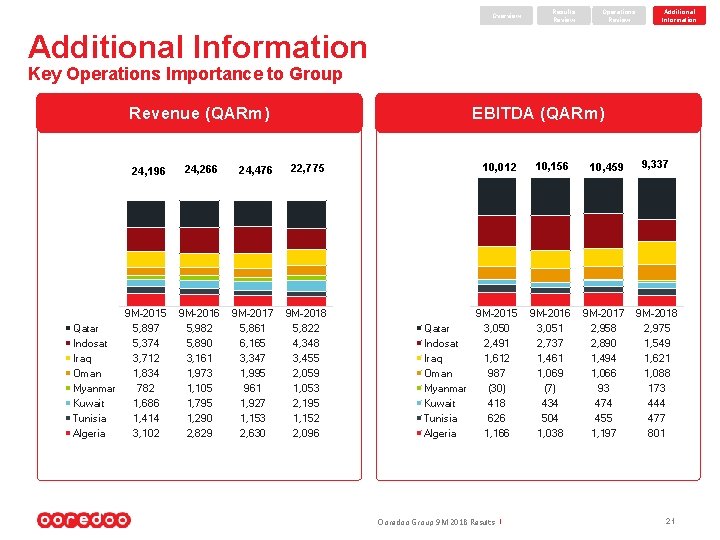
Overview Results Review Operations Review Additional Information Key Operations Importance to Group Revenue (QARm) EBITDA (QARm) 24, 196 24, 266 24, 476 22, 775 10, 012 10, 156 10, 459 9 M-2015 Qatar 5, 897 Indosat 5, 374 Iraq 3, 712 Oman 1, 834 Myanmar 782 Kuwait 1, 686 Tunisia 1, 414 Algeria 3, 102 9 M-2016 5, 982 5, 890 3, 161 1, 973 1, 105 1, 795 1, 290 2, 829 9 M-2017 5, 861 6, 165 3, 347 1, 995 961 1, 927 1, 153 2, 630 9 M-2018 5, 822 4, 348 3, 455 2, 059 1, 053 2, 195 1, 152 2, 096 9 M-2015 Qatar 3, 050 Indosat 2, 491 Iraq 1, 612 Oman 987 Myanmar (30) Kuwait 418 Tunisia 626 Algeria 1, 166 9 M-2016 3, 051 2, 737 1, 461 1, 069 (7) 434 504 1, 038 9 M-2017 2, 958 2, 890 1, 494 1, 066 93 474 455 1, 197 Ooredoo Group 9 M 2018 Results | 9, 337 9 M-2018 2, 975 1, 549 1, 621 1, 088 173 444 477 801 21
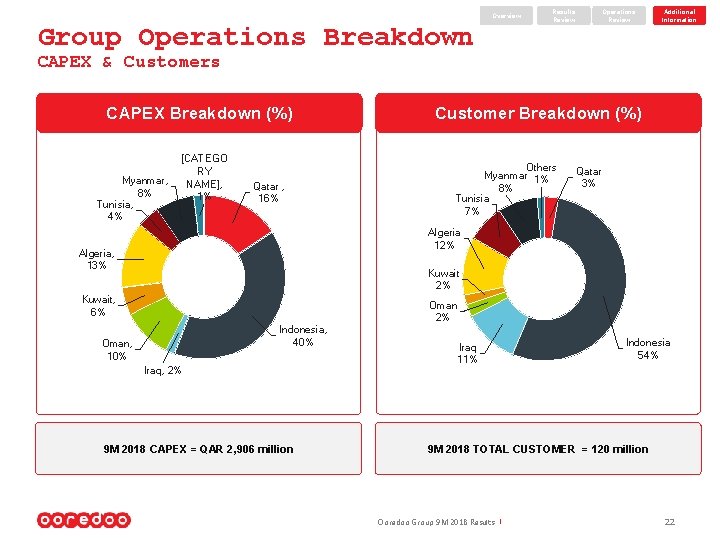
Overview Group Operations Breakdown Results Review Operations Review Additional Information CAPEX & Customers CAPEX Breakdown (%) Myanmar, 8% Tunisia, 4% [CATEGO RY NAME], 1% Qatar , 16% Customer Breakdown (%) Others Myanmar 1% 8% Tunisia 7% Qatar 3% Algeria 12% Algeria, 13% Kuwait 2% Kuwait, 6% Oman 2% Indonesia, 40% Oman, 10% Iraq, 2% 9 M 2018 CAPEX = QAR 2, 906 million Iraq 11% Indonesia 54% 9 M 2018 TOTAL CUSTOMER = 120 million Ooredoo Group 9 M 2018 Results | 22
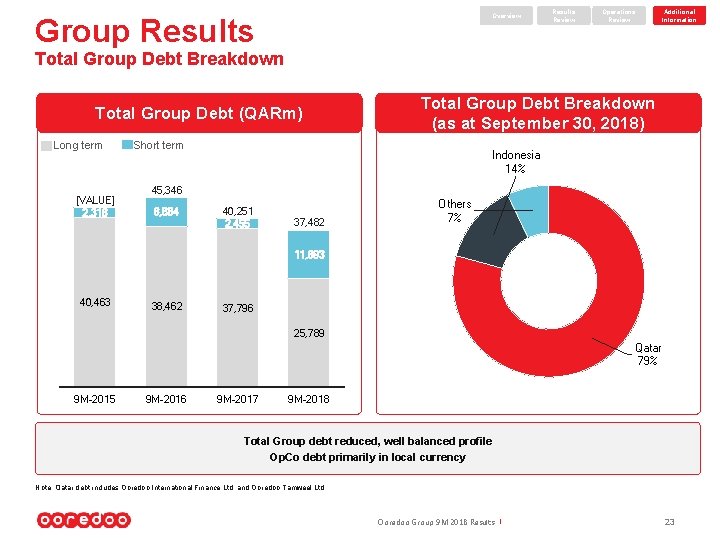
Overview Group Results Review Operations Review Additional Information Total Group Debt Breakdown Total Group Debt (QARm) Total Group Debt Breakdown (as at September 30, 2018) Long term Short term [VALUE] 2, 318 Indonesia 14% 45, 346 6, 884 40, 251 2, 455 37, 482 Others 7% 11, 693 40, 463 38, 462 37, 796 25, 789 Qatar 79% 9 M-2015 9 M-2016 9 M-2017 9 M-2018 Total Group debt reduced, well balanced profile Op. Co debt primarily in local currency Note: Qatar debt includes Ooredoo International Finance Ltd. and Ooredoo Tamweel Ltd. Ooredoo Group 9 M 2018 Results | 23
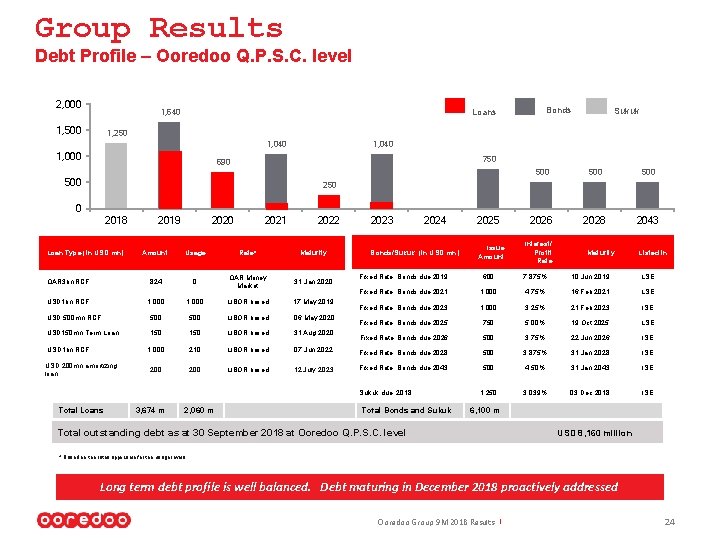
Group Results Debt Profile – Ooredoo Q. P. S. C. level 2, 000 1, 500 Bonds Loans 1, 640 Sukuk 1, 250 1, 040 1, 000 1, 040 750 690 500 500 2026 2028 2043 250 0 2018 Loan Type (in USD mn) 2019 2020 2021 2022 Amount Usage Rate* Maturity QAR 3 bn RCF 824 0 QAR Money Market 31 Jan 2020 USD 1 bn RCF 1, 000 LIBOR based 17 May 2019 USD 500 mn RCF 500 LIBOR based 06 May 2020 USD 150 mn Term Loan 150 LIBOR based 31 Aug 2020 1, 000 210 LIBOR based 07 Jun 2022 200 LIBOR based 12 July 2023 USD 1 bn RCF USD 200 mn amortizing loan 2023 2024 Bonds/Sukuk (in USD mn) 3, 674 m 2, 060 m Issue Amount Interest/ Profit Rate Maturity Listed in Fixed Rate Bonds due 2019 600 7. 875% 10 Jun 2019 LSE Fixed Rate Bonds due 2021 1, 000 4. 75% 16 Feb 2021 LSE Fixed Rate Bonds due 2023 1, 000 3. 25% 21 Feb 2023 ISE Fixed Rate Bonds due 2025 750 5. 00% 19 Oct 2025 LSE Fixed Rate Bonds due 2026 500 3. 75% 22 Jun 2026 ISE Fixed Rate Bonds due 2028 500 3. 875% 31 Jan 2028 ISE Fixed Rate Bonds due 2043 500 4. 50% 31 Jan 2043 ISE 1, 250 3. 039% 03 Dec 2018 ISE Sukuk due 2018 Total Loans 2025 Total Bonds and Sukuk 6, 100 m Total outstanding debt as at 30 September 2018 at Ooredoo Q. P. S. C. level USD 8, 160 million * Based on the rates applicable for the usage levels Long term debt profile is well balanced. Debt maturing in December 2018 proactively addressed Ooredoo Group 9 M 2018 Results | 24
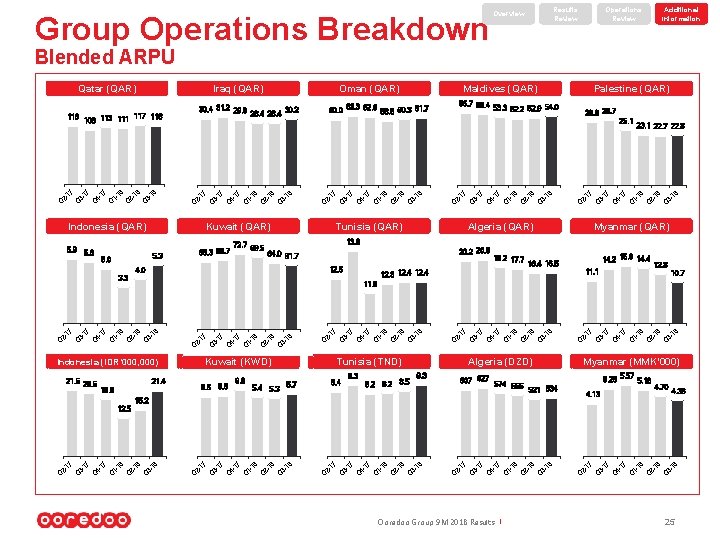
Group Operations Breakdown Results Review Overview Operations Review Additional Information Blended ARPU 18 18 3 - 18 2 - Q Q 1 - 17 23. 1 22. 7 22. 8 Q 17 4 - 3 - Q 17 2 Q Algeria (QAR) Q 18 18 3 Q 18 2 - 1 - Q 17 4 Q 17 3 - 2 - Q Q 18 18 3 - 18 2 - Q Q 17 1 Q 17 4 - 3 - Q Q 2 - 17 18 18 3 Q 18 2 - 17 1 - Q Q 17 4 Q 17 3 - 2 Q 28. 8 29. 7 Myanmar (QAR) 13. 8 20. 2 20. 8 64. 0 61. 7 18. 2 17. 7 14. 2 15. 0 14. 4 16. 5 11. 1 12. 3 12. 4 12. 8 10. 7 5. 5 18. 5 5. 5 6. 0 5. 4 8 31 8 8 21 Q Q 7 Q 11 41 7 31 Q Q 7 21 Q 8 8 31 Q 21 8 11 Q 7 41 Q 31 Q 7 21 Q 8 31 8 8 21 Q Q 7 11 Q 41 31 Q Q Kuwait (KWD) 21. 4 7 7 21 Q 8 8 31 Q 18 21 Q 7 Q 1 - 7 41 Q 31 Q Q 21 7 8 31 8 11. 9 21 8 Palestine (QAR) 56. 7 55. 4 53. 3 52. 2 52. 9 54. 0 58. 8 60. 3 61. 7 Tunisia (QAR) 12. 5 Indonesia (IDR’ 000, 000) 21. 5 20. 5 72. 7 69. 5 63. 3 62. 6 Maldives (QAR) 25. 1 4. 0 Q 7 11 Q 7 41 Q 31 Q 21 7 3. 3 Q 65. 3 66. 7 5. 3 5. 0 60. 0 Kuwait (QAR) Q 5. 6 Q 18 3 - 18 Q 18 2 Q 17 1 Q 17 4 Q 3 - 2 Q Indonesia (QAR) 5. 9 Oman (QAR) 30. 4 31. 2 29. 9 30. 2 28. 4 117 116 108 113 111 Q 17 116 Iraq (QAR) Q Qatar (QAR) Tunisia (TND) 5. 3 8. 4 5. 7 9. 3 8. 2 Algeria (DZD) 8. 5 9. 3 607 627 574 555 Myanmar (MMK’ 000) 5. 28 521 534 5. 57 5. 18 4. 13 15. 2 4. 70 4. 36 8 31 21 8 8 Q Q 7 11 Q 41 7 31 Q Q Q 21 7 8 8 31 Q 21 8 11 Ooredoo Group 9 M 2018 Results | Q 7 41 Q 31 Q 7 21 Q 8 31 8 8 21 Q Q 7 11 Q 41 7 31 Q Q 7 21 Q 8 8 31 Q 21 7 118 Q Q 7 41 Q 31 Q Q 21 7 8 31 8 8 21 Q Q 7 11 Q 7 41 Q 31 Q Q 21 7 12. 5 25
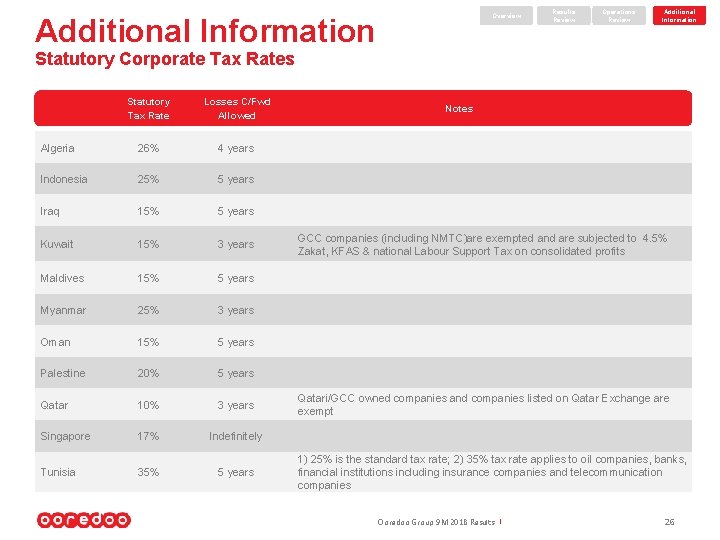
Overview Additional Information Results Review Operations Review Additional Information Statutory Corporate Tax Rates Statutory Tax Rate Losses C/Fwd Allowed Algeria 26% 4 years Indonesia 25% 5 years Iraq 15% 5 years Kuwait 15% 3 years Maldives 15% 5 years Myanmar 25% 3 years Oman 15% 5 years Palestine 20% 5 years Qatar 10% 3 years Singapore 17% Indefinitely Tunisia 35% 5 years Notes GCC companies (including NMTC)are exempted and are subjected to 4. 5% Zakat, KFAS & national Labour Support Tax on consolidated profits Qatari/GCC owned companies and companies listed on Qatar Exchange are exempt 1) 25% is the standard tax rate; 2) 35% tax rate applies to oil companies, banks, financial institutions including insurance companies and telecommunication companies Ooredoo Group 9 M 2018 Results | 26
Thank You Full year results 13 th February TBC Ooredoo Group 9 M 2018 Results |
- Slides: 27