Onroad emissions measured by chase techniques in China

On-road emissions measured by chase techniques in China An approach that can compliment PEMS, but not replace it! • Dane Westerdahl, Xing Wang and K. Max Zhang (PI) • Energy and the Environment Research Laboratory

How did we end up in China? • The Olympic Games and the opportunity it offered – Aggressive controls applied to a very polluted city • Two investigators from China • Good food and friends

Heroic controls placed on Beijing and the region as Olympics approached • Construction halted • New taxis replaced old ones • High emitting cars banned from city • Trucks largely banned from city • Odd/Even car use • New buses purchased • Industry closed • Coal burning replaced by natural gas • Cement plants and quarries closed • Dirt/debris covered • Landscape planted • Streets cleaned • No street bar b ques • Unconfirmed weather modification Most measures were implemented well before Games and had different start dates
 Truck Activity 1 Truck Activity 2 Truck")
Black Carbon Observations Summer community measurements (2007) Truck Activity 1 Truck Activity 2 Truck Activity 3 Truck Activity 4 Truck Activity 5 Truck Activity 6 Truck Activity refers to the period between 11: -00 pm and 6: 00 am. Beijing residents are exposed to much higher diesel particulate matter levels at night.

BC Comparison – I: Traffic-Control days vs. Non-Traffic-Control days Summer 2008 The significant increases of BC concentrations on NTC days demonstrate the positive impact of traffic control regulations in reducing BC emissions.

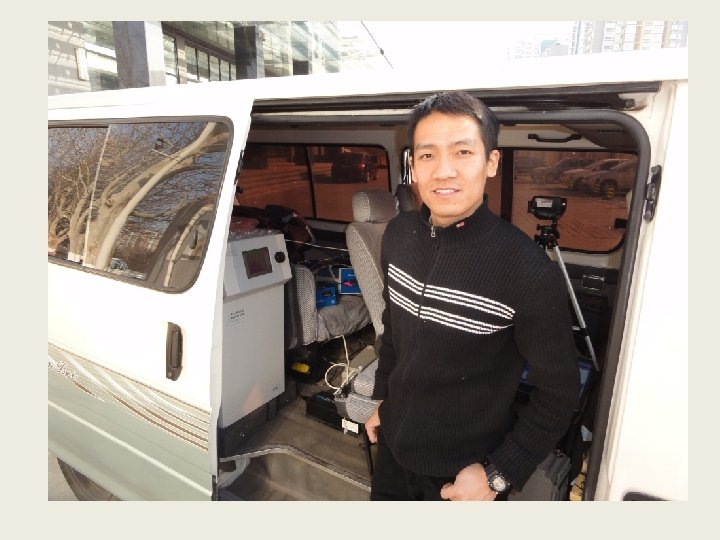
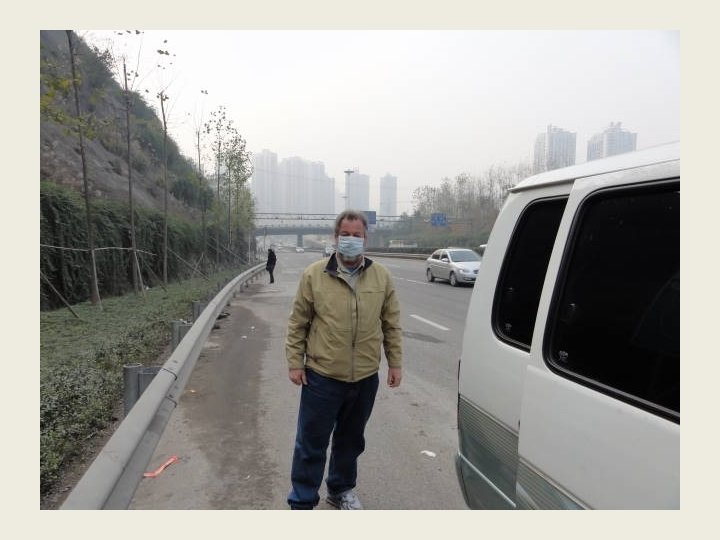
On-road Measurements in Beijing Studying emissions in the real world

Measuring On-road Emission Factors • The main objective of our research efforts is to obtain real-world emissions information using a mobile platform chasing method. • Our work demonstrates that this method can become a cost-effective way to determine mobile emission factors.

Methods to derive emission factors Methods Dynamometer PEMS On-road Chasing using mobile platform Advantages • Repeatable driving condition • Vehicle and engine conditions well characterized • Real-world driving conditions • Vehicle and engine conditions may be characterized • Lowest cost per vehicles • Real-world driving conditions • Real-world on-road vehicle population • Atmospheric dilution process Disadvantages • Highest cost per vehicle • Driving and dilution conditions * are artificial • Facilities are complex • Dilution conditions are artificial • Not time efficient for large diesel vehicles • Vehicles and engine conditions are less known (but may be acquired through license plates) • Driving conditions not controlled. (Also a strength*)

EERL Expertise in Mobile Platform Operation and Emission Factor Determination • 2003 -2006: Designed platform/conducted mobile platform measurements on-road, in community air, and near airport 1, 2 • 2005: Derived, for the first time, the size-resolved on-road particulate emission factors 3 • 2007: Measured fleet average on-road emission factors for cars and trucks in Beijing using mobile platform 4 • 2008: Measured fleet average and some individual emission factors for cars, trucks, and buses during Olympics using mobile platform 5 • 2009: Sampled 243 individual trucks and 57 individual buses in and around Beijing (within two weeks), and derived emission factor distributions 6 • 2010: Conducting emissions measurements in Beijing and Chongqing, focusing on NOx emissions 1 Westerdahl et al. (2005) Atmospheric Environment 2005, 39, (20), 3597 -3610. et al. (2008) Atmospheric Environment 2008, 42, (13), 3143 -3155. 3 Zhang et al. , (2005) Atmospheric Environment 2005, 39, (22), 4155 -4166. 4 Westerdahl et al. (2009) Atmospheric Environment 2009, 43, (3), 697 -705. 5 Wang et al. , (2009) Atmospheric Environment 2009, 43, 4535– 4543. 6 Wang et al. , (2010) Atmospheric Environment 2010, 44 2 Westerdahl
 • Micro. Aethalometer (Magee")
Chase study instruments • Fast Mobility Particle Sizer (TSI 3091) • Micro. Aethalometer (Magee Scientific AE 51) • CO/temp/humidity (Q-Trak (TSI 7545) • CO 2 analyzer (Vaisala Carbo. Cap GM 70) • NO analyzer (2 b Tech Model 410) • NOx converter (2 b Tech Model 401) • Computer datalogger • Video camera • Gps Time resolution— 10 seconds
 Atmospheric Environment")
Plume concentrations from a truck Wang et al. , (2010) Atmospheric Environment

Deriving Emission Factors based on Carbon Balance wc : mass fraction of carbon in fuel MW: molecular weight ∆: concentration increase =concrealtime – concbaseline Method used by Stedman for EF calculation from remote sensing and Harley in tunnel studies
 Atmospheric Environment")
EF distributions: ~250 Diesel Trucks Mean Value Wang et al. , (2010) Atmospheric Environment

BC EF distribution--Diesel Trucks* 5% 20% 5% heavy emitters responsible for 50% BC emissions 20% of trucks were responsible for 50% CO and PM number, 60% PM mass and 70% BC emissions Wang et al. , (2010) Atmospheric Environment

BC EF distribution: Buses by type BC EF of Euro IV and CNG buses were 70% and 75% , respectively, lower than Euro II buses Wang et al. , (2010) Atmospheric Environment

Particle size resolved PM concentration and emission factors for urban buses*

Objectives for December 2010 studies Expansion of successful field studies of winter 2009 where we sampled the emissions from over 250 on-road vehicles in and around Beijing • The main objective was to add NOx measurement and emission factors to our protocol • A second objective was to compare our emission measurements using the on-road chasing method to Portable Emissions Measurement System (PEMS) observations • Third objective was to expand chase studies to include a second city for chase studies

Routes-Chongqing A Inner Ring Expy Downtown B A-B: On-road truck chasing route (25. 1 km)
 5")
Routes-Beijing A D 6 th Ring Rd. Beijing. Chengde Expressway Beijing-Tibet Expressway(G 6) 5 th Ring Rd. C 4 th Ring Rd. A-B: On-road truck chasing route (48. 1 km) C-D: PEMS comparison chasing route (19. 7 km Expy+11. 4 Urban Road) B

December 2010 activities - Chongqing • On-road chasing study in Chongqing – Dec 21 -Dec 27, 2010 – Truck chased: 267 Date Route Trucks Chased Dec 21 Inner Ring Rd. 38 Dec 22 Inner Ring Rd. 60 Dec 23 Inner Ring Rd. 61 Dec 24 Inner Ring Rd. 11 Dec 26 Inner Ring Rd. 56 Dec 27 Inner Ring Rd. 41

Beautiful Chongqing Yangtze River and city skyline

December 2010 Activities - Beijing • On-road chasing study in Beijing – Dec 9 -Dec 14, 2010 – Trucks sampled: 195 • PEMS vs on-road chasing comparison study in Beijing – Dec 15 -Dec 17, 2010 – Three trucks Date Route Trucks Chased Date Dec 9 6 th Ring Rd. 26 Dec 15 Beijing-Chengdu Expy, 6 th Ring Road Dec 11 6 th Ring Rd. 55 Dec 16 Beijing-Chengdu Expy, Urban Road Dec 12 6 th Ring Rd. NOx Test Dec 17 Beijing-Chengdu Expy, Urban Road Dec 13 6 th Ring Rd. 55 Dec 14 6 th Ring Rd. 47 Dec 17 6 th Ring Rd. 12 Route

PEMS vs. on-road chasing comparison study Beijing—Initial focus on NOx data

Preliminary Results A high emitting truck in Chongqing

Preliminary Results Correlation between on-road NOx and CO 2 conc. 6000 5000 R 2 = 0. 75 NOx (ppb) 4000 3000 2000 1000 0 400 450 500 550 600 650 CO 2 (ppm) 700 750 800 850
 .")
Very Preliminary Results NOx emission factors PEMS vs. Chasing method (g/kg fuel) .

2010 Summary • On-road chasing methods were successfully implemented in Beijing and Chongqing. • On-road NOx, BC, CO 2, UFP data were collected for more than 400 diesel trucks. • The NOx emission factors derived from the onroad chasing method with speed calibration appear to be in good correlation with those from PEMS—still under construction. • On-going data analysis aims to add NOx emission factor distributions for on-road Chinese trucks.

Conclusions from On Road Studies • A time- and cost- effective approach allows us to sample a large number of trucks and buses – Real-world on-road emissions of areal-world vehicle population • Useful support for air pollution control measures: – Identify heavy emitters and implement emission reduction programs to control them – Need to improve fuel quality in entire region rather than specific cities* – Clean –burning buses work

Will Chase methods replace PEMS? NO—but • Allows consideration of real world PM – UFP size and numbers down to 5. 6 nm – Black carbon • Allows testing of many vehicles— 40 or 50 a day – Produces a better representation of on road fleet • Easy to set up and operate – But labor intensive to analyze • Ideal for use in developing world

Can Chase methods compliment PEMS? Yes • Quick means to generate emissions hypotheses • Screening tool for finding high emitters – Follow up with PEMS • Can be applied in areas far from lab support • New metrics/compounds can be added • Methods could be used together to generate better PM and black carbon emissions data

Acknowledgements • Dr. Zhenghua Li and Prof. Wu Ye at Tsinghua University • Prof. Xiaochuan Pan at Peking University School of Public Health • Dr. Jingnan Hu at Chinese Research Academy of Environmental Sciences • Mr. Jianjun Zheng at Chongqing Research Academy of Environmental Sciences • Although the research described has been funded wholly or in part by the USEPA contract EP-C-06 -003 to SRA International, it has not been subject to the Agency’s review and therefore does not necessarily reflect the views of the Agency, and no official endorsement should be inferred.

A better future for Beijing? Maybe, but traffic and traffic growth will remain a serious challenge for rest of China

Chongqing Ambient Black Carbon A tale of 2 cities Daytime truck traffic strongly reflected in Chongqing ambient air Beijing
- Slides: 35