
Online Social Media Sensing 1 Sensing the Physical


- Slides: 79
Online Social Media Sensing 1: Sensing the Physical and Social World CSE 40437/60437 -Spring 2015 Prof. Dong Wang
Online Social Media: A New Information Age Empower the analysts and decision makers to quickly understand ongoing events! Source: http: //www. signagesolutionsmag. com/article/unleashing-new-media-the-rise-of-the-social-media-command-center-15501
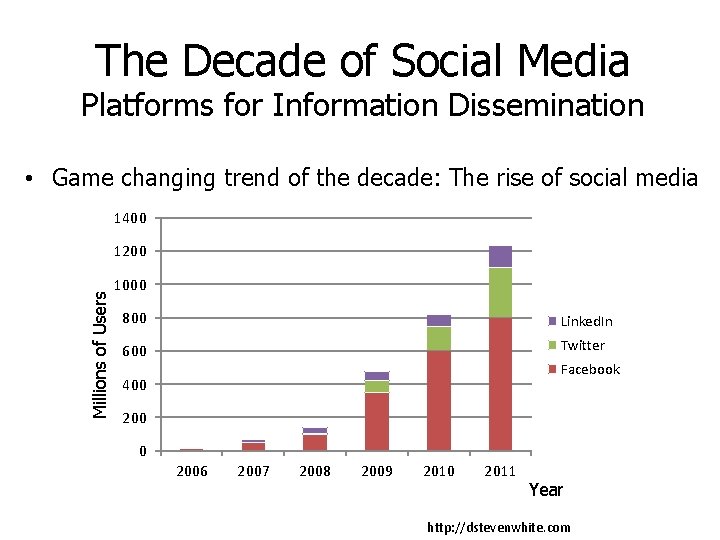
The Decade of Social Media Platforms for Information Dissemination • Game changing trend of the decade: The rise of social media 1400 Millions of Users 1200 1000 800 Linked. In 600 Twitter Facebook 400 2006 2007 2008 2009 2010 2011 Year http: //dstevenwhite. com
Social Media Statistics • Social media growth charts
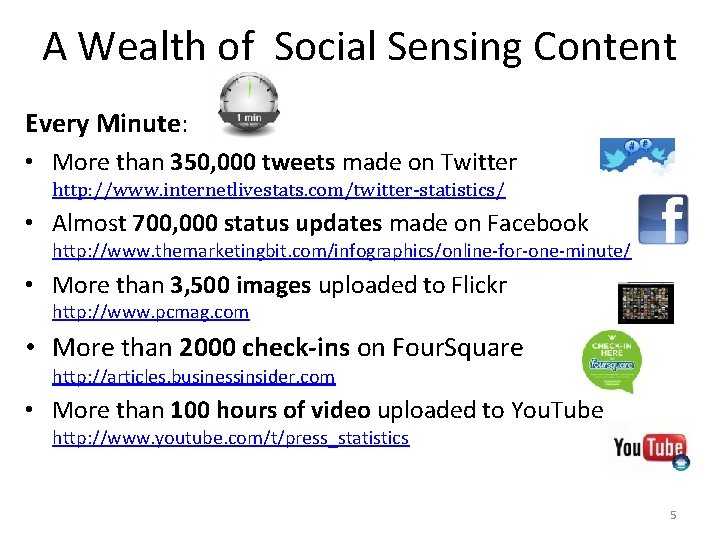
A Wealth of Social Sensing Content Every Minute: • More than 350, 000 tweets made on Twitter http: //www. internetlivestats. com/twitter-statistics/ • Almost 700, 000 status updates made on Facebook http: //www. themarketingbit. com/infographics/online-for-one-minute/ • More than 3, 500 images uploaded to Flickr http: //www. pcmag. com • More than 2000 check-ins on Four. Square http: //articles. businessinsider. com • More than 100 hours of video uploaded to You. Tube http: //www. youtube. com/t/press_statistics 5
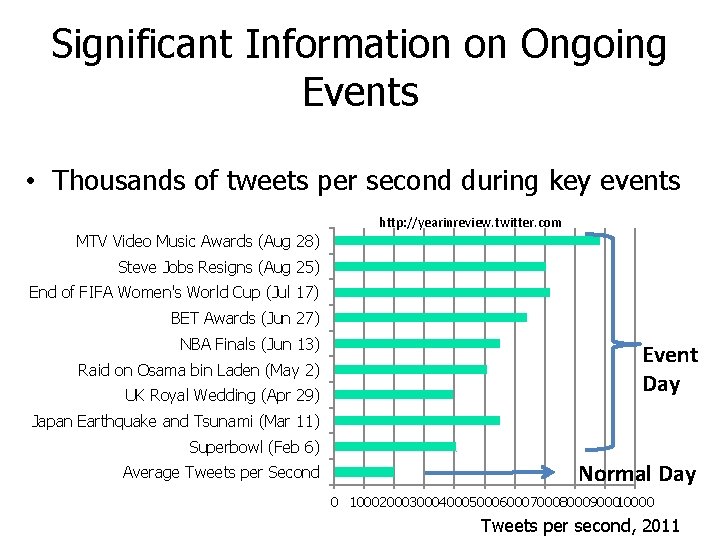
Significant Information on Ongoing Events • Thousands of tweets per second during key events http: //yearinreview. twitter. com MTV Video Music Awards (Aug 28) Steve Jobs Resigns (Aug 25) End of FIFA Women's World Cup (Jul 17) BET Awards (Jun 27) NBA Finals (Jun 13) Raid on Osama bin Laden (May 2) UK Royal Wedding (Apr 29) Event Day Japan Earthquake and Tsunami (Mar 11) Superbowl (Feb 6) Average Tweets per Second Normal Day 0 10002000300040005000600070008000900010000 Tweets per second, 2011
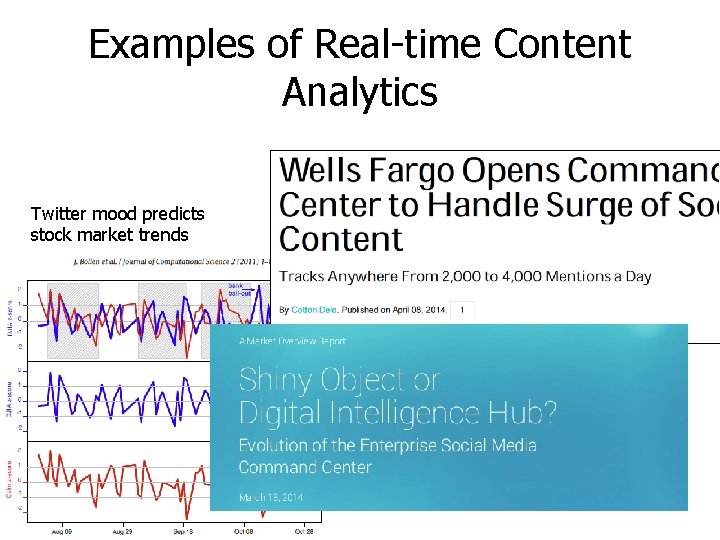
Examples of Real-time Content Analytics Twitter mood predicts stock market trends
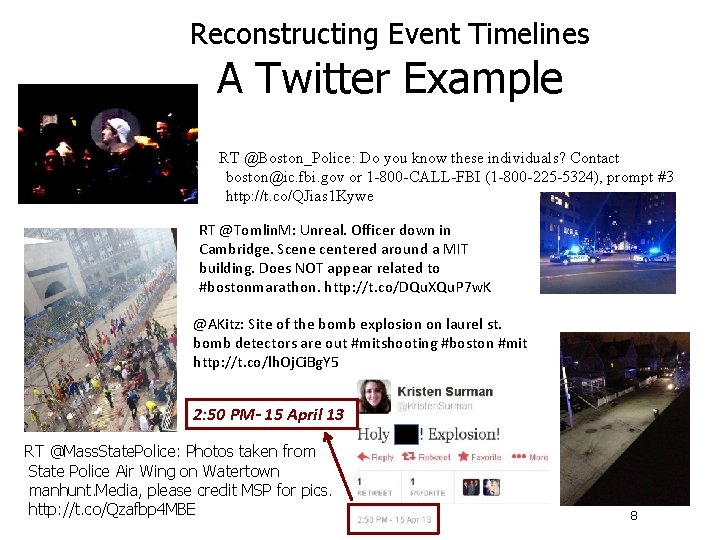
Reconstructing Event Timelines A Twitter Example RT @Boston_Police: Do you know these individuals? Contact boston@ic. fbi. gov or 1 -800 -CALL-FBI (1 -800 -225 -5324), prompt #3 http: //t. co/QJias 1 Kywe RT @Tomlin. M: Unreal. Officer down in Cambridge. Scene centered around a MIT building. Does NOT appear related to #bostonmarathon. http: //t. co/DQu. XQu. P 7 w. K @AKitz: Site of the bomb explosion on laurel st. bomb detectors are out #mitshooting #boston #mit http: //t. co/lh. Oj. Ci. Bg. Y 5 2: 50 PM- 15 April 13 RT @Mass. State. Police: Photos taken from State Police Air Wing on Watertown manhunt. Media, please credit MSP for pics. http: //t. co/Qzafbp 4 MBE 8
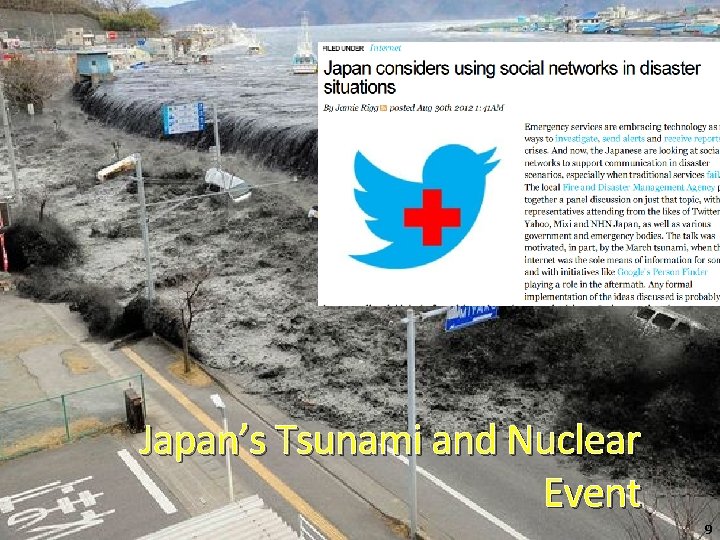
Japan’s tsunami 2011 Japan’s Tsunami and Nuclear Event 9
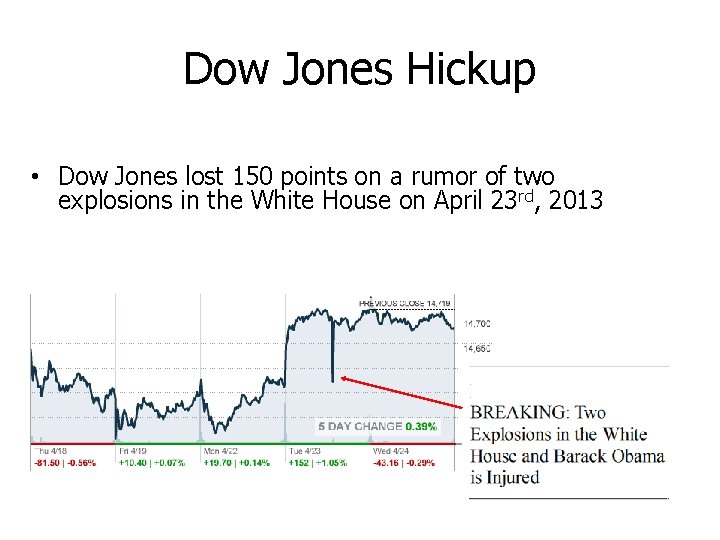
Dow Jones Hickup • Dow Jones lost 150 points on a rumor of two explosions in the White House on April 23 rd, 2013
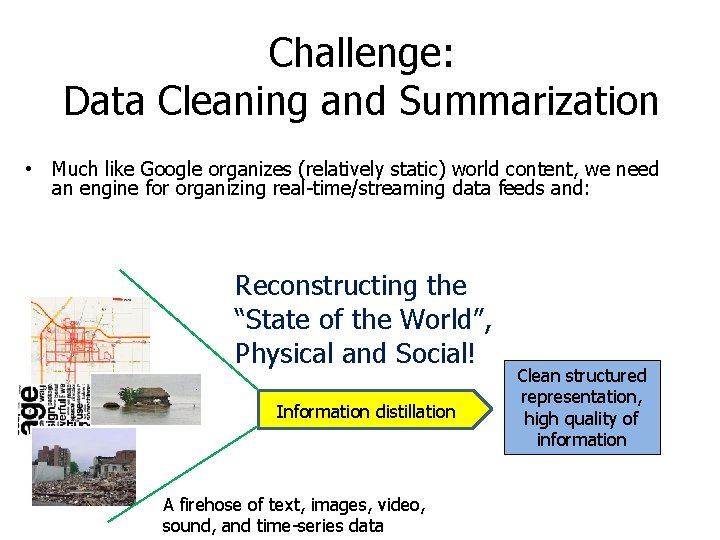
Challenge: Data Cleaning and Summarization • Much like Google organizes (relatively static) world content, we need an engine for organizing real-time/streaming data feeds and: Reconstructing the “State of the World”, Physical and Social! Information distillation A firehose of text, images, video, sound, and time-series data Clean structured representation, high quality of information
Papers discuss today Paper 1: "Earthquake shakes Twitter users: real-time event detection by social sensors. " Sakaki, Takeshi, Makoto Okazaki, and Yutaka Matsuo. Proceedings of the 19 th international conference on World wide web. ACM, 2010. Paper 2: "From tweets to polls: Linking text sentiment to public opinion time series. ” O'Connor, Brendan, et al. ICWSM 11 (2010): 122 -129.
Physical Events Paper 1: "Earthquake shakes Twitter users: realtime event detection by social sensors. " Sakaki, Takeshi, Makoto Okazaki, and Yutaka Matsuo. Proceedings of the 19 th international conference on World wide web. ACM, 2010.
Outline Introduction Event Detection Model Experiments And Evaluation Application Conclusions
What’s happening? • Twitter – is one of the most popular microblogging services – has received much attention recently • Microblogging – is a form of blogging • that allows users to send brief text updates – is a form of micromedia • that allows users to send photographs or audio clips • In this research, they focus on an important characteristic real-time nature
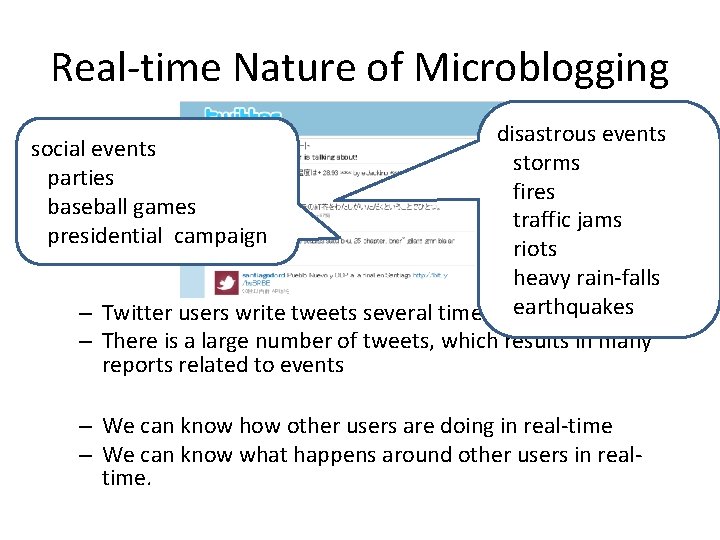
Real-time Nature of Microblogging disastrous events social events storms parties fires baseball games traffic jams presidential campaign riots heavy rain-falls – Twitter users write tweets several times inearthquakes a single day. – There is a large number of tweets, which results in many reports related to events – We can know how other users are doing in real-time – We can know what happens around other users in realtime.
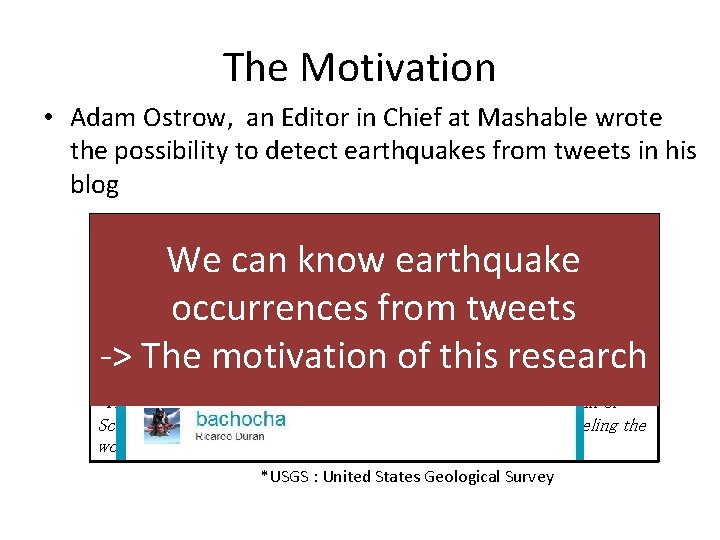
The Motivation • Adam Ostrow, an Editor in Chief at Mashable wrote the possibility to detect earthquakes from tweets in his blog Japan Earthquake Shakes Twitter Users. . . And Beyonce: We can know earthquake occurrences from tweets -> The motivation of this research Earthquakes are one thing you can bet on being covered on Twitter first, because, quite frankly, if the ground is shaking, you’re going to tweet about it before it even registers with the USGS* and long before it gets reported by the media. That seems to be the case again today, as the third earthquake in a week has hit Japan and its surrounding islands, about an hour ago. The first user we can find that tweeted about it was Ricardo Duran of Scottsdale, AZ, who, judging from his Twitter feed, has been traveling the world, arriving in Japan yesterday. *USGS : United States Geological Survey
The Goals • Propose an algorithm to detect a target event – do semantic analysis on Tweet • to obtain tweets on the target event precisely – regard Twitter user as a sensor • to detect the target event • to estimate location of the target • Produce a probabilistic spatio-temporal model for – event detection – location estimation • Propose Earthquake Reporting System using Japanese tweets
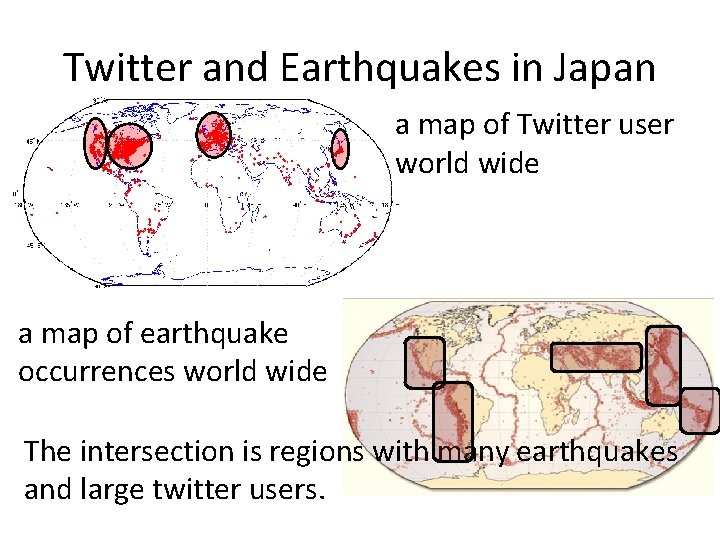
Twitter and Earthquakes in Japan a map of Twitter user world wide a map of earthquake occurrences world wide The intersection is regions with many earthquakes and large twitter users.
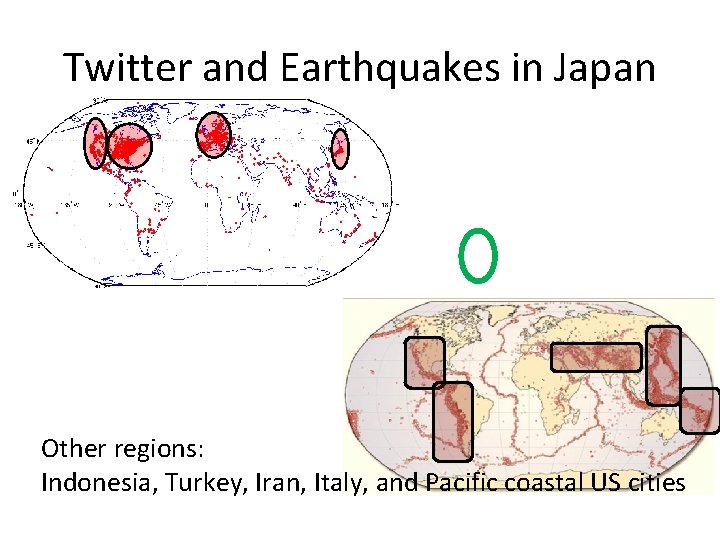
Twitter and Earthquakes in Japan Other regions: Indonesia, Turkey, Iran, Italy, and Pacific coastal US cities
Event detection algorithms • Do semantic analysis on Tweet – to obtain tweets on the target event precisely • Consider a Twitter user as a sensor – to detect the target event – to estimate location of the target
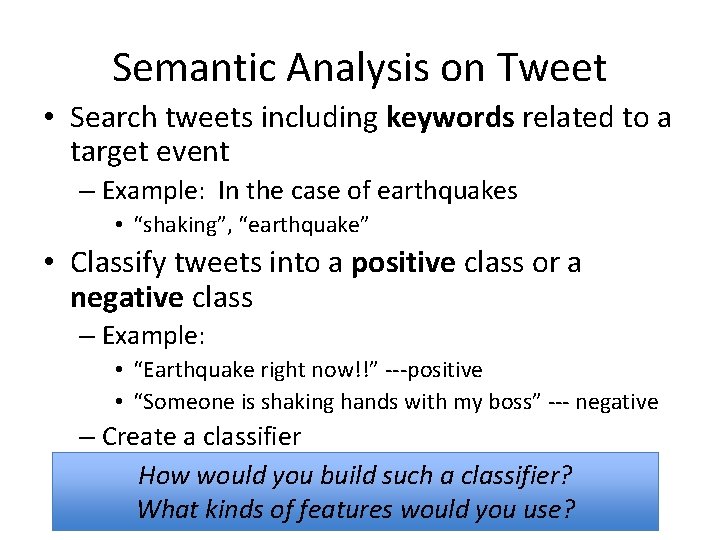
Semantic Analysis on Tweet • Search tweets including keywords related to a target event – Example: In the case of earthquakes • “shaking”, “earthquake” • Classify tweets into a positive class or a negative class – Example: • “Earthquake right now!!” ---positive • “Someone is shaking hands with my boss” --- negative – Create a classifier How would you build such a classifier? What kinds of features would you use?
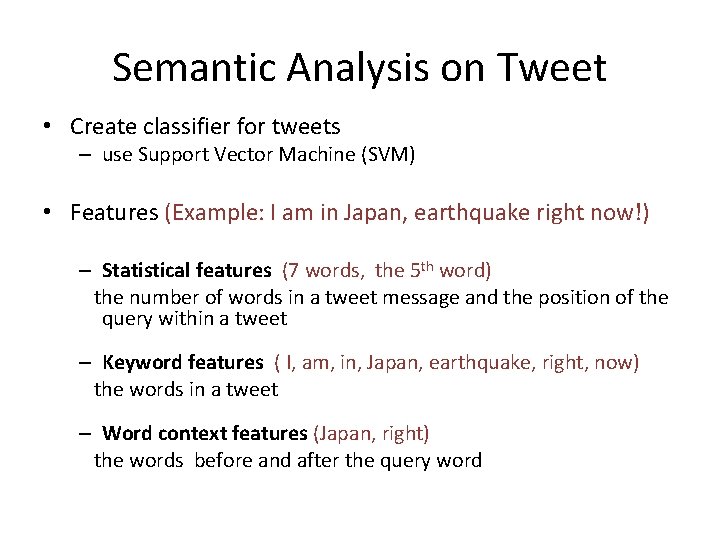
Semantic Analysis on Tweet • Create classifier for tweets – use Support Vector Machine (SVM) • Features (Example: I am in Japan, earthquake right now!) – Statistical features (7 words, the 5 th word) the number of words in a tweet message and the position of the query within a tweet – Keyword features ( I, am, in, Japan, earthquake, right, now) the words in a tweet – Word context features (Japan, right) the words before and after the query word
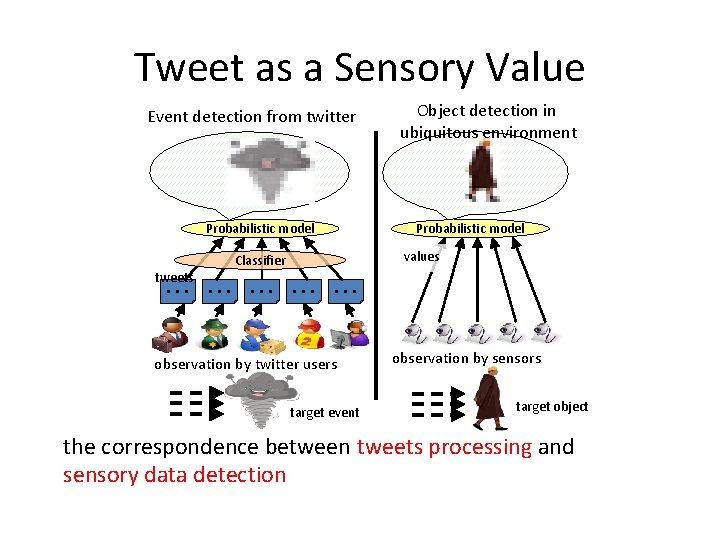
Tweet as a Sensory Value Event detection from twitter Probabilistic model Object detection in ubiquitous environment Probabilistic model values Classifier tweets ・・・ ・・・ ・・・ observation by twitter users target event observation by sensors target object the correspondence between tweets processing and sensory data detection
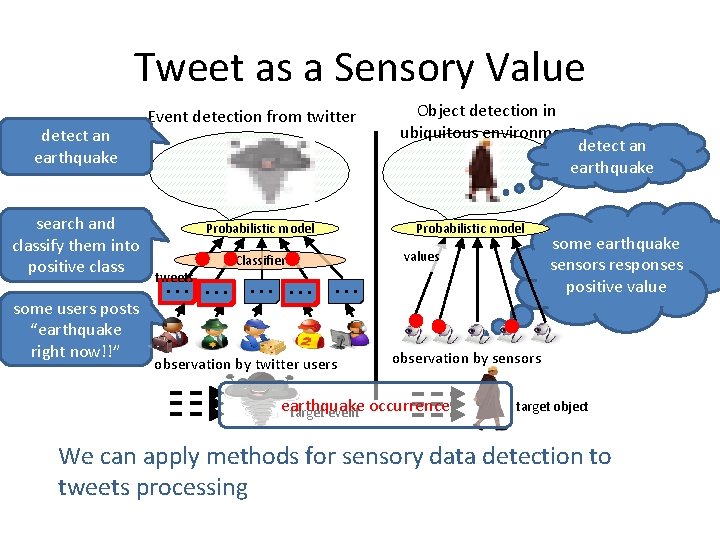
Tweet as a Sensory Value detect an earthquake search and classify them into positive class some users posts “earthquake right now!!” Event detection from twitter Object detection in ubiquitous environment detect an earthquake Probabilistic model values Classifier tweets ・・・ ・・・ ・・・ observation by twitter users some earthquake sensors responses positive value observation by sensors earthquake target event occurrence target object We can apply methods for sensory data detection to tweets processing
Tweet as a Sensory Value • Assumption 1: Each Twitter user is regarded as a sensor The location assumption – a tweet →a sensor reading may not always hold: 1. tweets may have – a. Very sensorfew detects a target event andgeo-locations makes a report probabilistically embedded. – Example: 2. The user’s may not match the • make a tweetprofile about anlocation earthquake occurrence • “earthquake sensor” a positive value exact location ofreturn the user. • Assumption 2: Each tweet is associated with a time and location – a time : post time – location : GPS data or location information in user’s profile Processing the time and location information of the positive tweets, we can detect target events and estimate location of target events
Probabilistic Model • Why we need probabilistic models? – Sensor values are noisy and sometimes sensors work incorrectly (e. g. , unreliable human sources and nonperfect classifier) – We cannot judge whether a target event occurred or not from a single tweet – We have to calculate the probability of an event occurrence from a series of data • Propose a probabilistic model for – event detection from time-series data – location estimation from a series of spatial information
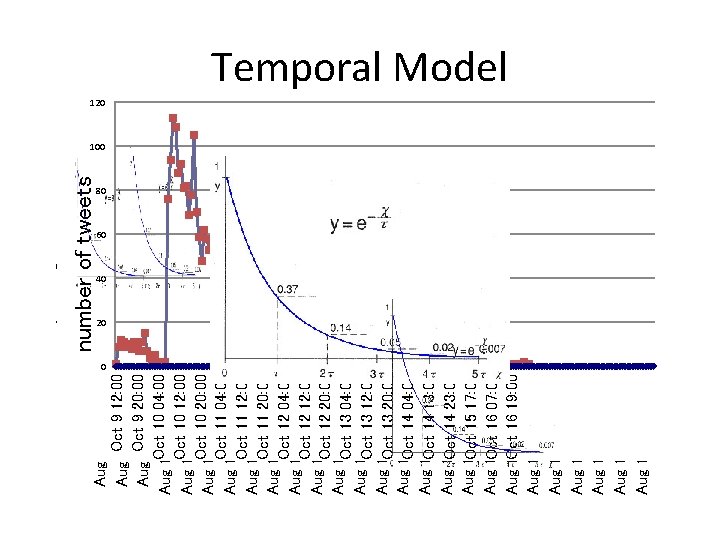
Temporal Model • Calculate the probability of an event occurrence from multiple sensor values • Examine the actual time-series data to create a temporal model
160 120 40 20 0 Aug 9 00: 00 9 12: 00 Aug 9 Oct 08: 00 9 20: 00 Aug 9 Oct 16: 00 Oct 10 04: 00 Aug 10 00: 00 Oct 10 12: 00 Aug 10 08: 00 Oct 10 20: 00 Aug 10 16: 00 Oct 11 04: 00 Aug 11 00: 00 Oct 11 12: 00 Aug 11 08: 00 Oct 11 20: 00 Aug 11 16: 00 Oct 12 04: 00 Aug 12 00: 00 Oct 12 12: 00 Aug 12 08: 00 Oct 12 20: 00 Aug 12 16: 00 Oct 13 04: 00 Aug 13 00: 00 Oct 13 12: 00 Aug 13 08: 00 Oct 13 20: 00 Aug 13 16: 00 Oct 14 04: 00 Aug 14 00: 00 Oct 14 13: 00 Aug 14 08: 00 Oct 14 23: 00 Aug 14 16: 00 Oct 15 17: 00 Aug 15 00: 00 Oct 16 07: 00 Aug 15 08: 00 Oct 16 19: 00 Aug 15 16: 00 Aug 16 00: 00 Aug 16 08: 00 Aug 16 16: 00 Aug 17 00: 00 Aug 17 08: 00 number of tweets Temporal Model 120 140 100 80 100 60 80 60 40 20 0
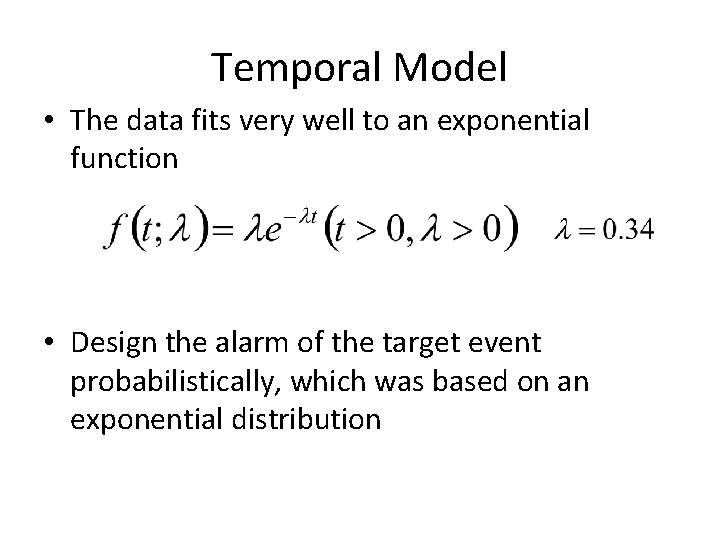
Temporal Model • The data fits very well to an exponential function • Design the alarm of the target event probabilistically, which was based on an exponential distribution
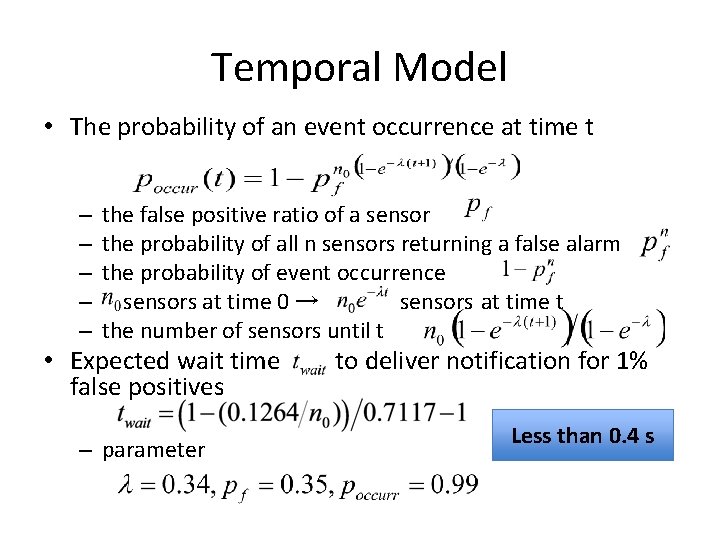
Temporal Model • The probability of an event occurrence at time t – – – the false positive ratio of a sensor the probability of all n sensors returning a false alarm the probability of event occurrence sensors at time 0 → sensors at time t the number of sensors until t • Expected wait time false positives – parameter to deliver notification for 1% Less than 0. 4 s
Spatial Model • We must calculate the probability distribution of location of a target • We apply Bayes filters to this problem which are often used in location estimation by sensors – Kalman Filers – Particle Filters
Bayesian Filters for Location Estimation • Kalman Filters – are the most widely used variant of Bayes filters – approximate the probability distribution which is virtually identical to a uni-modal Gaussian representation – advantages: the computational efficiency – disadvantages: being limited to accurate sensors or sensors with high update rates
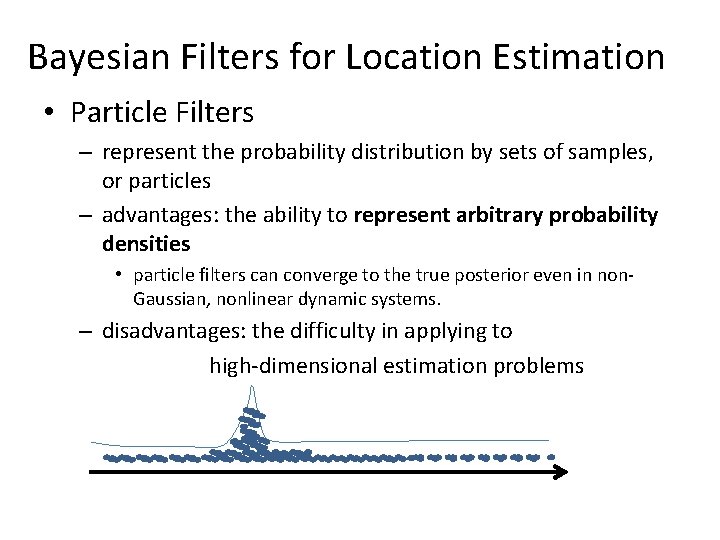
Bayesian Filters for Location Estimation • Particle Filters – represent the probability distribution by sets of samples, or particles – advantages: the ability to represent arbitrary probability densities • particle filters can converge to the true posterior even in non. Gaussian, nonlinear dynamic systems. – disadvantages: the difficulty in applying to high-dimensional estimation problems
A Short Intro on Particle Filter A short tutorial: http: //www. it. uu. se/katalog/andsv 164
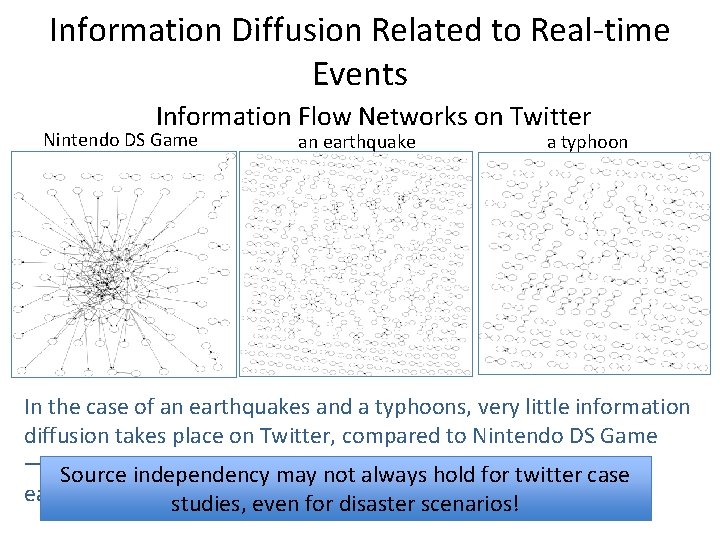
Information Diffusion Related to Real-time Events • Proposed spatiotemporal models need to meet one condition that – Sensors are assumed to be independent • We check if information diffusions about target events happen because – if an information diffusion happened among users, Twitter user sensors are not independent. They affect each other
Information Diffusion Related to Real-time Events Information Flow Networks on Twitter Nintendo DS Game an earthquake a typhoon In the case of an earthquakes and a typhoons, very little information diffusion takes place on Twitter, compared to Nintendo DS Game → We assume that Twittermay user sensors independent Source independency not alwaysare hold for twitter about case earthquakes and typhoons studies, even for disaster scenarios!
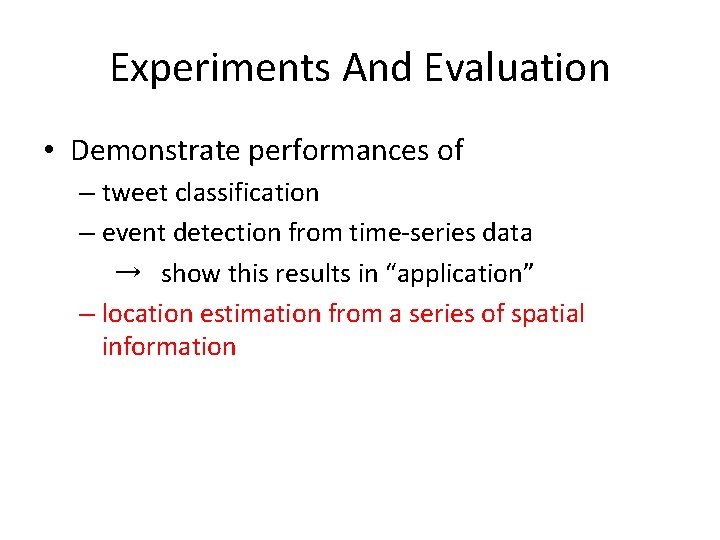
Experiments And Evaluation • Demonstrate performances of – tweet classification – event detection from time-series data → show this results in “application” – location estimation from a series of spatial information
Evaluation of Semantic Analysis • Queries – Earthquake query: “shaking” and “earthquake” – Typhoon query: ”typhoon” • • Examples to create classifier – 597 positive examples
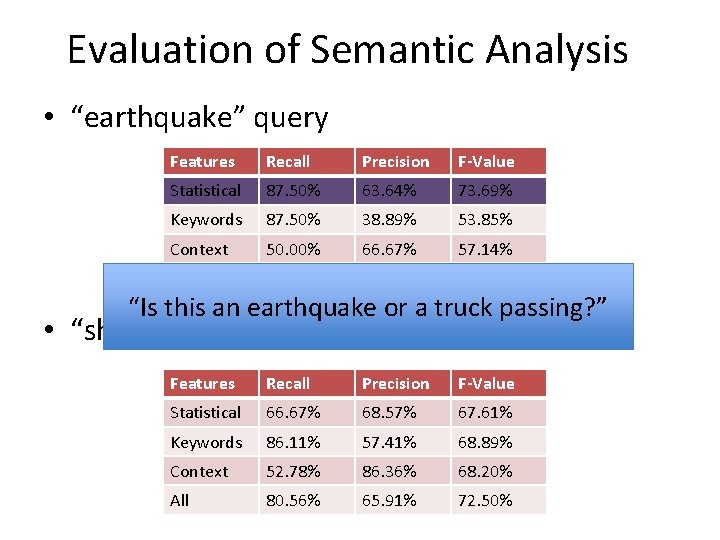
Evaluation of Semantic Analysis • “earthquake” query Features Recall Precision F-Value Statistical 87. 50% 63. 64% 73. 69% Keywords 87. 50% 38. 89% 53. 85% Context 50. 00% 66. 67% 57. 14% All 87. 50% 63. 64% 73. 69% “Is this an earthquake or a truck passing? ” • “shaking” query Features Recall Precision F-Value Statistical 66. 67% 68. 57% 67. 61% Keywords 86. 11% 57. 41% 68. 89% Context 52. 78% 86. 36% 68. 20% All 80. 56% 65. 91% 72. 50%
Experiments And Evaluation • Demonstrate performances of – tweet classification – event detection from time-series data → show this results in “application” – location estimation from a series of spatial information
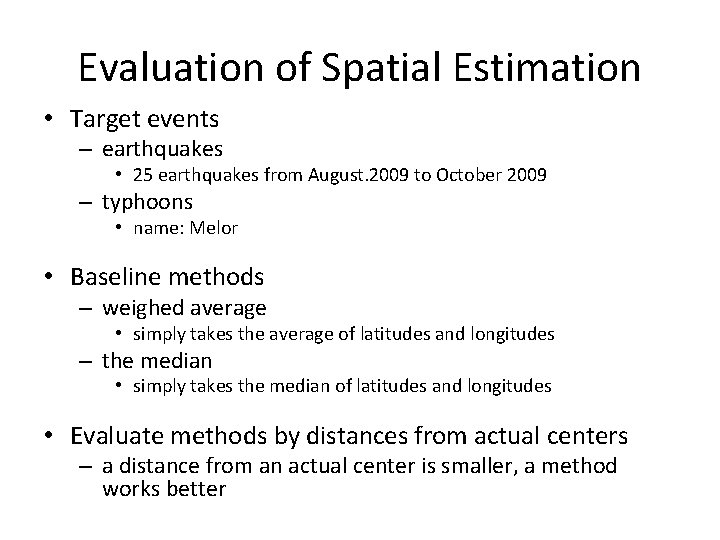
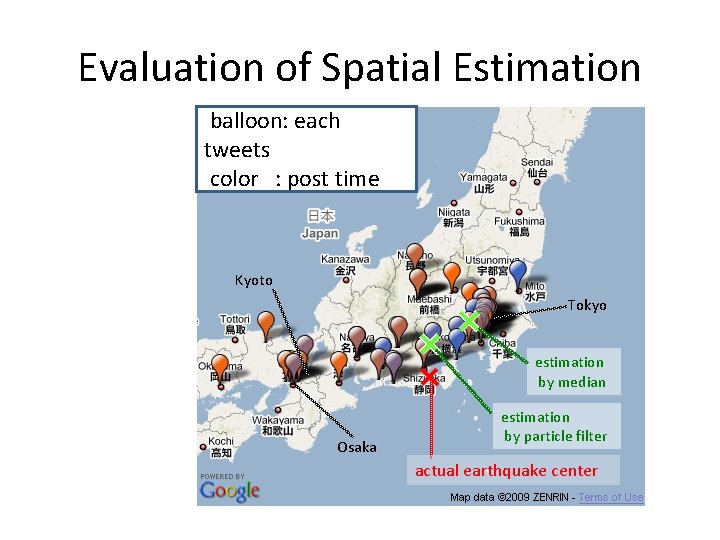
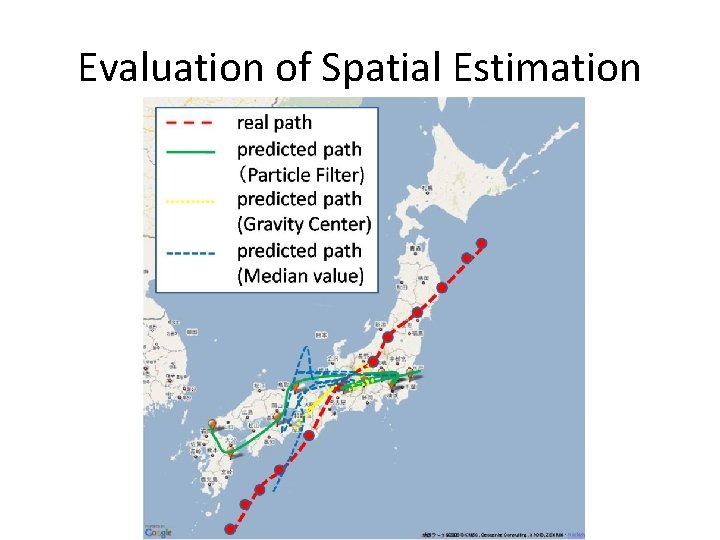
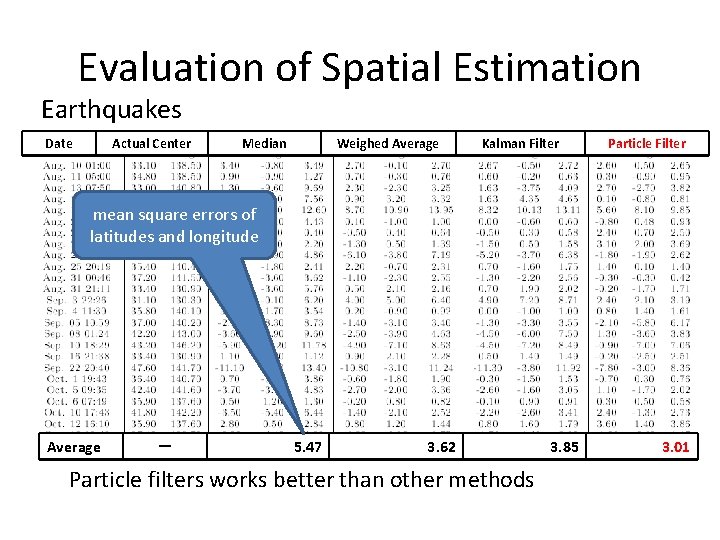
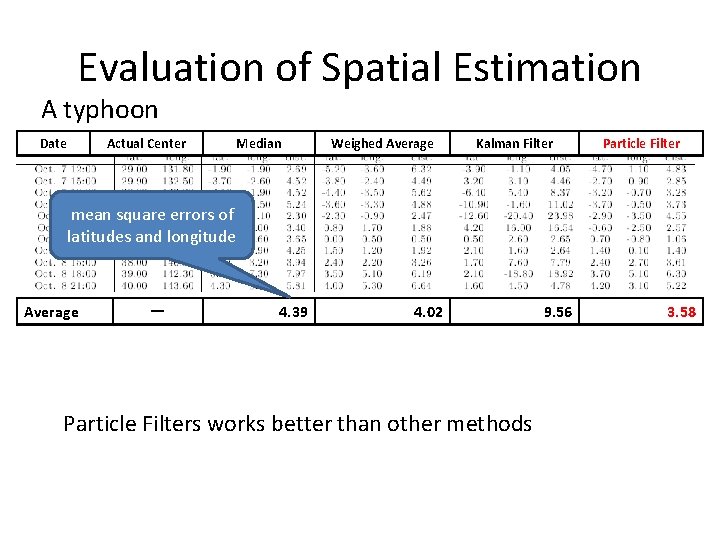
Evaluation of Spatial Estimation • Target events – earthquakes • 25 earthquakes from August. 2009 to October 2009 – typhoons • name: Melor • Baseline methods – weighed average • simply takes the average of latitudes and longitudes – the median • simply takes the median of latitudes and longitudes • Evaluate methods by distances from actual centers – a distance from an actual center is smaller, a method works better
Evaluation of Spatial Estimation balloon: each tweets color : post time Kyoto Tokyo estimation by median Osaka estimation by particle filter actual earthquake center
Evaluation of Spatial Estimation
Evaluation of Spatial Estimation Earthquakes Date Actual Center Median Weighed Average Kalman Filter Particle Filter mean square errors of latitudes and longitude Average - 5. 47 3. 62 Particle filters works better than other methods 3. 85 3. 01
Evaluation of Spatial Estimation A typhoon Date Actual Center Median Weighed Average Kalman Filter Particle Filter mean square errors of latitudes and longitude Average - 4. 39 4. 02 Particle Filters works better than other methods 9. 56 3. 58
Discussions of Experiments • Particle filters performs better than other methods • If the center of a target event is in an oceanic area, it’s more difficult to locate it precisely from tweets • It becomes more difficult to make good estimation in less populated areas
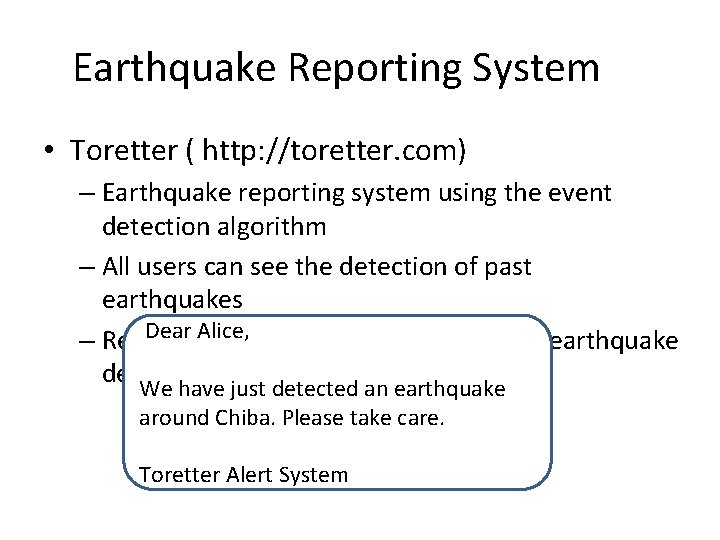
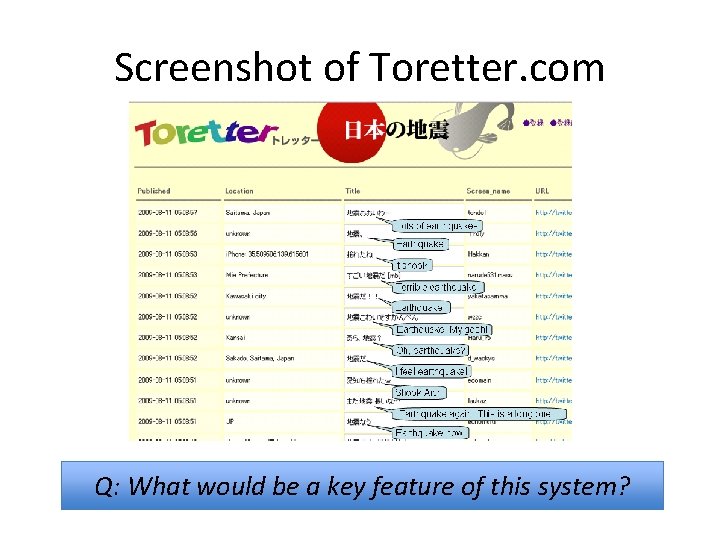
Earthquake Reporting System • Toretter ( http: //toretter. com) – Earthquake reporting system using the event detection algorithm – All users can see the detection of past earthquakes Dear Alice, – Registered users can receive e-mails of earthquake detection reports We have just detected an earthquake around Chiba. Please take care. Toretter Alert System
Screenshot of Toretter. com Q: What would be a key feature of this system?
Earthquake Reporting System • Effectiveness of alerts of this system – Alert E-mails urges users to prepare for the earthquake if they are received by a user shortly before the earthquake actually arrives. • Is it possible to receive the e-mail before the earthquake actually arrives? – An earthquake is transmitted through the earth's crust at about 3~7 km/s. – a person has about 20~30 sec before its arrival at a point that is 100 km distant from an actual center
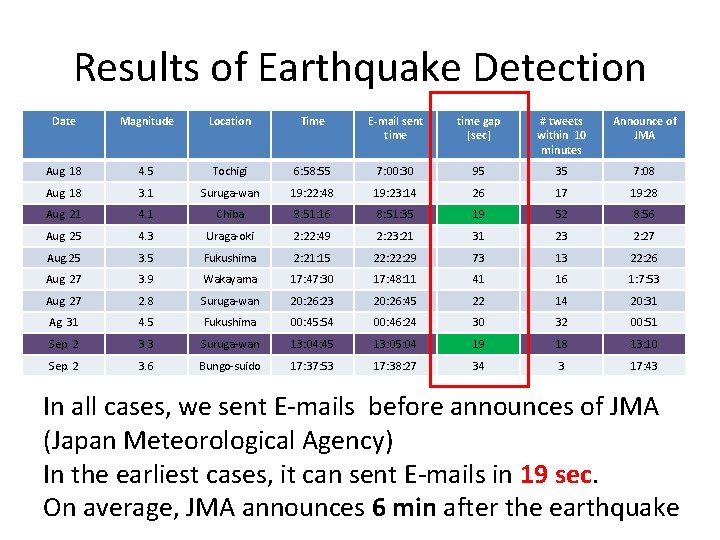
Results of Earthquake Detection Date Magnitude Location Time E-mail sent time gap [sec] # tweets within 10 minutes Announce of JMA Aug. 18 4. 5 Tochigi 6: 58: 55 7: 00: 30 95 35 7: 08 Aug. 18 3. 1 Suruga-wan 19: 22: 48 19: 23: 14 26 17 19: 28 Aug. 21 4. 1 Chiba 8: 51: 16 8: 51: 35 19 52 8: 56 Aug. 25 4. 3 Uraga-oki 2: 22: 49 2: 23: 21 31 23 2: 27 Aug. 25 3. 5 Fukushima 2: 21: 15 22: 29 73 13 22: 26 Aug. 27 3. 9 Wakayama 17: 47: 30 17: 48: 11 41 16 1: 7: 53 Aug. 27 2. 8 Suruga-wan 20: 26: 23 20: 26: 45 22 14 20: 31 Ag. 31 4. 5 Fukushima 00: 45: 54 00: 46: 24 30 32 00: 51 Sep. 2 3. 3 Suruga-wan 13: 04: 45 13: 05: 04 19 18 13: 10 Sep. 2 3. 6 Bungo-suido 17: 37: 53 17: 38: 27 34 3 17: 43 In all cases, we sent E-mails before announces of JMA (Japan Meteorological Agency) In the earliest cases, it can sent E-mails in 19 sec. On average, JMA announces 6 min after the earthquake
Experiments And Evaluation • We demonstrate performances of – tweet classification – event detection from time-series data → show this results in “application” – location estimation from a series of spatial information
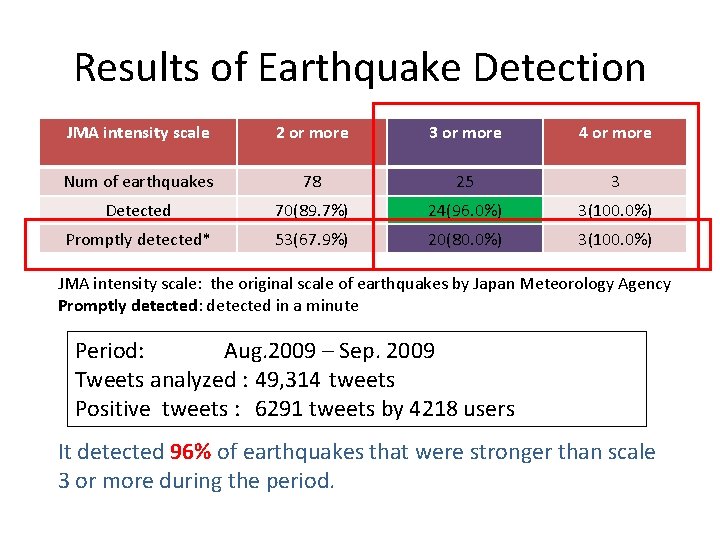
Results of Earthquake Detection JMA intensity scale 2 or more 3 or more 4 or more Num of earthquakes 78 25 3 Detected 70(89. 7%) 24(96. 0%) 3(100. 0%) Promptly detected* 53(67. 9%) 20(80. 0%) 3(100. 0%) JMA intensity scale: the original scale of earthquakes by Japan Meteorology Agency Promptly detected: detected in a minute Period: Aug. 2009 – Sep. 2009 Tweets analyzed : 49, 314 tweets Positive tweets : 6291 tweets by 4218 users It detected 96% of earthquakes that were stronger than scale 3 or more during the period.
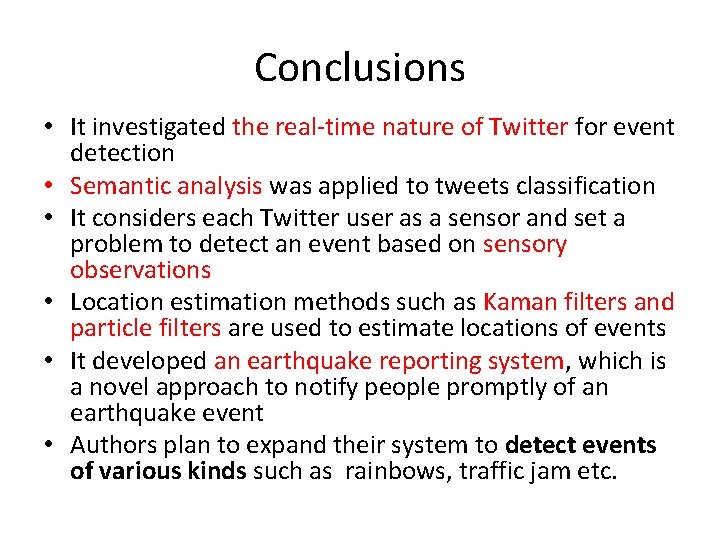
Conclusions • It investigated the real-time nature of Twitter for event detection • Semantic analysis was applied to tweets classification • It considers each Twitter user as a sensor and set a problem to detect an event based on sensory observations • Location estimation methods such as Kaman filters and particle filters are used to estimate locations of events • It developed an earthquake reporting system, which is a novel approach to notify people promptly of an earthquake event • Authors plan to expand their system to detect events of various kinds such as rainbows, traffic jam etc.
Social Events Paper 2: "From tweets to polls: Linking text sentiment to public opinion time series. ” O'Connor, Brendan, et al. ICWSM 11 (2010): 122 -129.
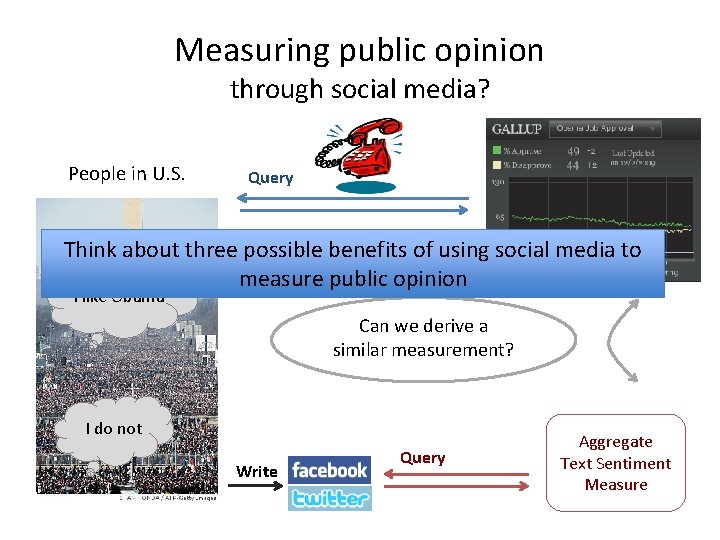
Measuring public opinion through social media? People in U. S. Query Think about three possible benefits of using social media to measure public opinion I like Obama Can we derive a similar measurement? I do not Write Query Aggregate Text Sentiment Measure
Contributions • Correlations between 1. Very simple text sentiment analysis 2. Telephone public opinion polls • Consumer confidence and Presidential job approval • Negative results as well! • Also – Time-series smoothing is a critical issue – Topic selection, topic volumes, text leads polls, stemming, election polling
Text Data: Twitter • A large and public social media service – People volunteer their thoughts on various topics at a large scale • Sources 1. Archiving the Twitter Streaming API “Gardenhose”/”Sample”: ~10 -15% of public tweets 2. Scrape of earlier messages • ~2 billion messages before topic selection, Jan 2008 – May 2010 It did not justify tweet users are good representations of the general population.
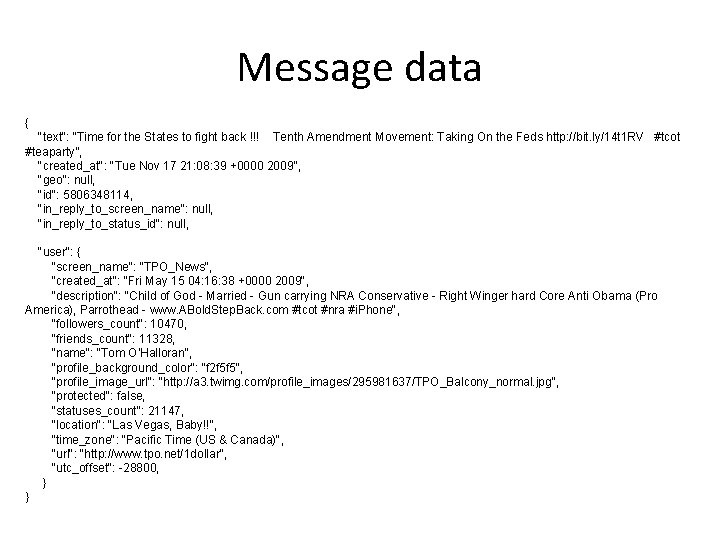
Message data { "text": "Time for the States to fight back !!! Tenth Amendment Movement: Taking On the Feds http: //bit. ly/14 t 1 RV #tcot #teaparty”, "created_at": "Tue Nov 17 21: 08: 39 +0000 2009", "geo": null, "id": 5806348114, "in_reply_to_screen_name": null, "in_reply_to_status_id": null, "user": { "screen_name": "TPO_News", "created_at": "Fri May 15 04: 16: 38 +0000 2009", "description": "Child of God - Married - Gun carrying NRA Conservative - Right Winger hard Core Anti Obama (Pro America), Parrothead - www. ABold. Step. Back. com #tcot #nra #i. Phone", "followers_count": 10470, "friends_count": 11328, "name": "Tom O'Halloran", "profile_background_color": "f 2 f 5 f 5", "profile_image_url": "http: //a 3. twimg. com/profile_images/295981637/TPO_Balcony_normal. jpg", "protected": false, "statuses_count": 21147, "location": "Las Vegas, Baby!!", "time_zone": "Pacific Time (US & Canada)", "url": "http: //www. tpo. net/1 dollar", "utc_offset": -28800, } }
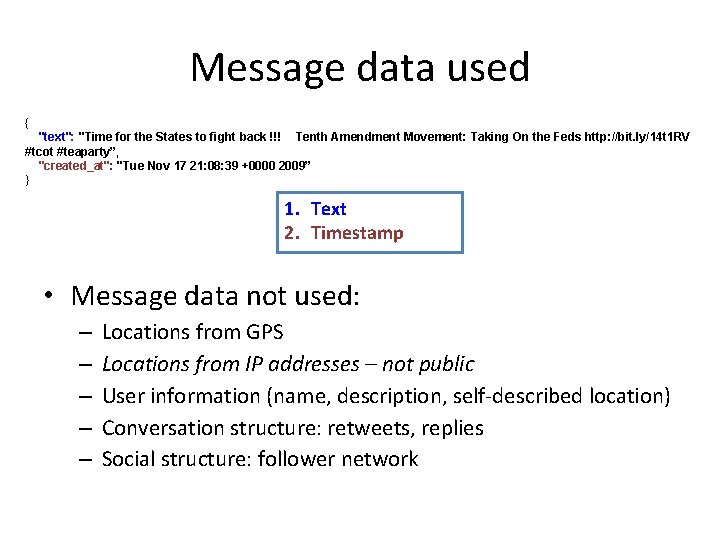
Message data used { "text": "Time for the States to fight back !!! Tenth Amendment Movement: Taking On the Feds http: //bit. ly/14 t 1 RV #tcot #teaparty”, "created_at": "Tue Nov 17 21: 08: 39 +0000 2009” } 1. Text 2. Timestamp • Message data not used: – – – Locations from GPS Locations from IP addresses – not public User information (name, description, self-described location) Conversation structure: retweets, replies Social structure: follower network
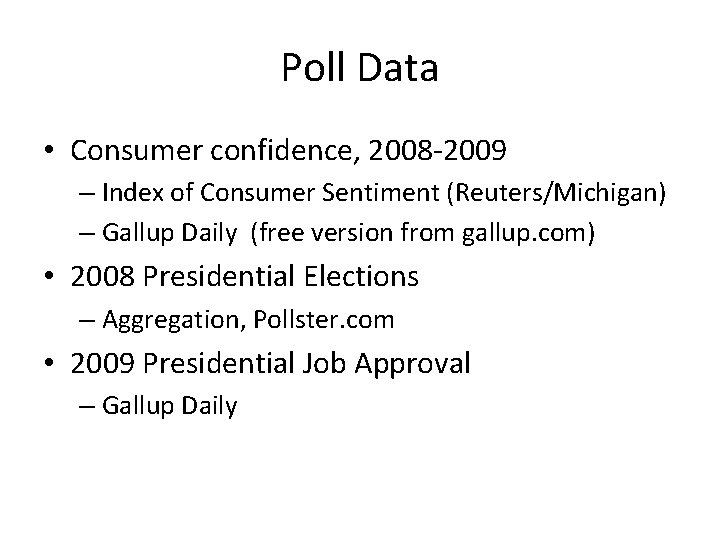
Poll Data • Consumer confidence, 2008 -2009 – Index of Consumer Sentiment (Reuters/Michigan) – Gallup Daily (free version from gallup. com) • 2008 Presidential Elections – Aggregation, Pollster. com • 2009 Presidential Job Approval – Gallup Daily
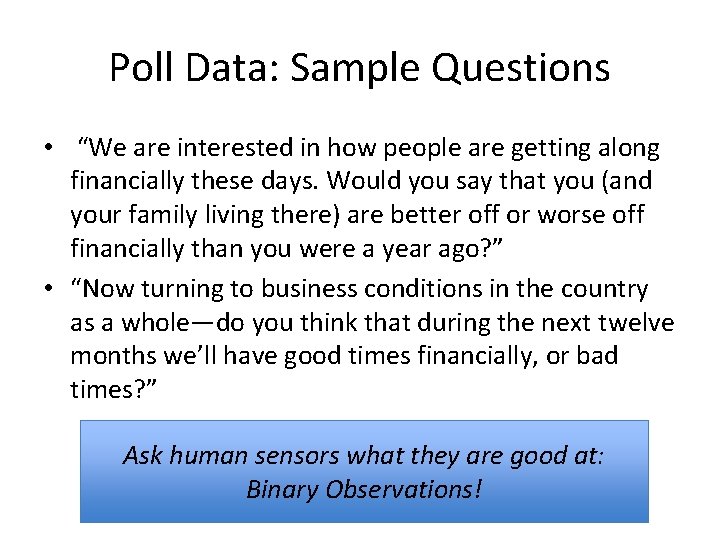
Poll Data: Sample Questions • “We are interested in how people are getting along financially these days. Would you say that you (and your family living there) are better off or worse off financially than you were a year ago? ” • “Now turning to business conditions in the country as a whole—do you think that during the next twelve months we’ll have good times financially, or bad times? ” Ask human sensors what they are good at: Binary Observations!
Text sentiment analysis method • Two-stage process 1. Topic Selection: select topical tweets, via handselected keywords 2. Sentiment Analysis: For one topic’s messages, count “sentiment polarity” words, from preexisting lexicon (More sophisticated methods are possible, for both stages)
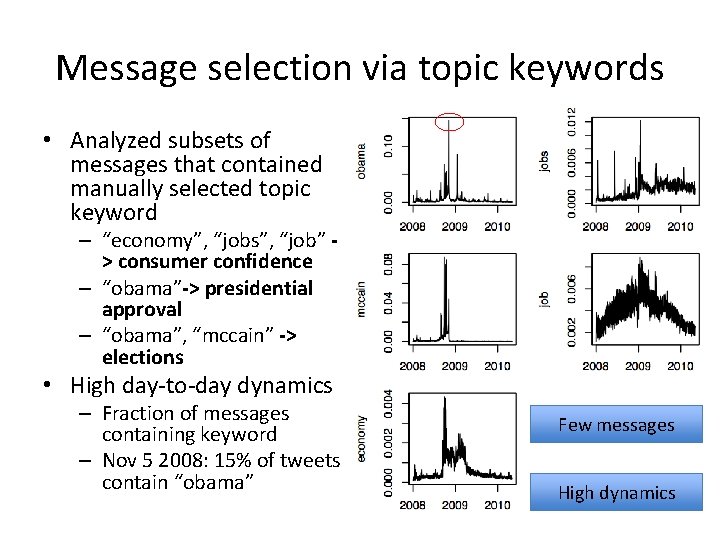
Message selection via topic keywords • Analyzed subsets of messages that contained manually selected topic keyword – “economy”, “jobs”, “job” > consumer confidence – “obama”-> presidential approval – “obama”, “mccain” -> elections • High day-to-day dynamics – Fraction of messages containing keyword – Nov 5 2008: 15% of tweets contain “obama” Few messages High dynamics
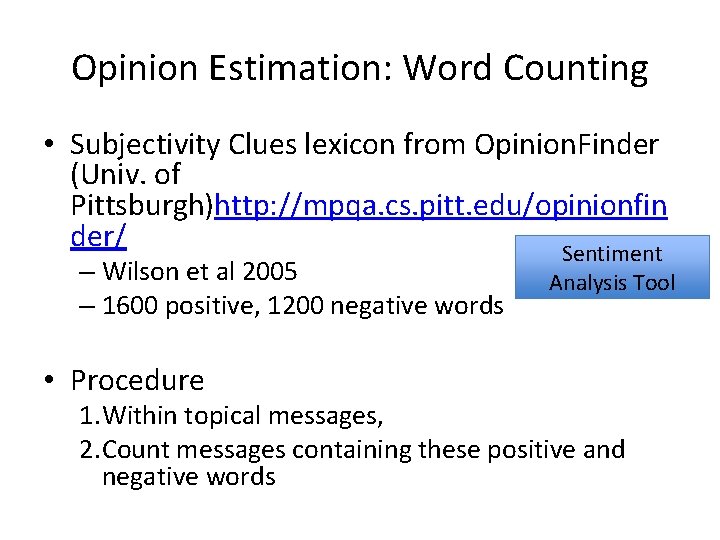
Opinion Estimation: Word Counting • Subjectivity Clues lexicon from Opinion. Finder (Univ. of Pittsburgh)http: //mpqa. cs. pitt. edu/opinionfin der/ Sentiment – Wilson et al 2005 – 1600 positive, 1200 negative words • Procedure Analysis Tool 1. Within topical messages, 2. Count messages containing these positive and negative words
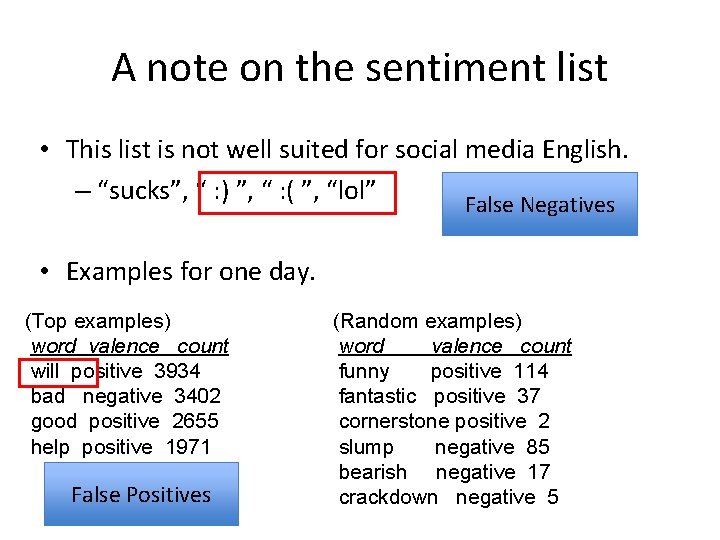
A note on the sentiment list • This list is not well suited for social media English. – “sucks”, “ : ) ”, “ : ( ”, “lol” False Negatives • Examples for one day. (Top examples) word valence count will positive 3934 bad negative 3402 good positive 2655 help positive 1971 False Positives (Random examples) word valence count funny positive 114 fantastic positive 37 cornerstone positive 2 slump negative 85 bearish negative 17 crackdown negative 5
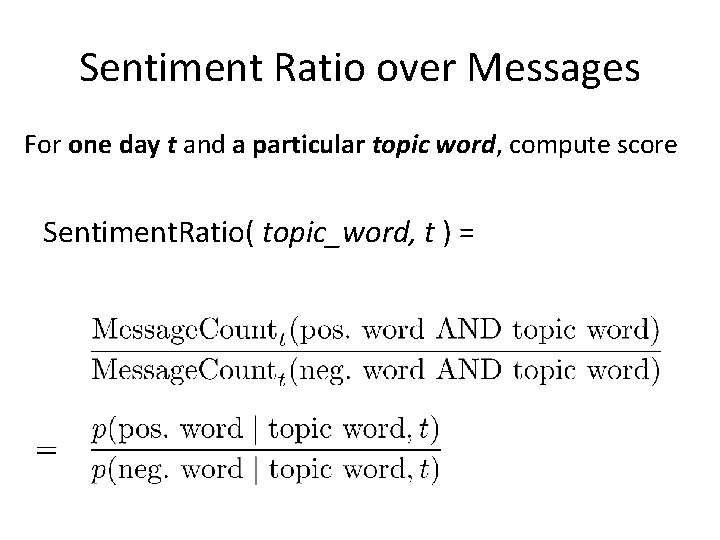
Sentiment Ratio over Messages For one day t and a particular topic word, compute score Sentiment. Ratio( topic_word, t ) =
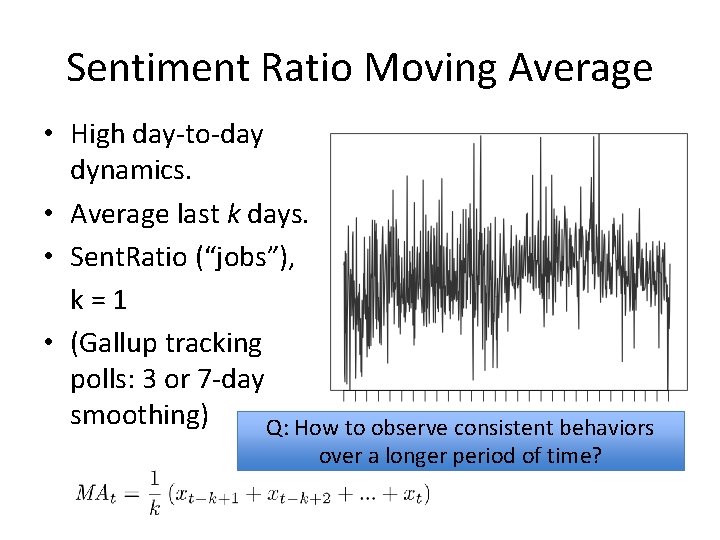
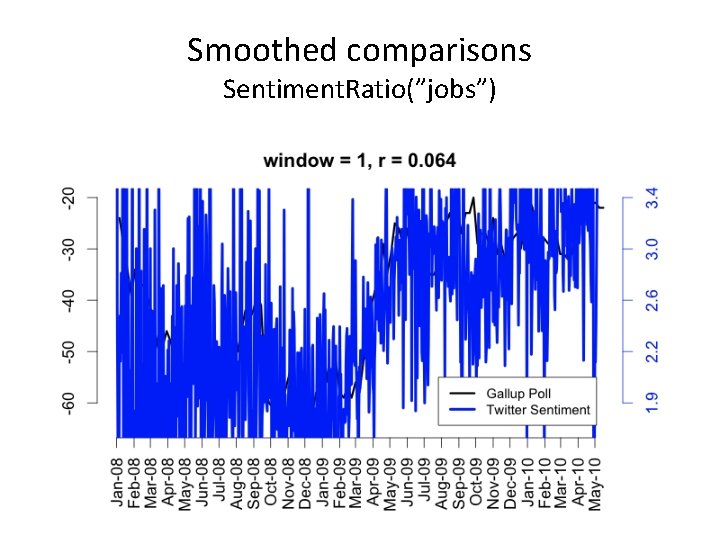
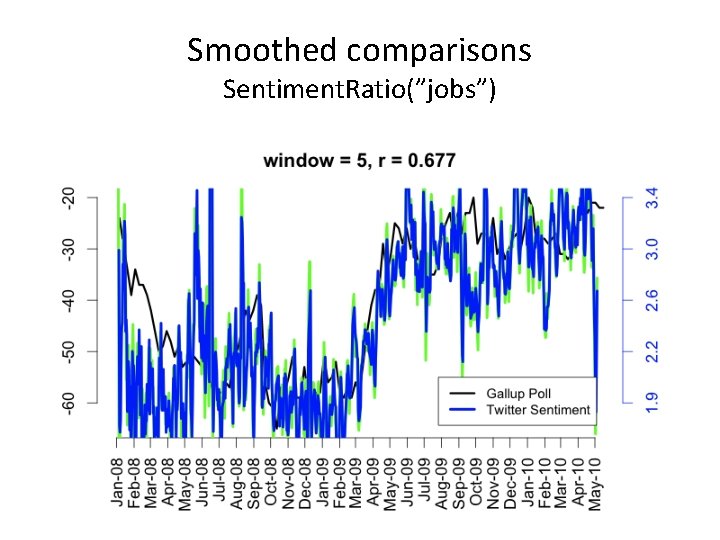
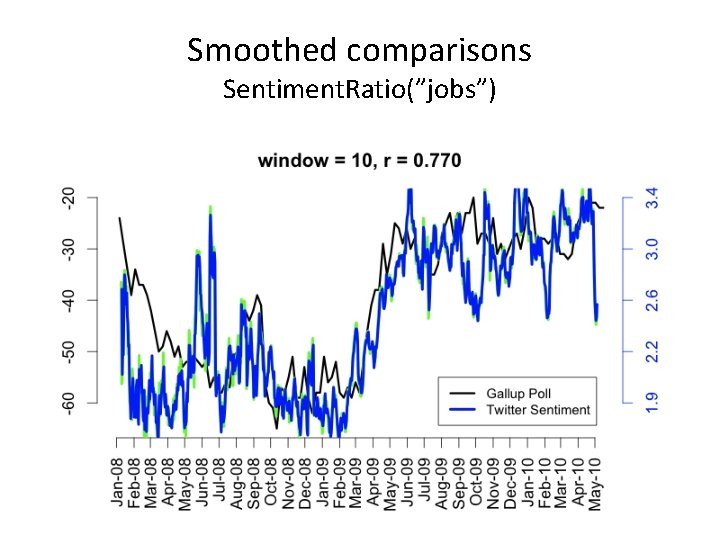
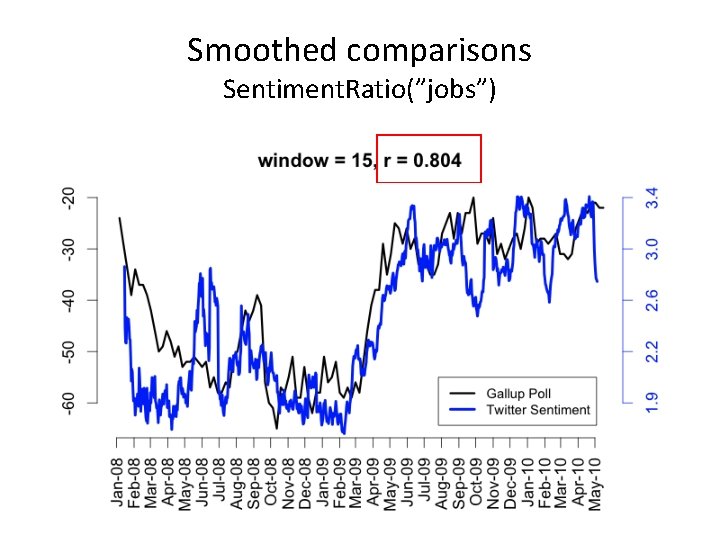
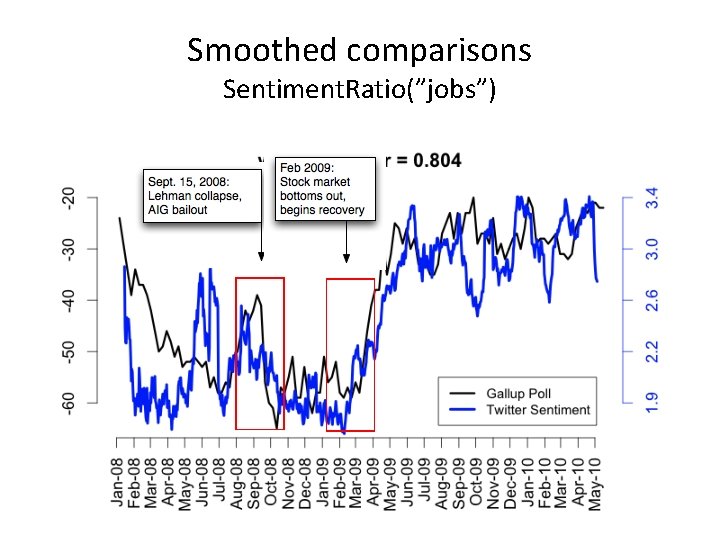
Sentiment Ratio Moving Average • High day-to-day dynamics. • Average last k days. • Sent. Ratio (“jobs”), k=1 • (Gallup tracking polls: 3 or 7 -day smoothing) Q: How to observe consistent behaviors over a longer period of time?
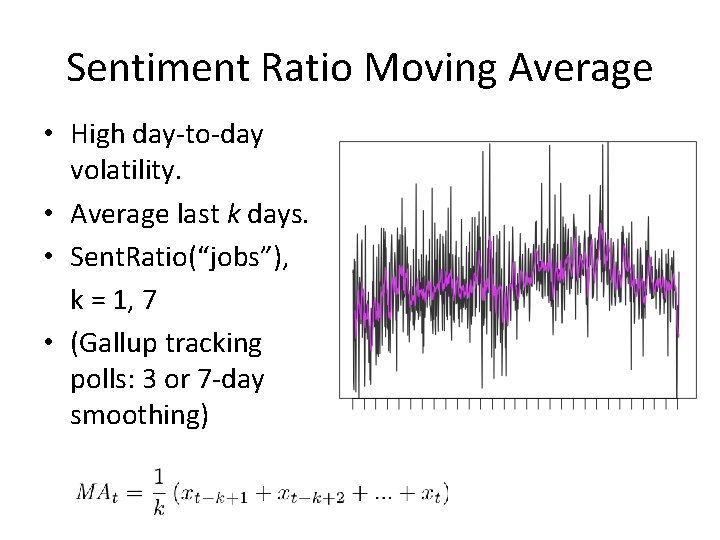
Sentiment Ratio Moving Average • High day-to-day volatility. • Average last k days. • Sent. Ratio(“jobs”), k = 1, 7 • (Gallup tracking polls: 3 or 7 -day smoothing)
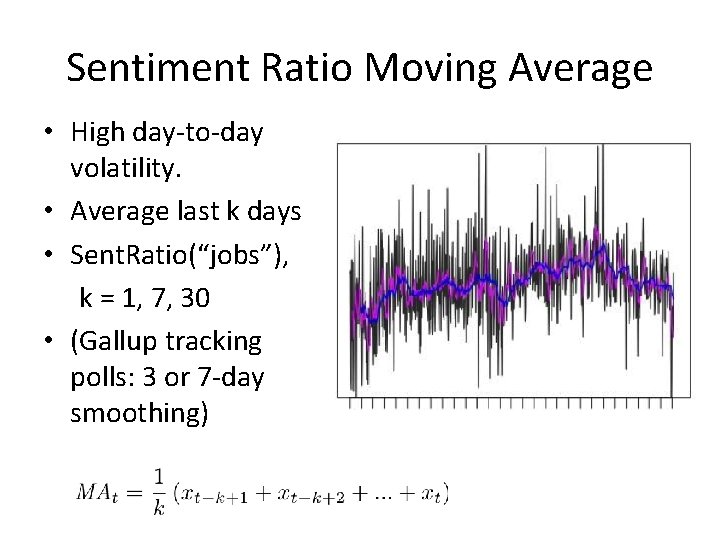
Sentiment Ratio Moving Average • High day-to-day volatility. • Average last k days • Sent. Ratio(“jobs”), k = 1, 7, 30 • (Gallup tracking polls: 3 or 7 -day smoothing)
Smoothed comparisons Sentiment. Ratio(”jobs”)
Smoothed comparisons Sentiment. Ratio(”jobs”)
Smoothed comparisons Sentiment. Ratio(”jobs”)
Smoothed comparisons Sentiment. Ratio(”jobs”)
Smoothed comparisons Sentiment. Ratio(”jobs”)
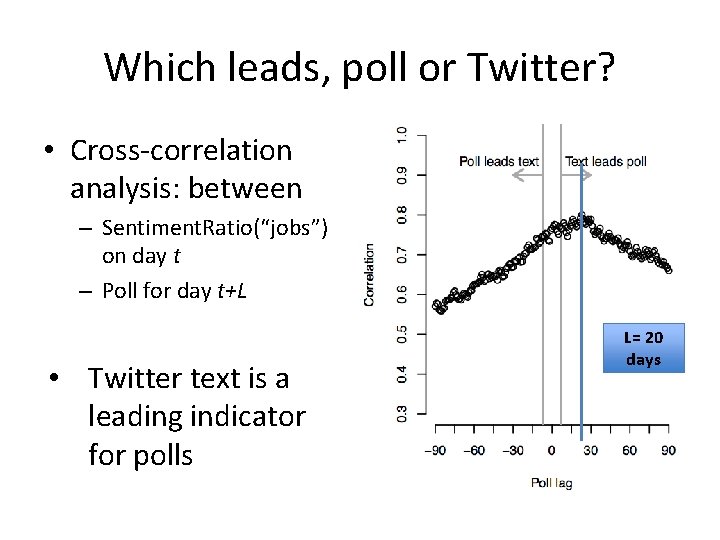
Which leads, poll or Twitter? • Cross-correlation analysis: between – Sentiment. Ratio(“jobs”) on day t – Poll for day t+L • Twitter text is a leading indicator for polls L= 20 days
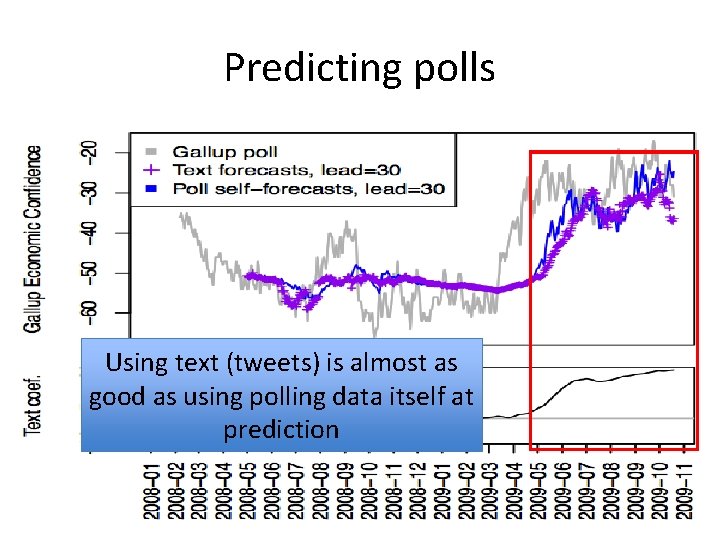
Predicting polls Using text (tweets) is almost as good as using polling data itself at prediction
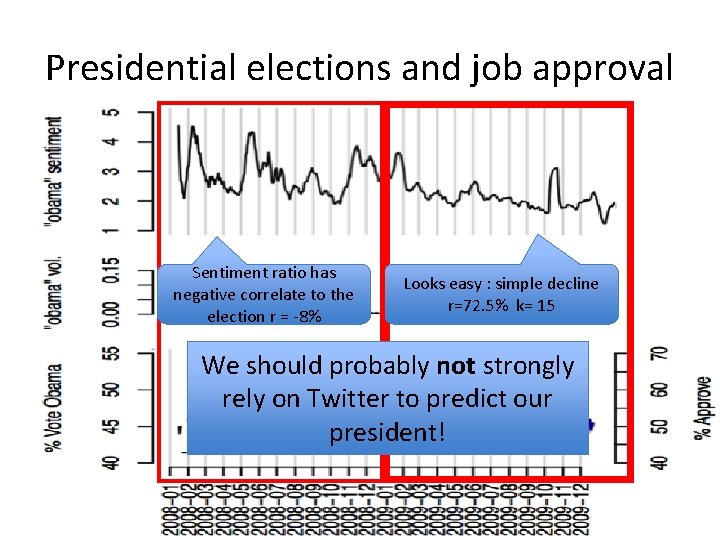
Presidential elections and job approval Sentiment ratio has negative correlate to the election r = -8% Looks easy : simple decline r=72. 5% k= 15 We should probably not strongly rely on Twitter to predict our president!
Remained Challenges – Who is using Twitter? • Massive changes over time (2009 Twitter != 2015 Twitter) – Is Polling the Gold Standard? • Other more reliable sources (e. g. , face-to-face interviews) – Better text analysis • How to handle retweets and duplicated information (next lecture) • Word sense ambiguity: “steve jobs” – Less biased data • Use demographic information on Twitter to reduce bias