OnLine Monitoring Online monitoring review TOF Online status
- Slides: 14

On-Line Monitoring • • • On-line monitoring review TOF On-line status Recent work About the “pdst” Conclusion & Future work.

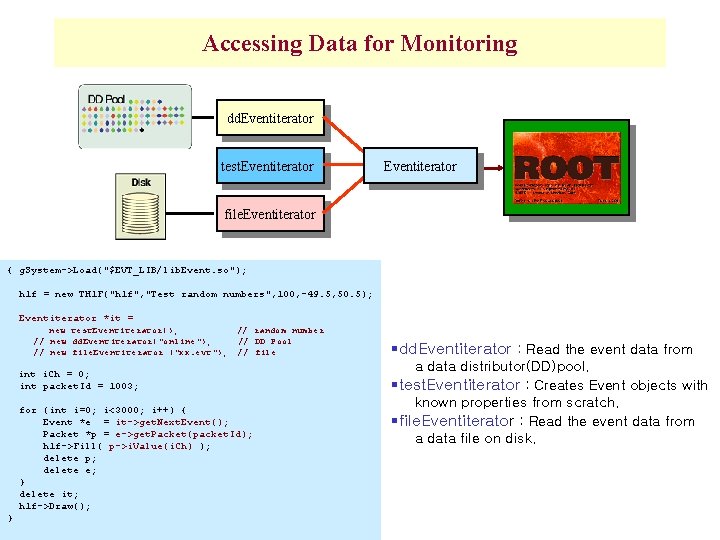
Accessing Data for Monitoring dd. Eventiterator test. Eventiterator file. Eventiterator { g. System->Load("$EVT_LIB/lib. Event. so"); h 1 f = new TH 1 F("h 1 f", "Test random numbers", 100, -49. 5, 50. 5); Eventiterator *it = new test. Eventiterator(); // new dd. Eventiterator("online"); // new file. Eventiterator ("xx. evt"); // random number // DD Pool // file int i. Ch = 0; int packet. Id = 1003; for (int i=0; i<3000; i++) { Event *e = it->get. Next. Event(); Packet *p = e->get. Packet(packet. Id); h 1 f->Fill( p->i. Value(i. Ch) ); delete p; delete e; } delete it; h 1 f->Draw(); } §dd. Eventiterator : Read the event data from a data distributor(DD)pool. §test. Eventiterator : Creates Event objects with known properties from scratch. §file. Eventiterator : Read the event data from a data file on disk.

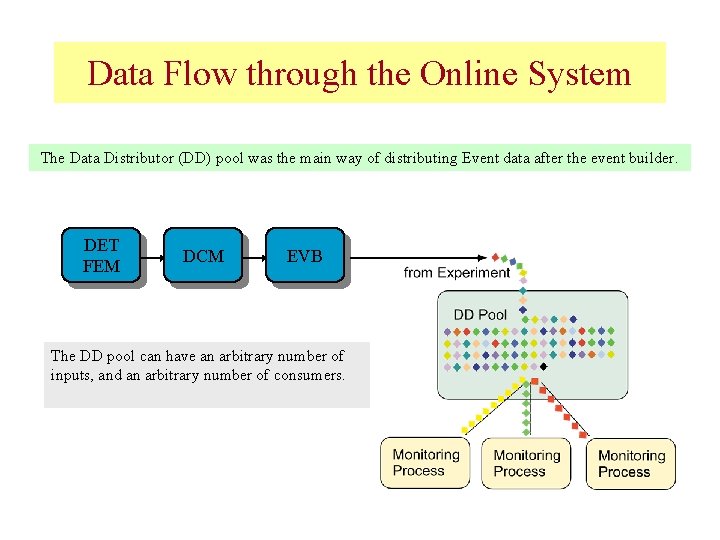
Data Flow through the Online System The Data Distributor (DD) pool was the main way of distributing Event data after the event builder. DET FEM DCM EVB The DD pool can have an arbitrary number of inputs, and an arbitrary number of consumers.

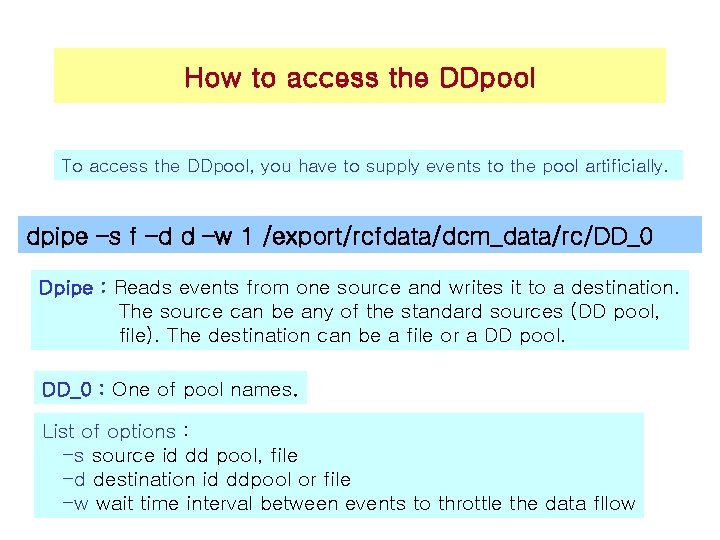
How to access the DDpool To access the DDpool, you have to supply events to the pool artificially. dpipe –s f –d d –w 1 /export/rcfdata/dcm_data/rc/DD_0 Dpipe : Reads events from one source and writes it to a destination. The source can be any of the standard sources (DD pool, file). The destination can be a file or a DD pool. DD_0 : One of pool names. List of options : -s source id dd pool, file -d destination id ddpool or file -w wait time interval between events to throttle the data fllow

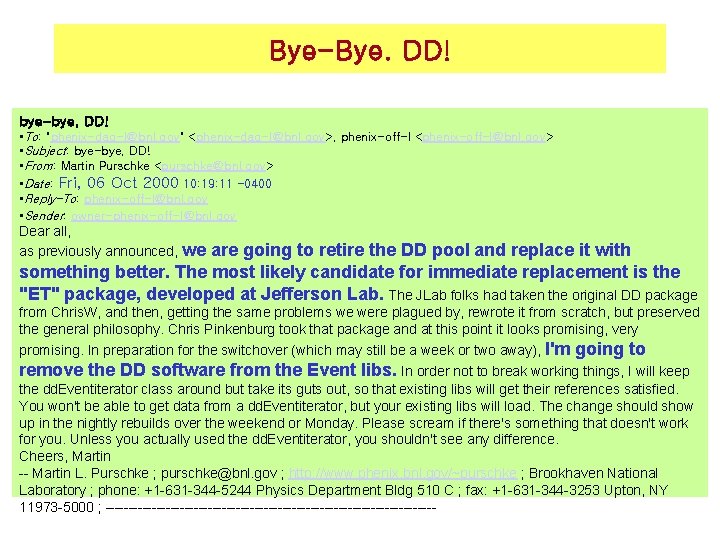
Bye-Bye. DD! bye-bye, DD! • To: "phenix-daq-l@bnl. gov" <phenix-daq-l@bnl. gov>, phenix-off-l <phenix-off-l@bnl. gov> • Subject: bye-bye, DD! • From: Martin Purschke <purschke@bnl. gov> • Date: Fri, 06 Oct 2000 10: 19: 11 -0400 • Reply-To: phenix-off-l@bnl. gov • Sender: owner-phenix-off-l@bnl. gov Dear all, as previously announced, we are going to retire the DD pool and replace it with something better. The most likely candidate for immediate replacement is the "ET" package, developed at Jefferson Lab. The JLab folks had taken the original DD package from Chris. W, and then, getting the same problems we were plagued by, rewrote it from scratch, but preserved the general philosophy. Chris Pinkenburg took that package and at this point it looks promising, very promising. In preparation for the switchover (which may still be a week or two away), I'm going to remove the DD software from the Event libs. In order not to break working things, I will keep the dd. Eventiterator class around but take its guts out, so that existing libs will get their references satisfied. You won't be able to get data from a dd. Eventiterator, but your existing libs will load. The change should show up in the nightly rebuilds over the weekend or Monday. Please scream if there's something that doesn't work for you. Unless you actually used the dd. Eventiterator, you shouldn't see any difference. Cheers, Martin -- Martin L. Purschke ; purschke@bnl. gov ; http: //www. phenix. bnl. gov/~purschke ; Brookhaven National Laboratory ; phone: +1 -631 -344 -5244 Physics Department Bldg 510 C ; fax: +1 -631 -344 -3253 Upton, NY 11973 -5000 ; ------------------------------------

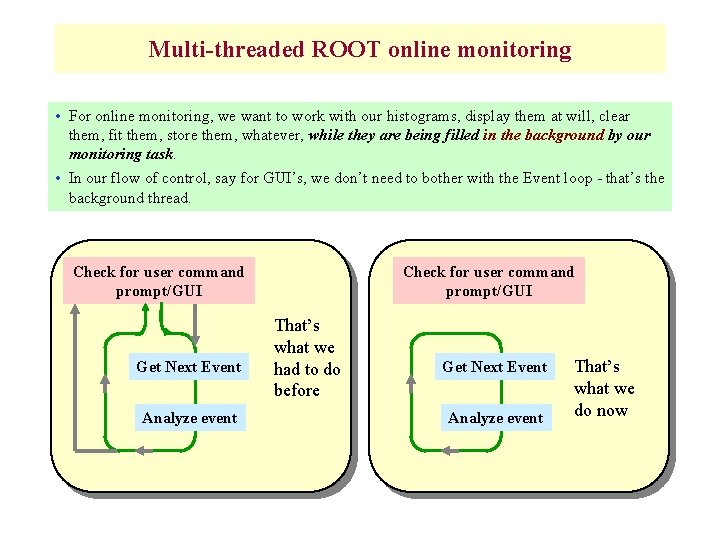
Multi-threaded ROOT online monitoring • For online monitoring, we want to work with our histograms, display them at will, clear them, fit them, store them, whatever, while they are being filled in the background by our monitoring task. • In our flow of control, say for GUI’s, we don’t need to bother with the Event loop - that’s the background thread. Check for user command prompt/GUI Get Next Event Analyze event That’s what we had to do before Get Next Event Analyze event That’s what we do now

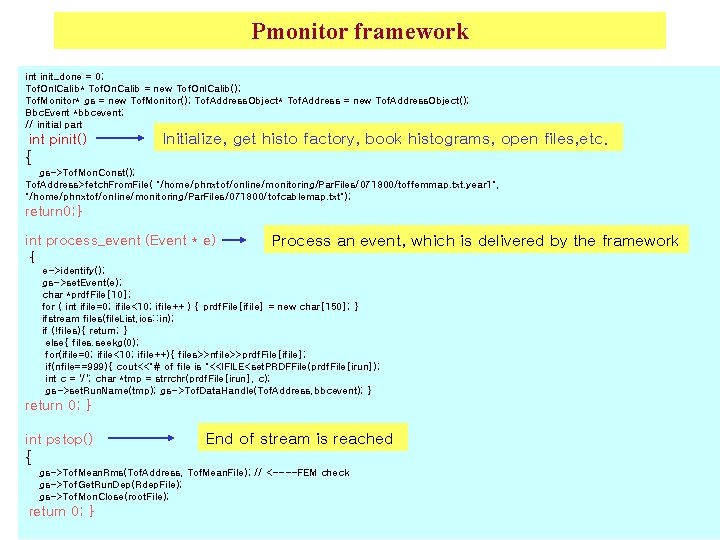
Pmonitor framework int init_done = 0; Tof. Onl. Calib* Tof. On. Calib = new Tof. Onl. Calib(); Tof. Monitor* gs = new Tof. Monitor(); Tof. Address. Object* Tof. Address = new Tof. Address. Object(); Bbc. Event *bbcevent; // initial part int pinit() Initialize, get histo factory, book histograms, open files, etc. { gs->Tof. Mon. Const(); Tof. Address>fetch. From. File( "/home/phnxtof/online/monitoring/Par. Files/071800/toffemmap. txt. year 1", "/home/phnxtof/online/monitoring/Par. Files/071800/tofcablemap. txt"); return 0; } int process_event (Event * e) { Process an event, which is delivered by the framework e->identify(); gs->set. Event(e); char *prdf. File[10]; for ( int ifile=0; ifile<10; ifile++ ) { prdf. File[ifile] = new char[150]; } ifstream files(file. List, ios: : in); if (!files){ return; } else{ files. seekg(0); for(ifile=0; ifile<10; ifile++){ files>>nfile>>prdf. File[ifile]; if(nfile==999){ cout<<"# of file is "<<IFILE<set. PRDFFile(prdf. File[irun]); int c = '/'; char *tmp = strrchr(prdf. File[irun], c); gs->set. Run. Name(tmp); gs->Tof. Data. Handle(Tof. Address, bbcevent); } return 0; } int pstop() End of stream is reached { gs->Tof. Mean. Rms(Tof. Address, Tof. Mean. File); // <----FEM check gs->Tof. Get. Run. Dep(Rdep. File); gs->Tof. Mon. Close(root. File); return 0; }

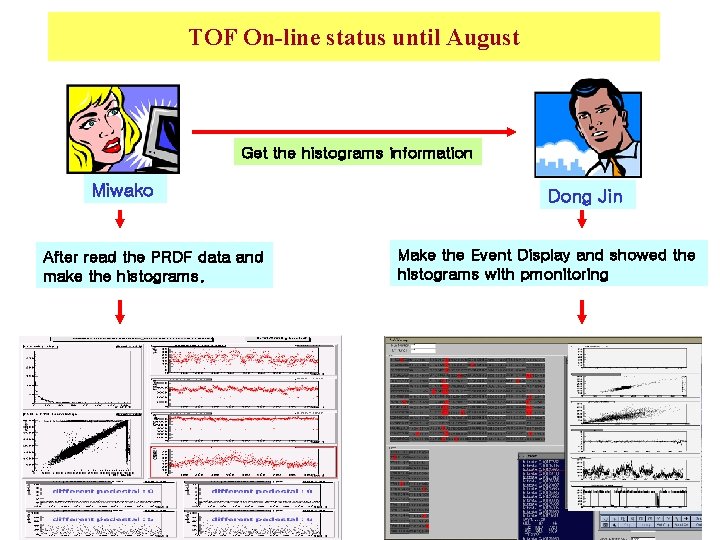
TOF On-line status until August Get the histograms information Miwako After read the PRDF data and make the histograms. Dong Jin Make the Event Display and showed the histograms with pmonitoring

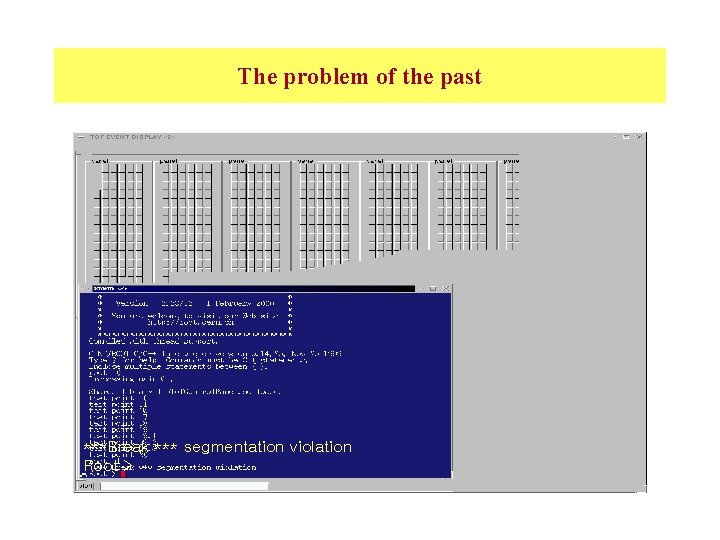
The problem of the past ***Break *** segmentation violation Root >

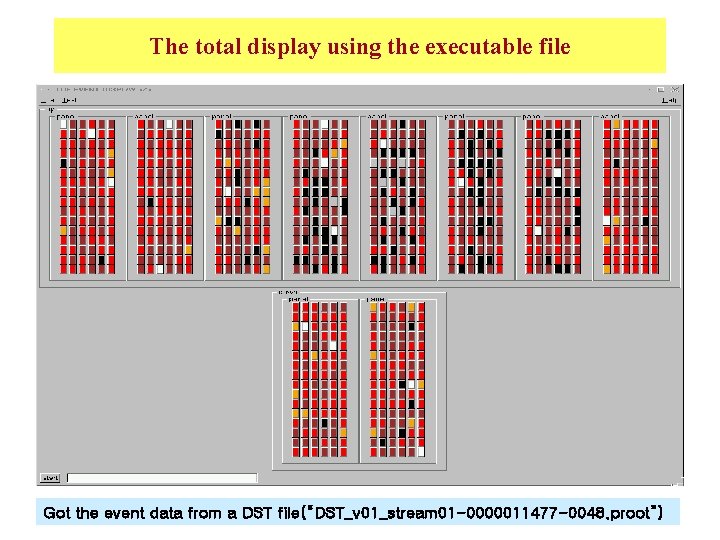
The total display using the executable file Got the event data from a DST file(“DST_v 01_stream 01 -0000011477 -0048. proot”)

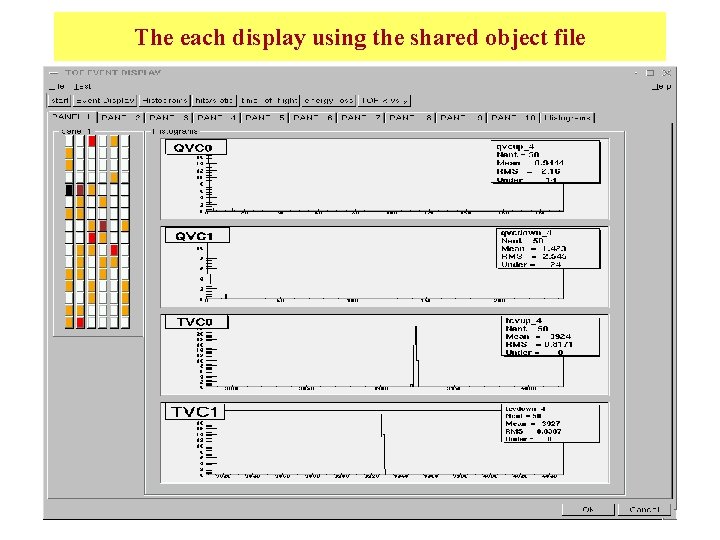
The each display using the shared object file

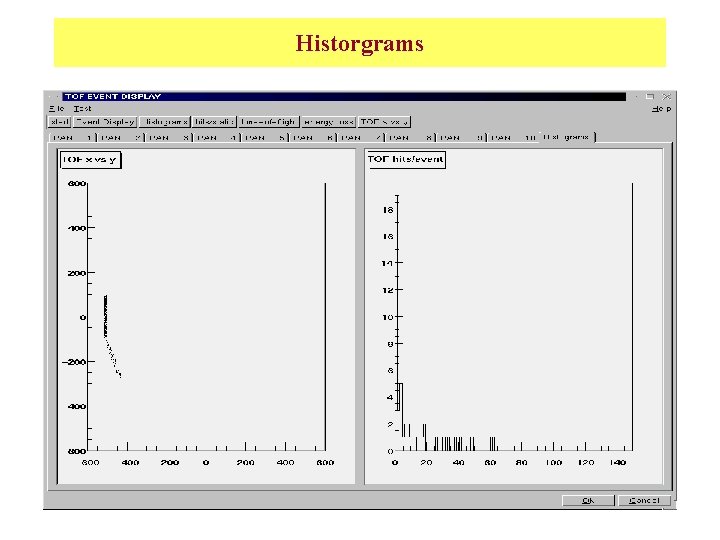
Historgrams

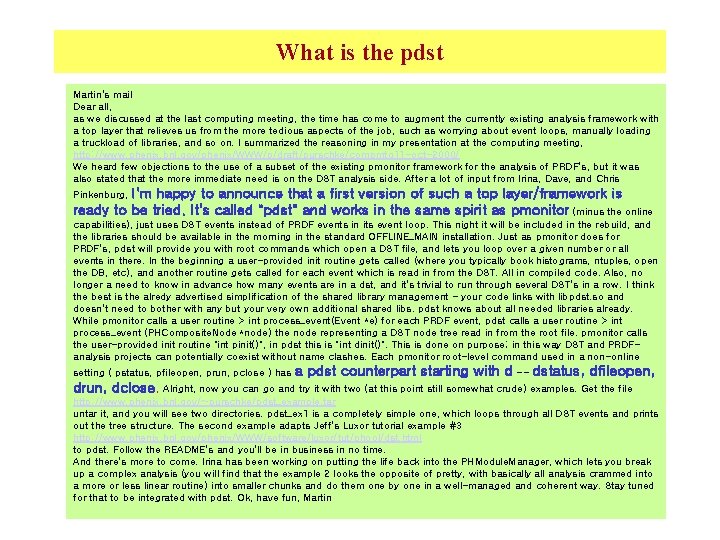
What is the pdst Martin's mail Dear all, as we discussed at the last computing meeting, the time has come to augment the currently existing analysis framework with a top layer that relieves us from the more tedious aspects of the job, such as worrying about event loops, manually loading a truckload of libraries, and so on. I summarized the reasoning in my presentation at the computing meeting, http: //www. phenix. bnl. gov/phenix/WWW/p/draft/purschke/compmtg 11 -oct-2000/ We heard few objections to the use of a subset of the existing pmonitor framework for the analysis of PRDF's, but it was also stated that the more immediate need is on the DST analysis side. After a lot of input from Irina, Dave, and Chris I'm happy to announce that a first version of such a top layer/framework is ready to be tried. It's called "pdst" and works in the same spirit as pmonitor (minus the online Pinkenburg, capabilities), just uses DST events instead of PRDF events in its event loop. This night it will be included in the rebuild, and the libraries should be available in the morning in the standard OFFLINE_MAIN installation. Just as pmonitor does for PRDF's, pdst will provide you with root commands which open a DST file, and lets you loop over a given number or all events in there. In the beginning a user-provided init routine gets called (where you typically book histograms, ntuples, open the DB, etc), and another routine gets called for each event which is read in from the DST. All in compiled code. Also, no longer a need to know in advance how many events are in a dst, and it's trivial to run through several DST's in a row. I think the best is the alredy advertised simplification of the shared library management - your code links with libpdst. so and doesn't need to bother with any but your very own additional shared libs. pdst knows about all needed libraries already. While pmonitor calls a user routine > int process_event(Event *e) for each PRDF event, pdst calls a user routine > int process_event (PHComposite. Node *node) the node representing a DST node tree read in from the root file. pmonitor calls the user-provided init routine "int pinit()", in pdst this is "int dinit()". This is done on purpose; in this way DST and PRDFanalysis projects can potentially coexist without name clashes. Each pmonitor root-level command used in a non-online setting ( pstatus, pfileopen, prun, pclose ) has a pdst counterpart starting with d -- dstatus, dfileopen, drun, dclose. Alright, now you can go and try it with two (at this point still somewhat crude) examples. Get the file http: //www. phenix. bnl. gov/~purschke/pdst_example. tar untar it, and you will see two directories. pdst_ex 1 is a completely simple one, which loops through all DST events and prints out the tree structure. The second example adapts Jeff's Luxor tutorial example #3 http: //www. phenix. bnl. gov/phenix/WWW/software/luxor/tut/phool/dst. html to pdst. Follow the README's and you'll be in business in no time. And there's more to come. Irina has been working on putting the life back into the PHModule. Manager, which lets you break up a complex analysis (you will find that the example 2 looks the opposite of pretty, with basically all analysis crammed into a more or less linear routine) into smaller chunks and do them one by one in a well-managed and coherent way. Stay tuned for that to be integrated with pdst. Ok, have fun, Martin

Conclusion & Future work • First, I will incorporate ET package into on-line monitoring program. • Second, I will put my program on phoncs machine for next shifters after arrange it , sooner or later. • Finally, I will do PRDF mixing work after I study offline code.