Online Data Monitoring Framework Based on Histogram Packaging

Online Data Monitoring Framework Based on Histogram Packaging in Network Distributed Data Acquisition Systems Tomoyuki Konno 1, Anatael Cabrera 2, Masaki Ishitsuka 1, Masahiro Kuze 1, Yasunobu Sakamoto 3 1. Tokyo Institute of Technology, 2. CNRS/IN 2 P 3 -APC Laboratory (Paris), 3. Tohoku Gakuin University CHEP 2010@ Taipei, 10/20/2010
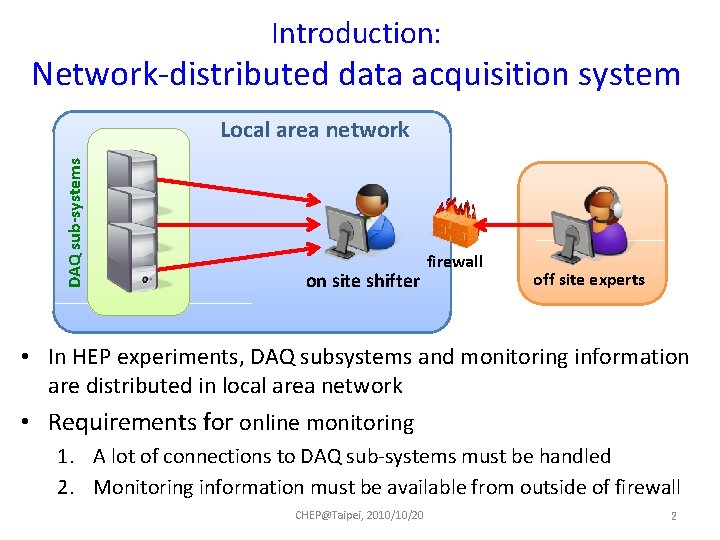
Introduction: Network-distributed data acquisition system DAQ sub-systems Local area network on site shifter firewall off site experts • In HEP experiments, DAQ subsystems and monitoring information are distributed in local area network • Requirements for online monitoring 1. A lot of connections to DAQ sub-systems must be handled 2. Monitoring information must be available from outside of firewall CHEP@Taipei, 2010/10/20 2
Online monitor framework • General software framework for online data monitoring – Collects information from network distributed systems – All information are handled as collections of histograms • ”Histogram. Package” : Common interface via network – Displays to off-site experts via internet • DAQ sub-systems – Create and update Histogram. Packages • Monitor Server – Collects Histogram. Packages from DAQ sub-systems • Monitor Viewer – Connects to Monitor Server and creates graphical plots – Two types with different technologies: Java, web browser CHEP@Taipei, 2010/10/20 3
Histogram. Package • Common interface via network – DAQ sub-systems to Monitor Server – Monitor Server to Monitor Viewers • Structure of Histogram. Package – Package name (String) : used for identification – Update serial ID (Integer) : used for checking updates – Array of Monitored Objects • Histograms (1 -D and 2 -D) • Graphs (scatter plots and time variation) • All histograms are collected and sent as single package CHEP@Taipei, 2010/10/20 4
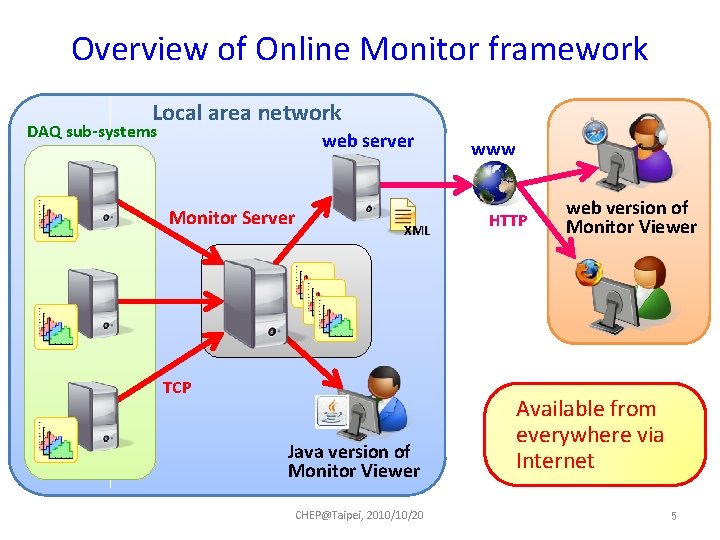
Overview of Online Monitor framework Local area network DAQ sub-systems web server Monitor Server XML TCP Java version of Monitor Viewer CHEP@Taipei, 2010/10/20 www HTTP web version of Monitor Viewer Available from everywhere via Internet 5
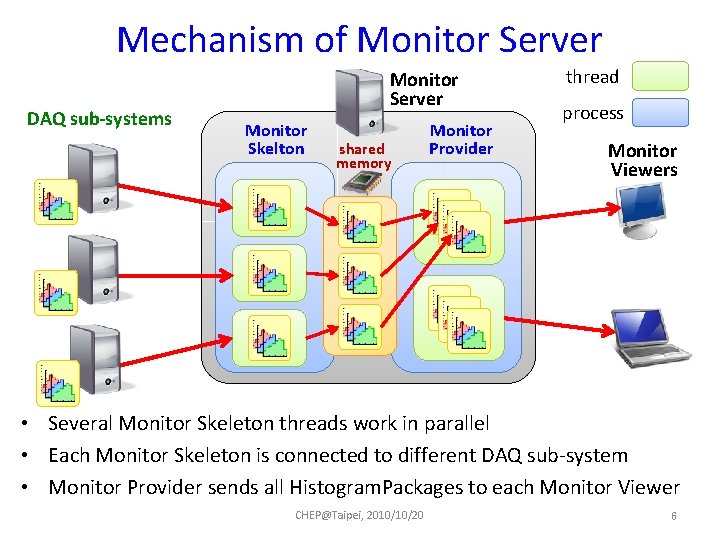
Mechanism of Monitor Server DAQ sub-systems Monitor Server Monitor Skelton shared memory Monitor Provider thread process Monitor Viewers • Several Monitor Skeleton threads work in parallel • Each Monitor Skeleton is connected to different DAQ sub-system • Monitor Provider sends all Histogram. Packages to each Monitor Viewer CHEP@Taipei, 2010/10/20 6
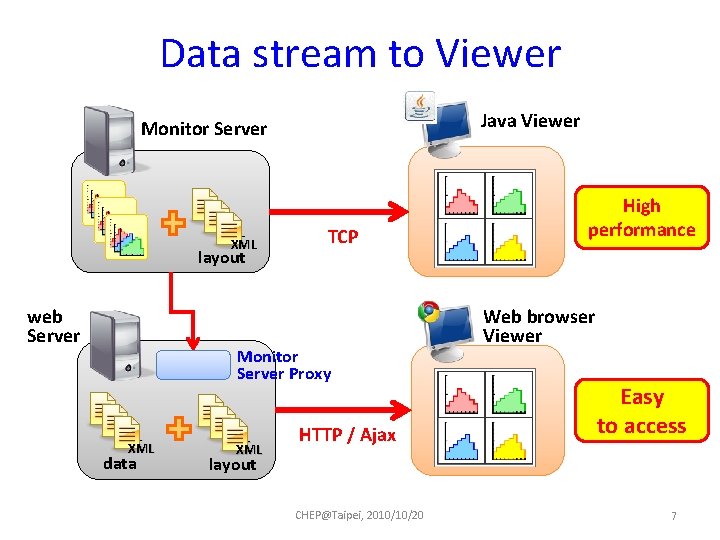
Data stream to Viewer Java Viewer Monitor Server XML XML layout web Server TCP Monitor Server Proxy XML XML data XML XML HTTP / Ajax High performance Web browser Viewer Easy to access layout CHEP@Taipei, 2010/10/20 7
Details of Monitor Viewer • Technologies – Java : Swing and Java web start – web : Google web toolkit, Ajax, Canvas (HTML 5) • Platform independent – Runs on Windows, Mac OS, Linux – Free from additional plug-ins or libraries (e. g. ROOT) • Graphical plots are created on viewer sides – Dynamic control of plots (zooming , changing colors, …) • GUI layouts are automatically generated by XML files – Panels, tables , tabs, scroll bars etc. . – Specifics of graphical objects (colors, width, font, …) – Additional objects (legend, axis, text, …) CHEP@Taipei, 2010/10/20 8
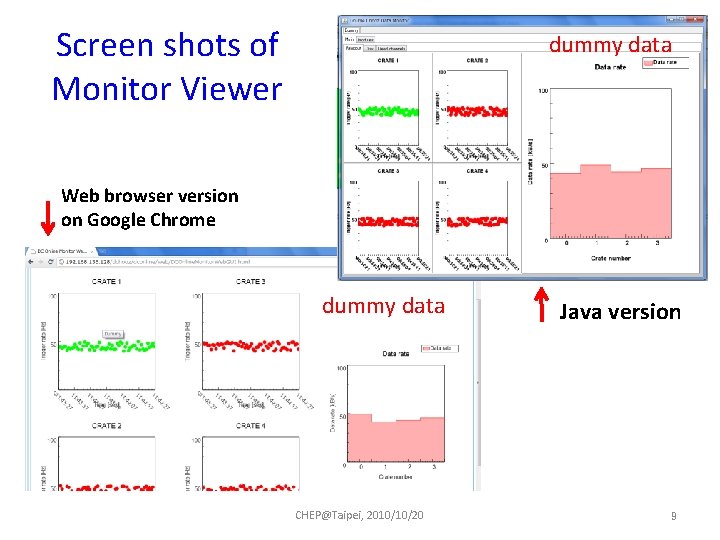
Screen shots of Monitor Viewer dummy data Web browser version on Google Chrome dummy data CHEP@Taipei, 2010/10/20 Java version 9
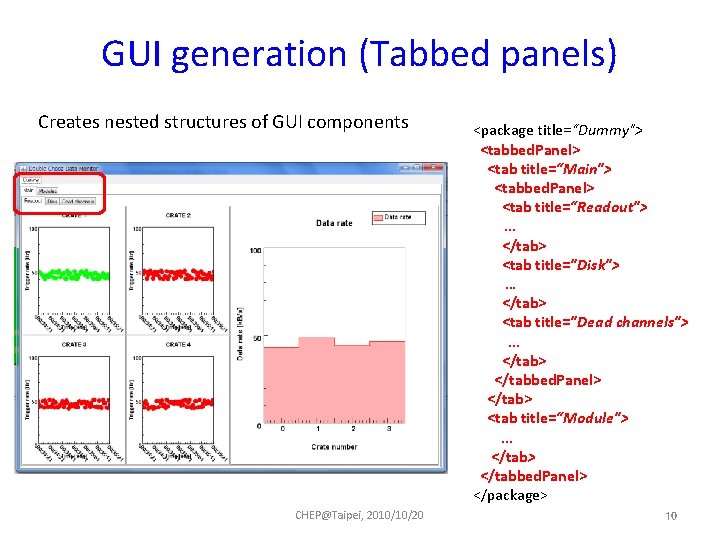
GUI generation (Tabbed panels) Creates nested structures of GUI components CHEP@Taipei, 2010/10/20 <package title=“Dummy"> <tabbed. Panel> <tab title=“Main"> <tabbed. Panel> <tab title=“Readout"> … </tab> <tab title="Disk"> … </tab> <tab title="Dead channels"> … </tab> </tabbed. Panel> </tab> <tab title=“Module"> … </tab> </tabbed. Panel> </package> 10
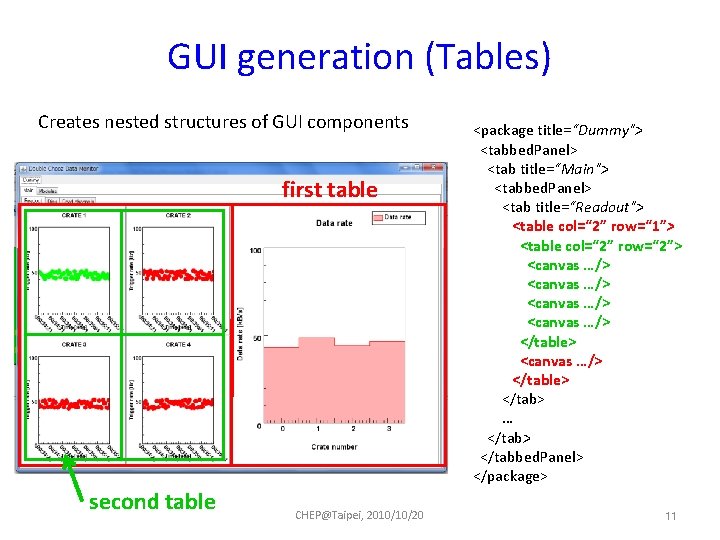
GUI generation (Tables) Creates nested structures of GUI components first table second table CHEP@Taipei, 2010/10/20 <package title=“Dummy"> <tabbed. Panel> <tab title=“Main"> <tabbed. Panel> <tab title=“Readout"> <table col=“ 2” row=“ 1”> <table col=“ 2” row=“ 2”> <canvas …/> </table> <canvas …/> </table> </tab> … </tab> </tabbed. Panel> </package> 11
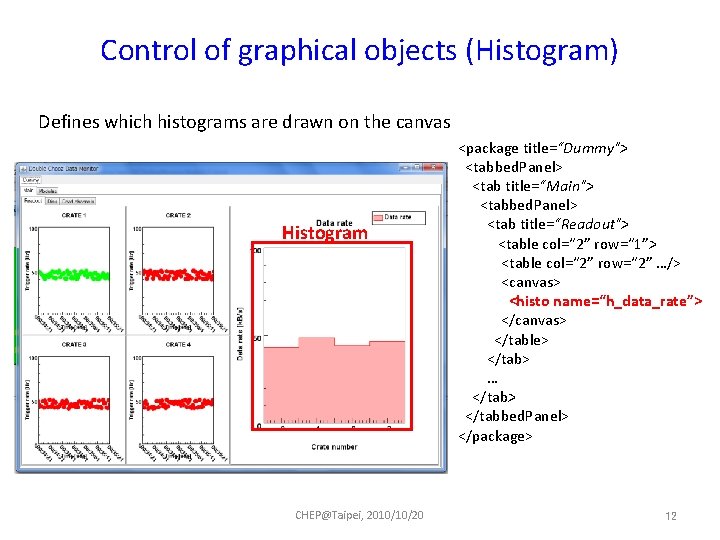
Control of graphical objects (Histogram) Defines which histograms are drawn on the canvas Histogram CHEP@Taipei, 2010/10/20 <package title=“Dummy"> <tabbed. Panel> <tab title=“Main"> <tabbed. Panel> <tab title=“Readout"> <table col=“ 2” row=“ 1”> <table col=“ 2” row=“ 2” …/> <canvas> <histo name=“h_data_rate”> </canvas> </table> </tab> … </tab> </tabbed. Panel> </package> 12
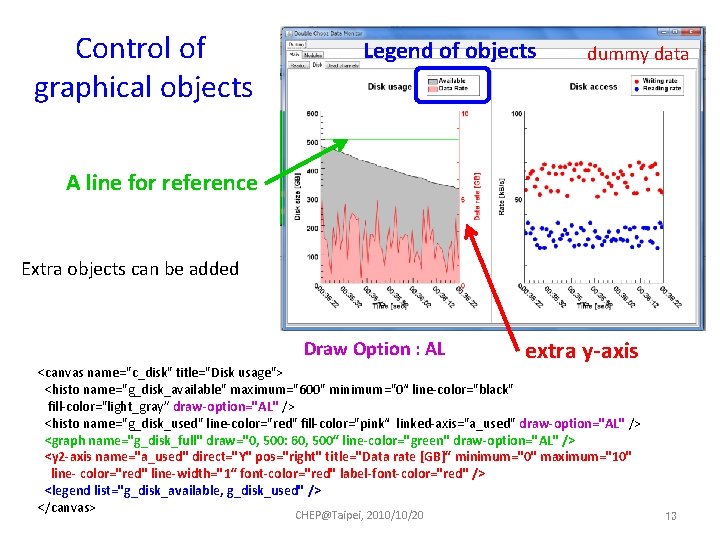
Control of graphical objects Legend of objects dummy data A line for reference Extra objects can be added Draw Option : AL extra y-axis <canvas name="c_disk" title="Disk usage"> <histo name="g_disk_available" maximum="600" minimum="0“ line-color="black" fill-color="light_gray” draw-option="AL" /> <histo name="g_disk_used" line-color="red" fill-color="pink“ linked-axis="a_used" draw-option="AL" /> <graph name="g_disk_full" draw="0, 500: 60, 500“ line-color="green" draw-option="AL" /> <y 2 -axis name="a_used" direct="Y" pos="right" title="Data rate [GB]“ minimum="0" maximum="10" line- color="red" line-width="1“ font-color="red" label-font-color="red" /> <legend list="g_disk_available, g_disk_used" /> </canvas> CHEP@Taipei, 2010/10/20 13
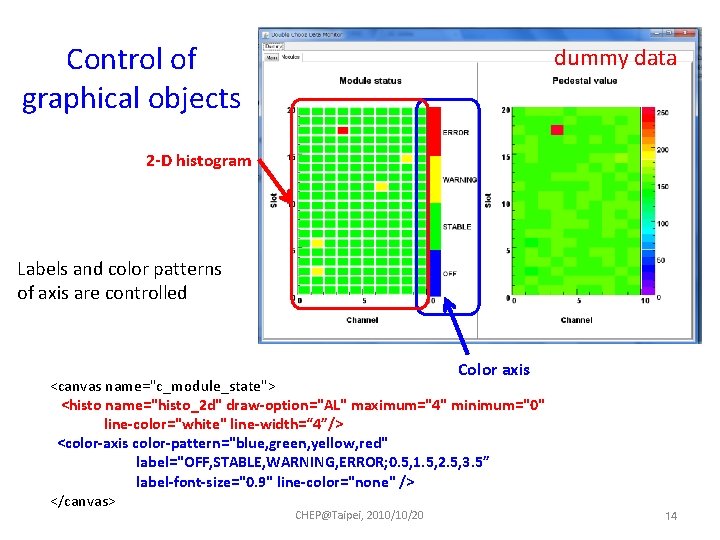
Control of graphical objects dummy data 2 -D histogram Labels and color patterns of axis are controlled Color axis <canvas name="c_module_state"> <histo name="histo_2 d" draw-option="AL" maximum="4" minimum="0" line-color="white" line-width=“ 4”/> <color-axis color-pattern="blue, green, yellow, red" label="OFF, STABLE, WARNING, ERROR; 0. 5, 1. 5, 2. 5, 3. 5” label-font-size="0. 9" line-color="none" /> </canvas> CHEP@Taipei, 2010/10/20 14
Summary • We developed general software framework for online data monitoring – Network-distributed systems create “Histogram. Package”s – Monitor Server collects the packages – Monitor Viewer makes graphical plots from the packages • Two types of Monitor Viewer were developed – Platform independent – Available from everywhere via Internet – GUI layouts can be controlled by XML files • Developed for the Double Chooz experiment – Already being used on-site for the detector commissioning CHEP@Taipei, 2010/10/20 15
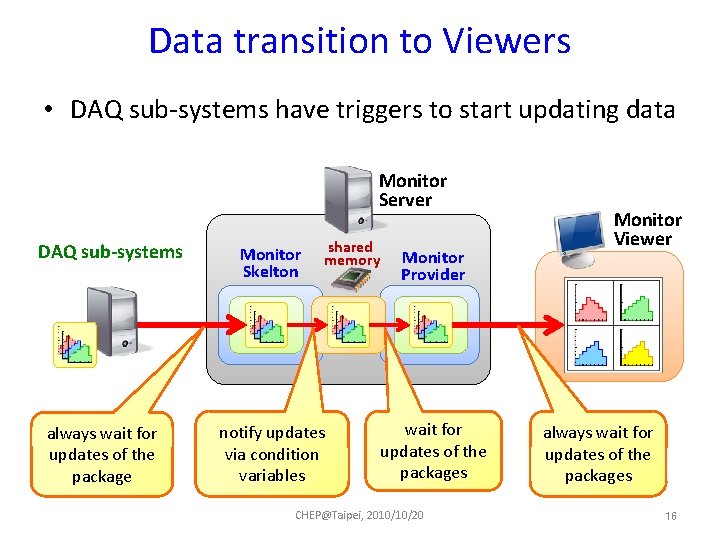
Data transition to Viewers • DAQ sub-systems have triggers to start updating data Monitor Server DAQ sub-systems always wait for updates of the package Monitor Skelton shared memory notify updates via condition variables Monitor Provider wait for updates of the packages CHEP@Taipei, 2010/10/20 Monitor Viewer always wait for updates of the packages 16
Technologies for Monitor Viewer • Java version – Swing – Java web start • web browser version – HTML technologies (Ajax + Canvas) • Google Web Toolkit – compiler from Java to HTML + java script – GUI components – GUI event handlers • Ajax : Unsynchronized communication to web servers • Canvas : Vector graphics on web pages CHEP@Taipei, 2010/10/20 17
- Slides: 17