
OneSample Tests of Hypothesis Chapter 10 Copyright 2015

- Slides: 41
One-Sample Tests of Hypothesis Chapter 10 Copyright © 2015 Mc. Graw-Hill Education. All rights reserved. No reproduction or distribution without the prior written consent of Mc. Graw-Hill Education.
Learning Objectives n n n n LO 10 -1 Define a hypothesis. LO 10 -2 Explain the process of testing a hypothesis. LO 10 -3 Apply the six-step procedure for testing a hypothesis. LO 10 -4 Distinguish between a one-tailed and a two-tailed test of hypothesis. LO 10 -5 Conduct a test of a hypothesis about a population mean. LO 10 -6 Compute and interpret a p-value. LO 10 -7 Use a t statistic to test a hypothesis. LO 10 -8 Compute the probability of a Type II error. (excluded) 10 -2
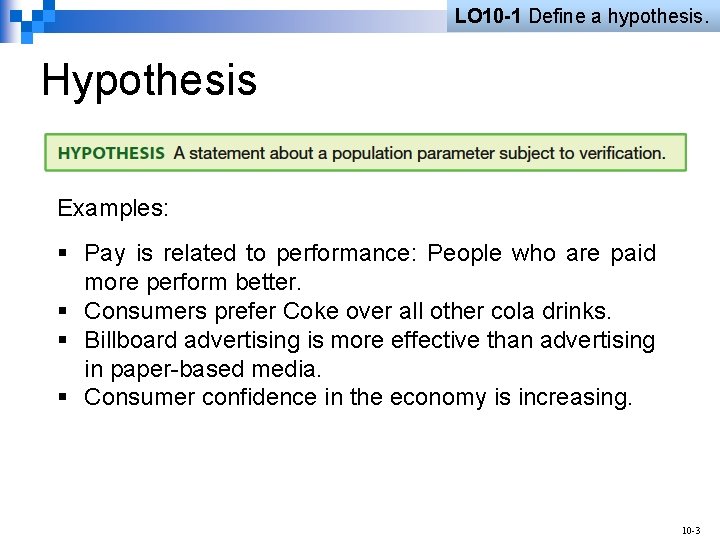
LO 10 -1 Define a hypothesis. Hypothesis Examples: § Pay is related to performance: People who are paid more perform better. § Consumers prefer Coke over all other cola drinks. § Billboard advertising is more effective than advertising in paper-based media. § Consumer confidence in the economy is increasing. 10 -3
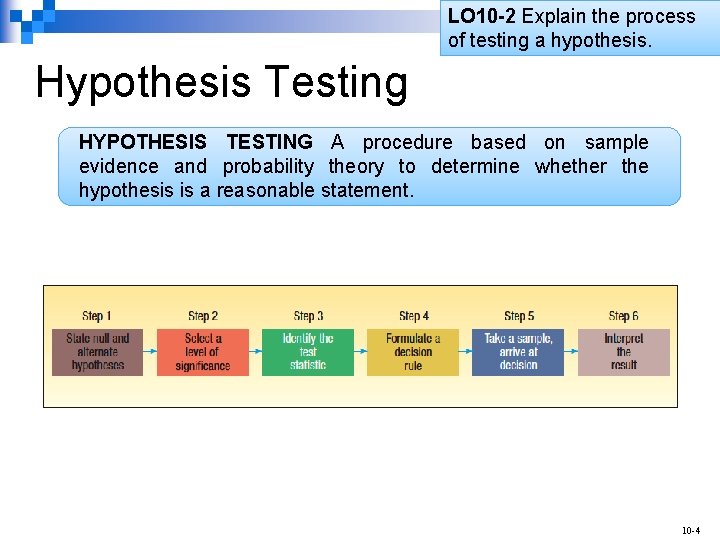
LO 10 -2 Explain the process of testing a hypothesis. Hypothesis Testing HYPOTHESIS TESTING A procedure based on sample evidence and probability theory to determine whether the hypothesis is a reasonable statement. 10 -4
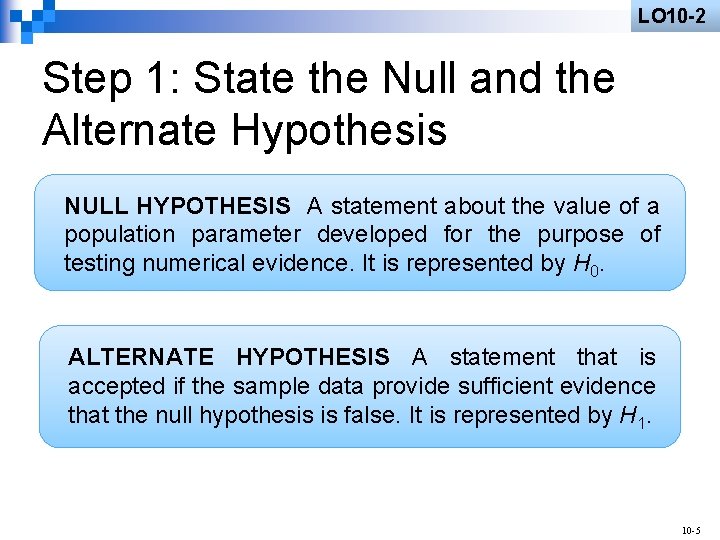
LO 10 -2 Step 1: State the Null and the Alternate Hypothesis NULL HYPOTHESIS A statement about the value of a population parameter developed for the purpose of testing numerical evidence. It is represented by H 0. ALTERNATE HYPOTHESIS A statement that is accepted if the sample data provide sufficient evidence that the null hypothesis is false. It is represented by H 1. 10 -5
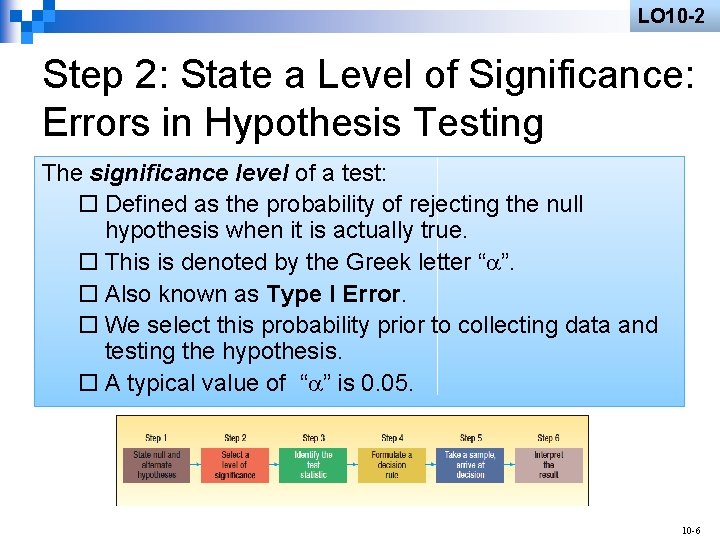
LO 10 -2 Step 2: State a Level of Significance: Errors in Hypothesis Testing The significance level of a test: ¨ Defined as the probability of rejecting the null hypothesis when it is actually true. ¨ This is denoted by the Greek letter “ ”. ¨ Also known as Type I Error. ¨ We select this probability prior to collecting data and testing the hypothesis. ¨ A typical value of “ ” is 0. 05. 10 -6
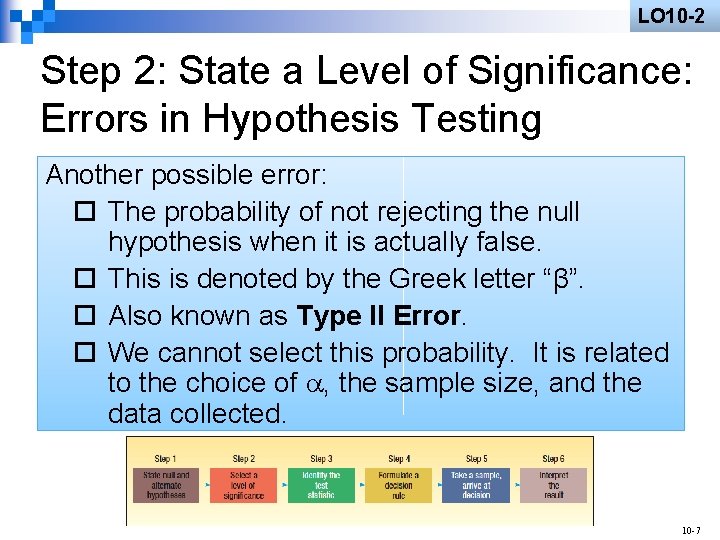
LO 10 -2 Step 2: State a Level of Significance: Errors in Hypothesis Testing Another possible error: ¨ The probability of not rejecting the null hypothesis when it is actually false. ¨ This is denoted by the Greek letter “β”. ¨ Also known as Type II Error. ¨ We cannot select this probability. It is related to the choice of , the sample size, and the data collected. 10 -7
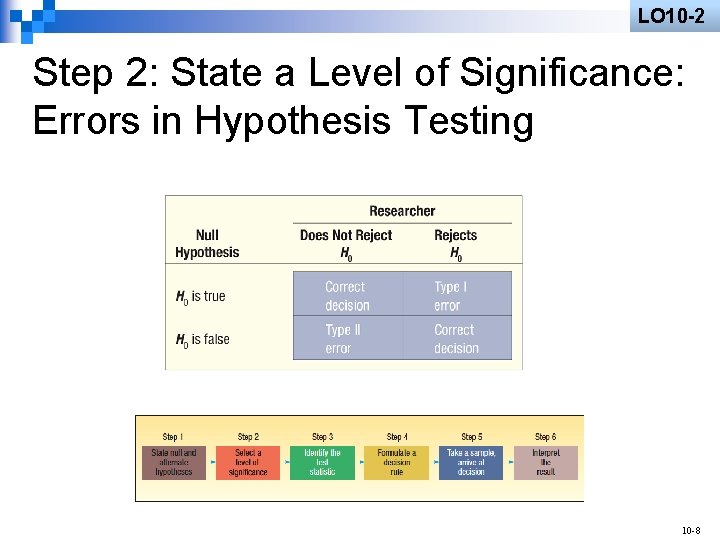
LO 10 -2 Step 2: State a Level of Significance: Errors in Hypothesis Testing 10 -8
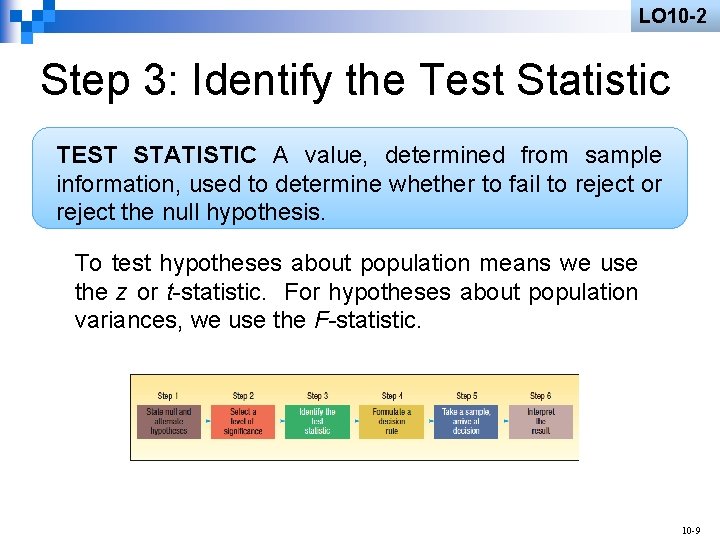
LO 10 -2 Step 3: Identify the Test Statistic TEST STATISTIC A value, determined from sample information, used to determine whether to fail to reject or reject the null hypothesis. To test hypotheses about population means we use the z or t-statistic. For hypotheses about population variances, we use the F-statistic. 10 -9
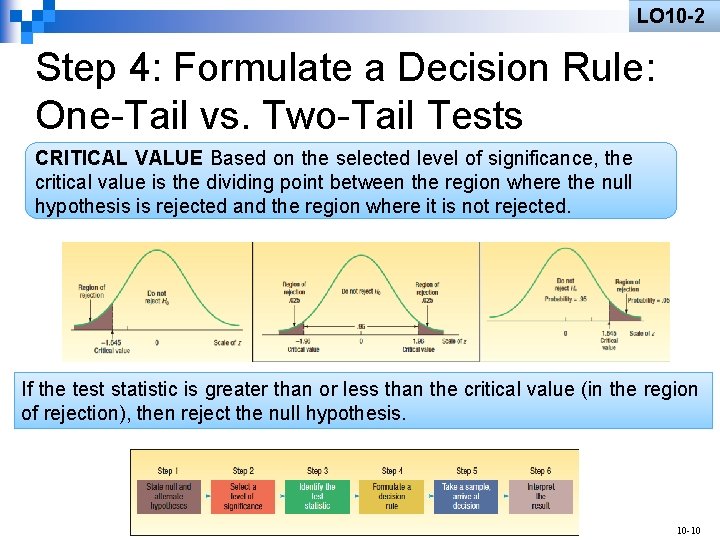
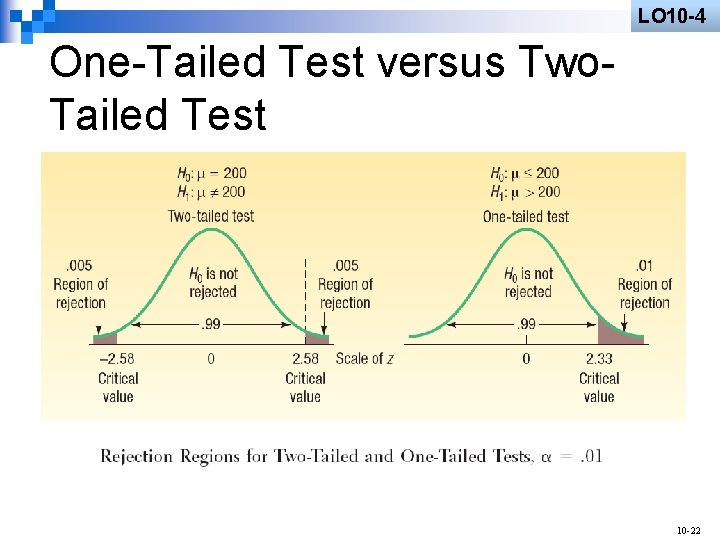
LO 10 -2 Step 4: Formulate a Decision Rule: One-Tail vs. Two-Tail Tests CRITICAL VALUE Based on the selected level of significance, the critical value is the dividing point between the region where the null hypothesis is rejected and the region where it is not rejected. If the test statistic is greater than or less than the critical value (in the region of rejection), then reject the null hypothesis. 10 10 -10
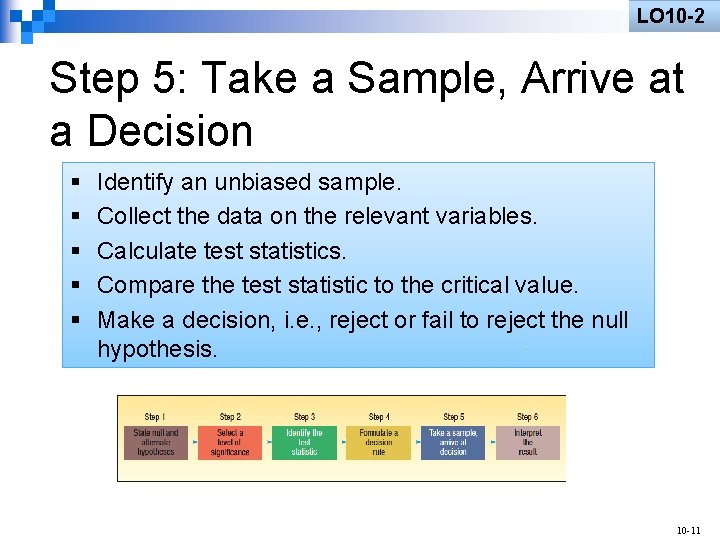
LO 10 -2 Step 5: Take a Sample, Arrive at a Decision § § § Identify an unbiased sample. Collect the data on the relevant variables. Calculate test statistics. Compare the test statistic to the critical value. Make a decision, i. e. , reject or fail to reject the null hypothesis. 10 -11
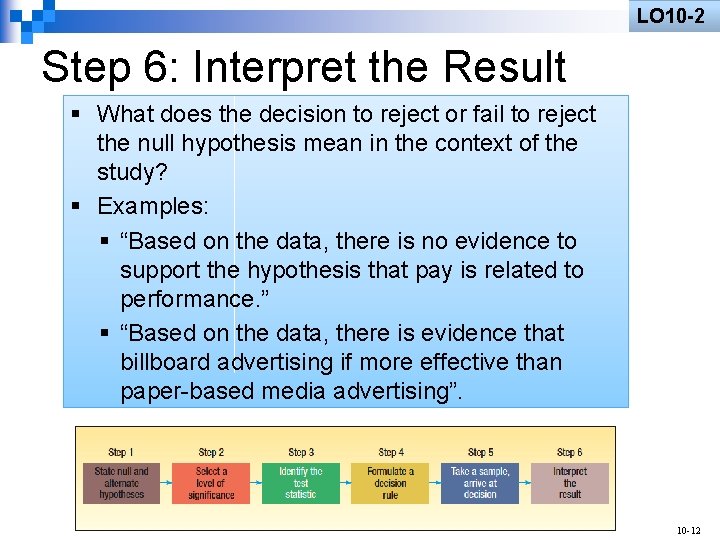
LO 10 -2 Step 6: Interpret the Result § What does the decision to reject or fail to reject the null hypothesis mean in the context of the study? § Examples: § “Based on the data, there is no evidence to support the hypothesis that pay is related to performance. ” § “Based on the data, there is evidence that billboard advertising if more effective than paper-based media advertising”. 10 -12
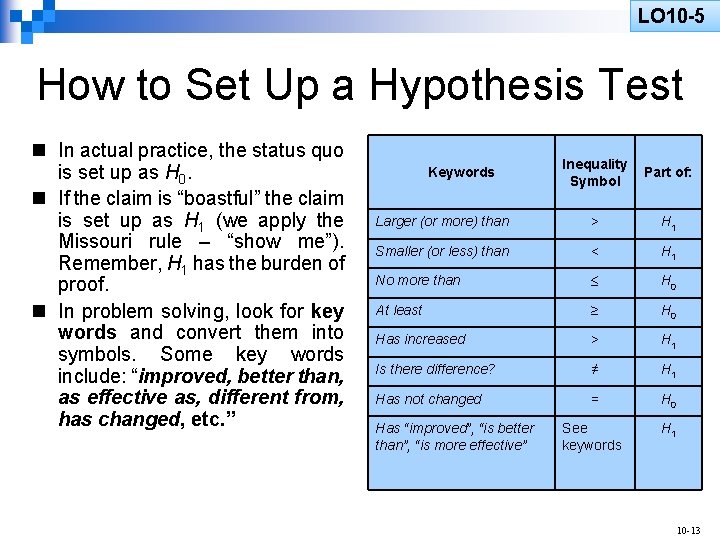
LO 10 -5 LO 10 -3 How to Set Up a Hypothesis Test n In actual practice, the status quo is set up as H 0. n If the claim is “boastful” the claim is set up as H 1 (we apply the Missouri rule – “show me”). Remember, H 1 has the burden of proof. n In problem solving, look for key words and convert them into symbols. Some key words include: “improved, better than, as effective as, different from, has changed, etc. ” Inequality Symbol Part of: Larger (or more) than > H 1 Smaller (or less) than < H 1 No more than H 0 At least ≥ H 0 Has increased > H 1 Is there difference? ≠ H 1 Has not changed = H 0 See keywords H 1 Keywords Has “improved”, “is better than”, “is more effective” 10 -13
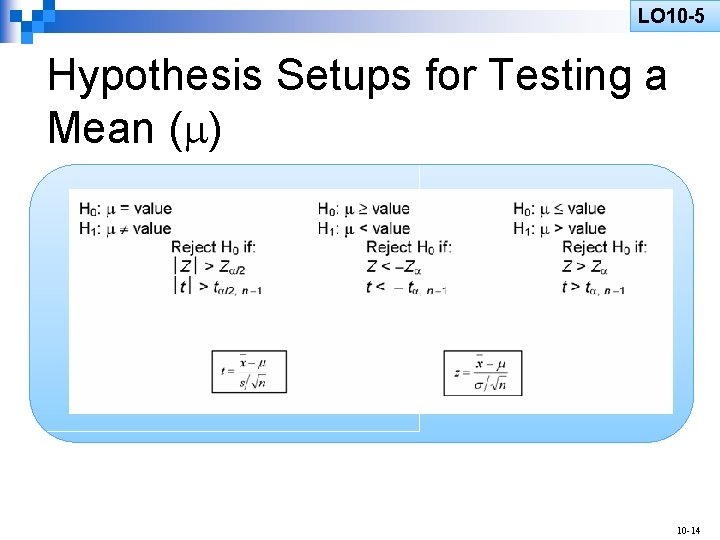
LO 10 -5 LO 10 -3 Hypothesis Setups for Testing a Mean ( ) 10 -14
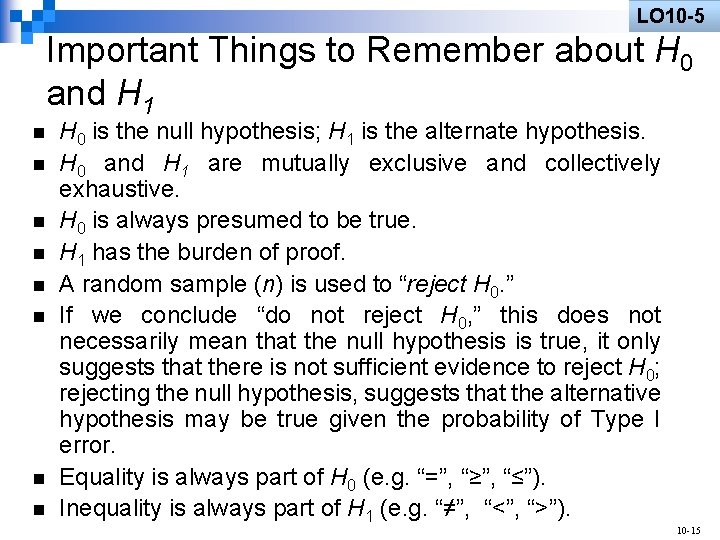
LO 10 -5 Important Things to Remember about H 0 and H 1 n n n n H 0 is the null hypothesis; H 1 is the alternate hypothesis. H 0 and H 1 are mutually exclusive and collectively exhaustive. H 0 is always presumed to be true. H 1 has the burden of proof. A random sample (n) is used to “reject H 0. ” If we conclude “do not reject H 0, ” this does not necessarily mean that the null hypothesis is true, it only suggests that there is not sufficient evidence to reject H 0; rejecting the null hypothesis, suggests that the alternative hypothesis may be true given the probability of Type I error. Equality is always part of H 0 (e. g. “=”, “≥”, “≤”). Inequality is always part of H 1 (e. g. “≠”, “<”, “>”). 10 -15
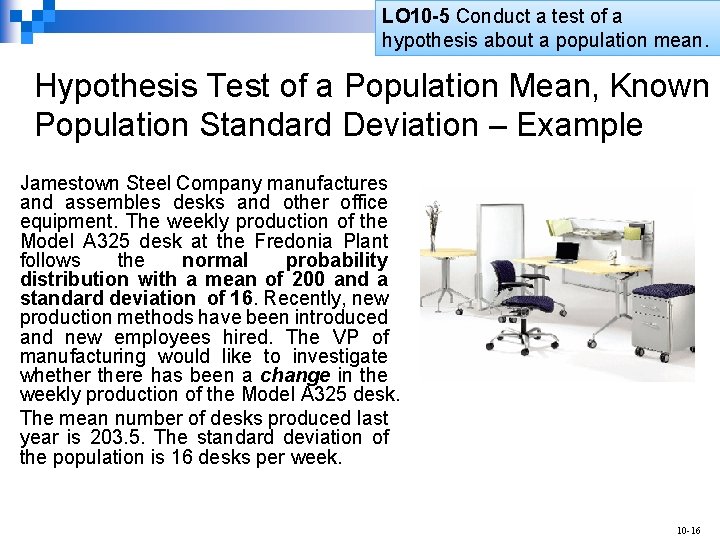
LO 10 -5 Conduct a test of a hypothesis about a population mean. Hypothesis Test of a Population Mean, Known Population Standard Deviation – Example Jamestown Steel Company manufactures and assembles desks and other office equipment. The weekly production of the Model A 325 desk at the Fredonia Plant follows the normal probability distribution with a mean of 200 and a standard deviation of 16. Recently, new production methods have been introduced and new employees hired. The VP of manufacturing would like to investigate whethere has been a change in the weekly production of the Model A 325 desk. The mean number of desks produced last year is 203. 5. The standard deviation of the population is 16 desks per week. 10 -16
LO 10 -3 Hypothesis Test of a Population Mean, Known Population Standard Deviation – Example Step 1: State the null and alternate hypotheses. H 0: = 200 H 1: ≠ 200 (Note: The keyword in the problem “has changed. ”) Step 2: Select the level of significance. α = 0. 01 as stated in the problem. 10 -17
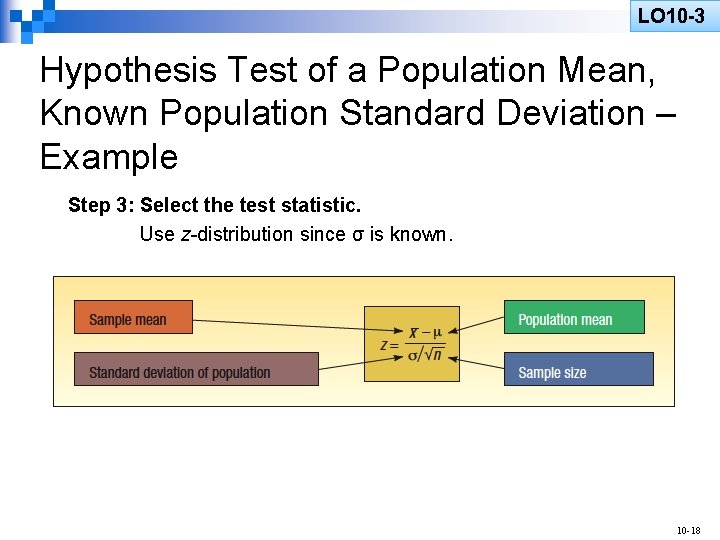
LO 10 -3 Hypothesis Test of a Population Mean, Known Population Standard Deviation – Example Step 3: Select the test statistic. Use z-distribution since σ is known. 10 -18
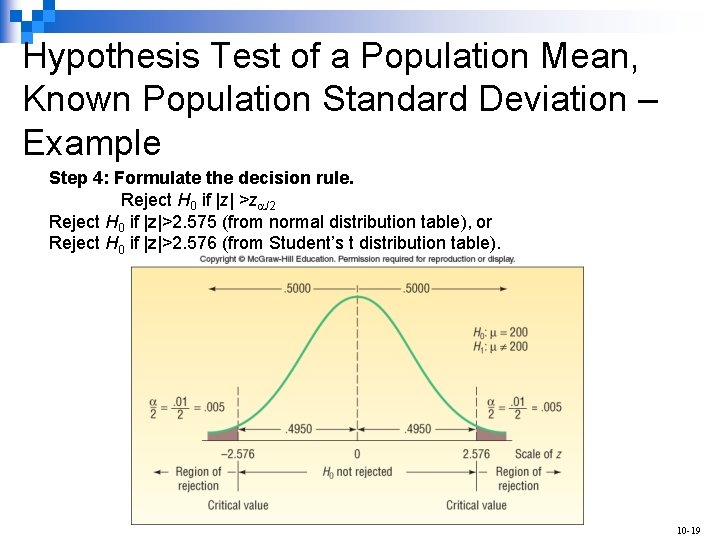
Hypothesis Test of a Population Mean, Known Population Standard Deviation – Example Step 4: Formulate the decision rule. Reject H 0 if |z| >z /2 Reject H 0 if |z|>2. 575 (from normal distribution table), or Reject H 0 if |z|>2. 576 (from Student’s t distribution table). 10 -19
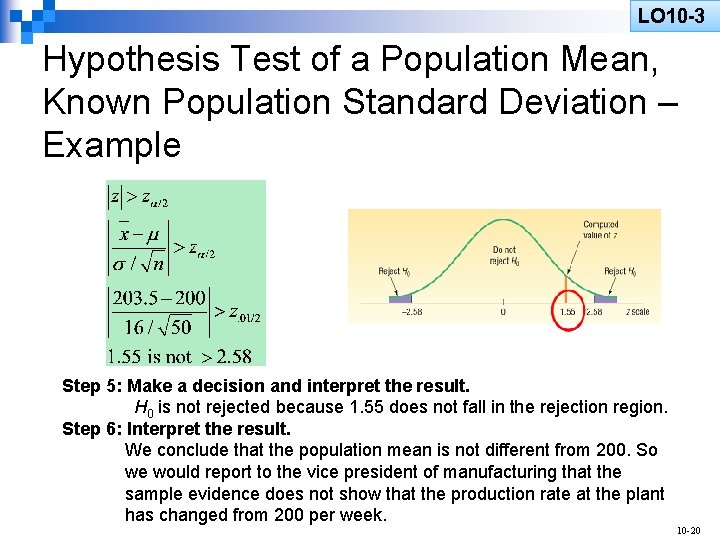
LO 10 -3 Hypothesis Test of a Population Mean, Known Population Standard Deviation – Example Step 5: Make a decision and interpret the result. H 0 is not rejected because 1. 55 does not fall in the rejection region. Step 6: Interpret the result. We conclude that the population mean is not different from 200. So we would report to the vice president of manufacturing that the sample evidence does not show that the production rate at the plant has changed from 200 per week. 10 -20
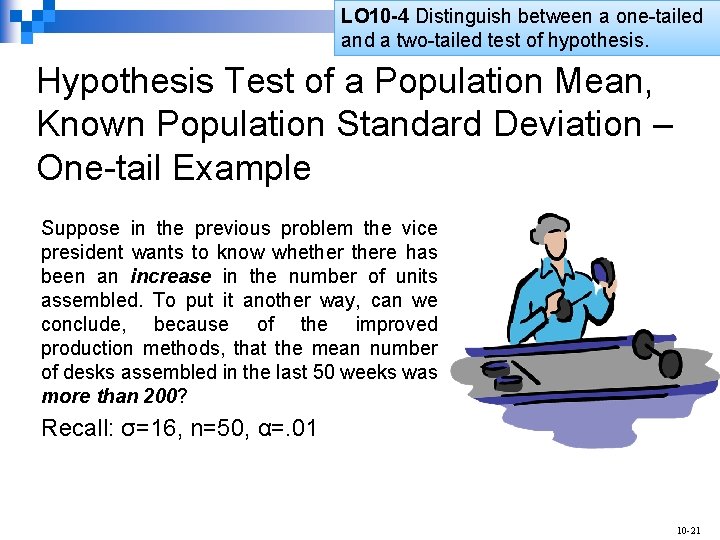
LO 10 -5 LO 6 LO 10 -4 Distinguish between a one-tailed and a two-tailed test of hypothesis. Hypothesis Test of a Population Mean, Known Population Standard Deviation – One-tail Example Suppose in the previous problem the vice president wants to know whethere has been an increase in the number of units assembled. To put it another way, can we conclude, because of the improved production methods, that the mean number of desks assembled in the last 50 weeks was more than 200? Recall: σ=16, n=50, α=. 01 10 -21
LO 10 -4 One-Tailed Test versus Two. Tailed Test 10 -22
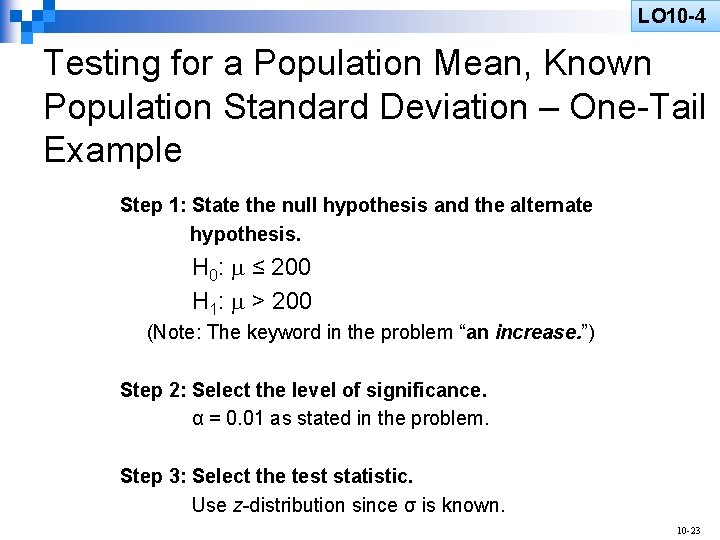
LO 10 -4 Testing for a Population Mean, Known Population Standard Deviation – One-Tail Example Step 1: State the null hypothesis and the alternate hypothesis. H 0: ≤ 200 H 1: > 200 (Note: The keyword in the problem “an increase. ”) Step 2: Select the level of significance. α = 0. 01 as stated in the problem. Step 3: Select the test statistic. Use z-distribution since σ is known. 10 -23
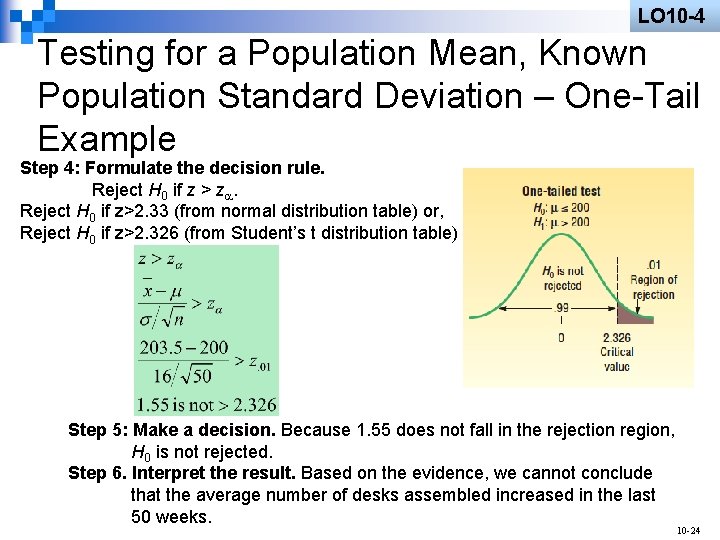
LO 10 -4 Testing for a Population Mean, Known Population Standard Deviation – One-Tail Example Step 4: Formulate the decision rule. Reject H 0 if z > z. Reject H 0 if z>2. 33 (from normal distribution table) or, Reject H 0 if z>2. 326 (from Student’s t distribution table) Step 5: Make a decision. Because 1. 55 does not fall in the rejection region, H 0 is not rejected. Step 6. Interpret the result. Based on the evidence, we cannot conclude that the average number of desks assembled increased in the last 50 weeks. 10 -24
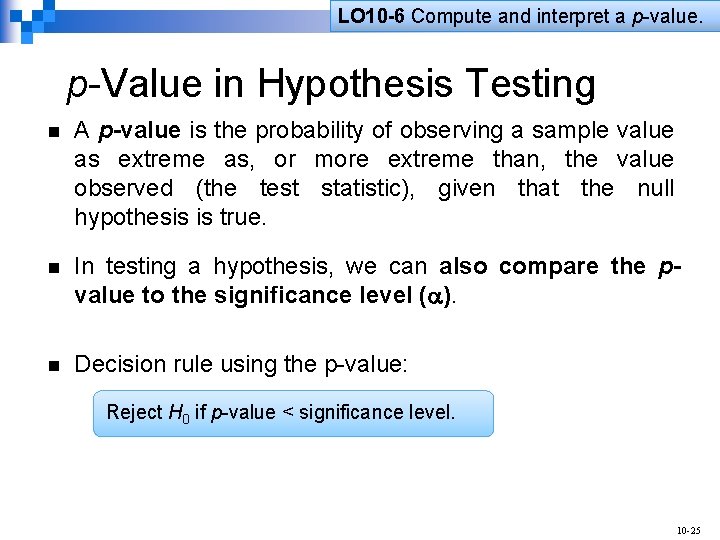
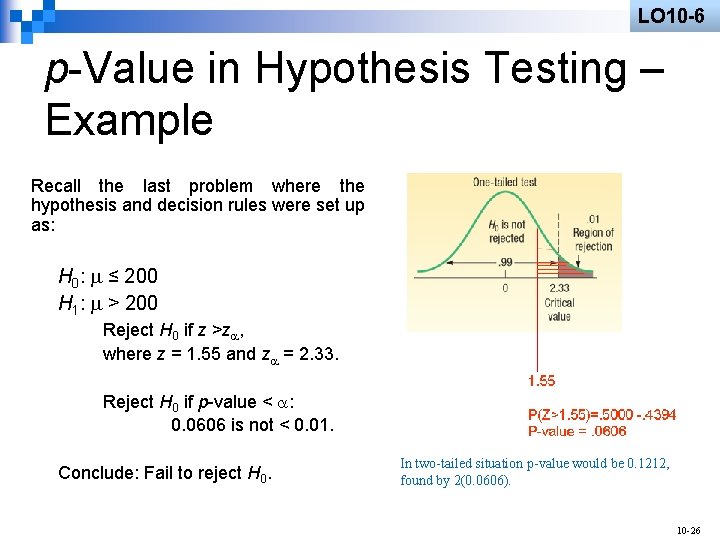
LO 10 -6 Compute and interpret a p-value. p-Value in Hypothesis Testing n A p-value is the probability of observing a sample value as extreme as, or more extreme than, the value observed (the test statistic), given that the null hypothesis is true. n In testing a hypothesis, we can also compare the pvalue to the significance level ( ). n Decision rule using the p-value: Reject H 0 if p-value < significance level. 10 -25
LO 10 -6 p-Value in Hypothesis Testing – Example Recall the last problem where the hypothesis and decision rules were set up as: H 0: ≤ 200 H 1: > 200 Reject H 0 if z >z , where z = 1. 55 and z = 2. 33. Reject H 0 if p-value < : 0. 0606 is not < 0. 01. Conclude: Fail to reject H 0. In two-tailed situation p-value would be 0. 1212, found by 2(0. 0606). 10 -26
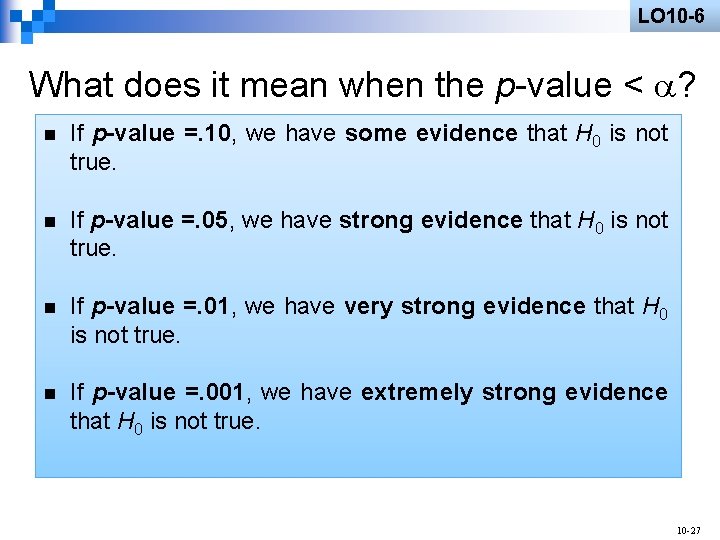
LO 10 -6 What does it mean when the p-value < ? n If p-value =. 10, we have some evidence that H 0 is not true. n If p-value =. 05, we have strong evidence that H 0 is not true. n If p-value =. 01, we have very strong evidence that H 0 is not true. n If p-value =. 001, we have extremely strong evidence that H 0 is not true. 10 -27
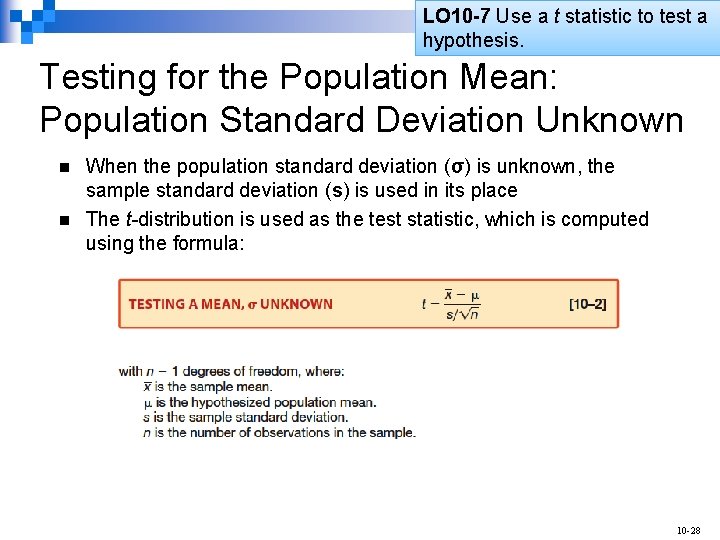
LO 10 -7 Use a t statistic to test a hypothesis. Testing for the Population Mean: Population Standard Deviation Unknown n n When the population standard deviation (σ) is unknown, the sample standard deviation (s) is used in its place The t-distribution is used as the test statistic, which is computed using the formula: 10 -28
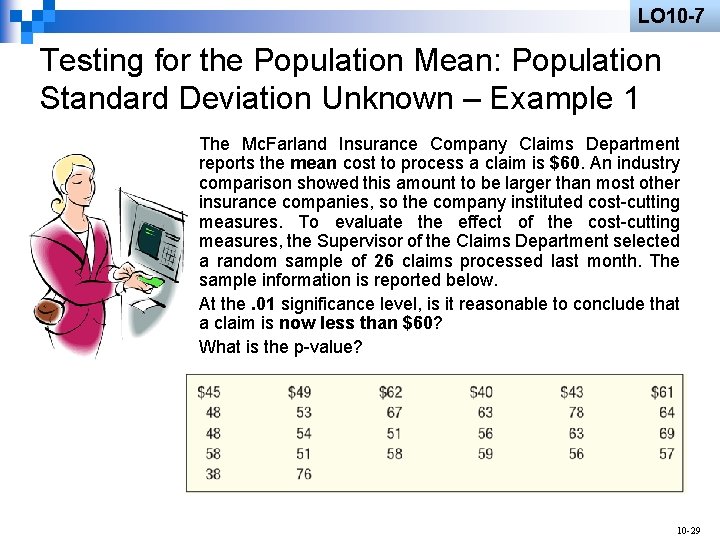
LO 10 -7 Testing for the Population Mean: Population Standard Deviation Unknown – Example 1 The Mc. Farland Insurance Company Claims Department reports the mean cost to process a claim is $60. An industry comparison showed this amount to be larger than most other insurance companies, so the company instituted cost-cutting measures. To evaluate the effect of the cost-cutting measures, the Supervisor of the Claims Department selected a random sample of 26 claims processed last month. The sample information is reported below. At the. 01 significance level, is it reasonable to conclude that a claim is now less than $60? What is the p-value? 10 -29
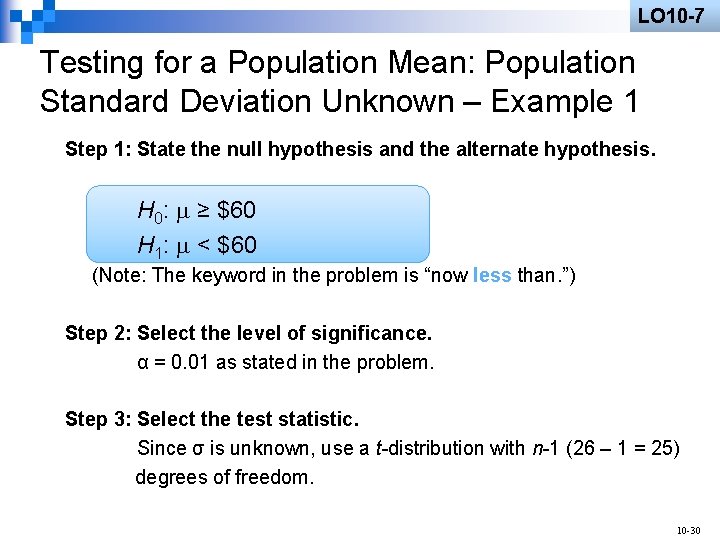
LO 10 -7 Testing for a Population Mean: Population Standard Deviation Unknown – Example 1 Step 1: State the null hypothesis and the alternate hypothesis. H 0: ≥ $60 H 1: < $60 (Note: The keyword in the problem is “now less than. ”) Step 2: Select the level of significance. α = 0. 01 as stated in the problem. Step 3: Select the test statistic. Since σ is unknown, use a t-distribution with n-1 (26 – 1 = 25) degrees of freedom. 10 -30
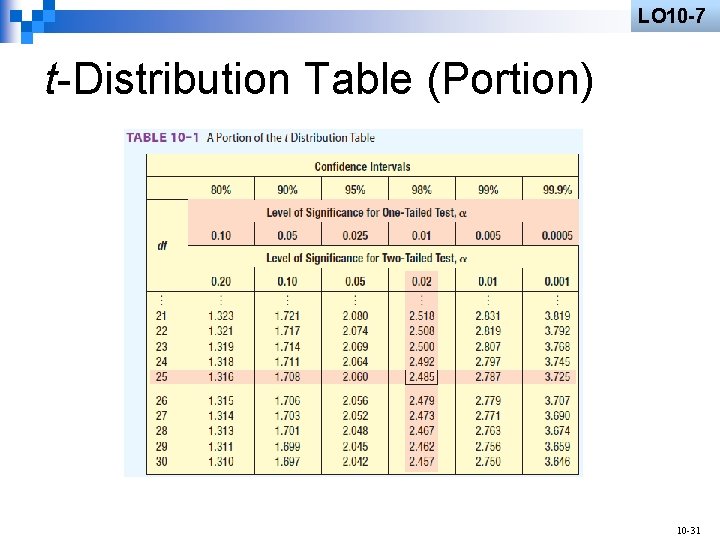
LO 10 -7 t-Distribution Table (Portion) 10 -31
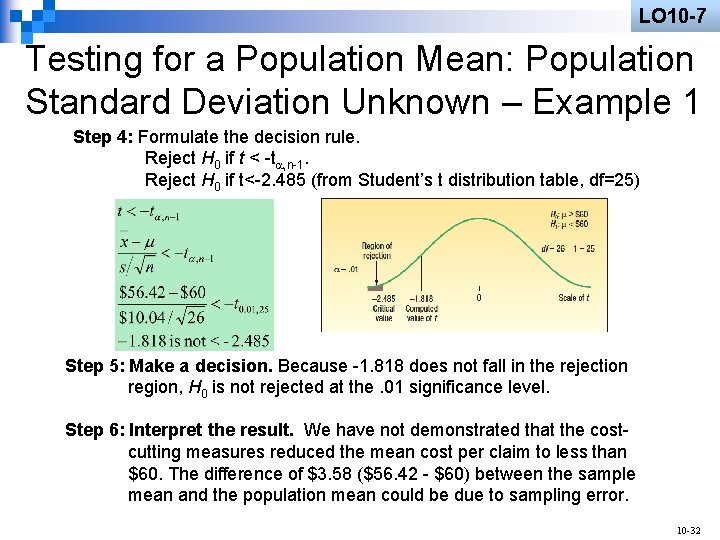
LO 10 -7 Testing for a Population Mean: Population Standard Deviation Unknown – Example 1 Step 4: Formulate the decision rule. Reject H 0 if t < -t , n-1. Reject H 0 if t<-2. 485 (from Student’s t distribution table, df=25) Step 5: Make a decision. Because -1. 818 does not fall in the rejection region, H 0 is not rejected at the. 01 significance level. Step 6: Interpret the result. We have not demonstrated that the costcutting measures reduced the mean cost per claim to less than $60. The difference of $3. 58 ($56. 42 - $60) between the sample mean and the population mean could be due to sampling error. 10 -32
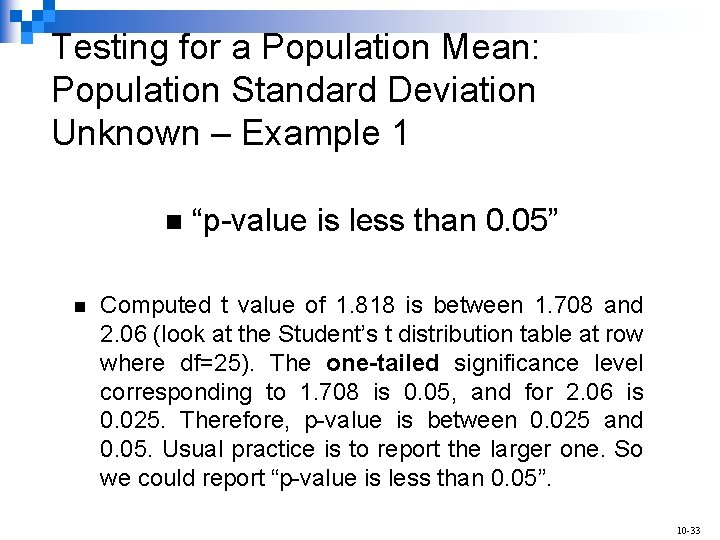
Testing for a Population Mean: Population Standard Deviation Unknown – Example 1 n n “p-value is less than 0. 05” Computed t value of 1. 818 is between 1. 708 and 2. 06 (look at the Student’s t distribution table at row where df=25). The one-tailed significance level corresponding to 1. 708 is 0. 05, and for 2. 06 is 0. 025. Therefore, p-value is between 0. 025 and 0. 05. Usual practice is to report the larger one. So we could report “p-value is less than 0. 05”. 10 -33
LO 10 -7 Testing for a Population Mean: Population Standard Deviation Unknown – Example 2 The current rate for producing 5 amp fuses at Neary Electric Co. is 250 per hour. A new machine has been purchased and installed that, according to the supplier, will increase the production rate. A sample of 10 randomly selected hours from last month revealed the mean hourly production on the new machine was 256 units, with a sample standard deviation of 6 per hour. At the. 05 significance level, can Neary conclude that the new machine is faster? What is the p-value? 10 -34
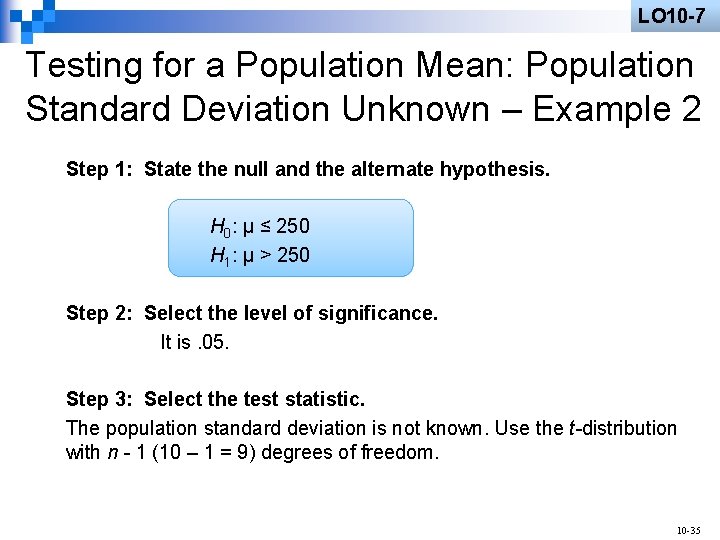
LO 10 -7 Testing for a Population Mean: Population Standard Deviation Unknown – Example 2 Step 1: State the null and the alternate hypothesis. H 0: µ ≤ 250 H 1: µ > 250 Step 2: Select the level of significance. It is. 05. Step 3: Select the test statistic. The population standard deviation is not known. Use the t-distribution with n - 1 (10 – 1 = 9) degrees of freedom. 10 -35
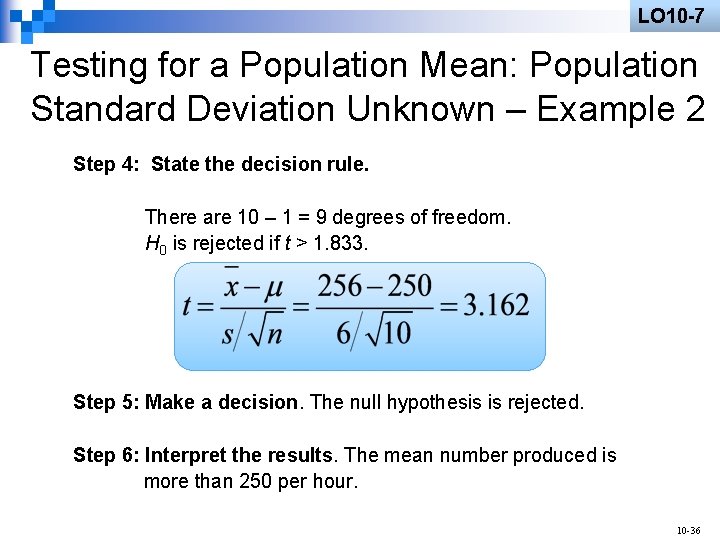
LO 10 -7 Testing for a Population Mean: Population Standard Deviation Unknown – Example 2 Step 4: State the decision rule. There are 10 – 1 = 9 degrees of freedom. H 0 is rejected if t > 1. 833. Step 5: Make a decision. The null hypothesis is rejected. Step 6: Interpret the results. The mean number produced is more than 250 per hour. 10 -36
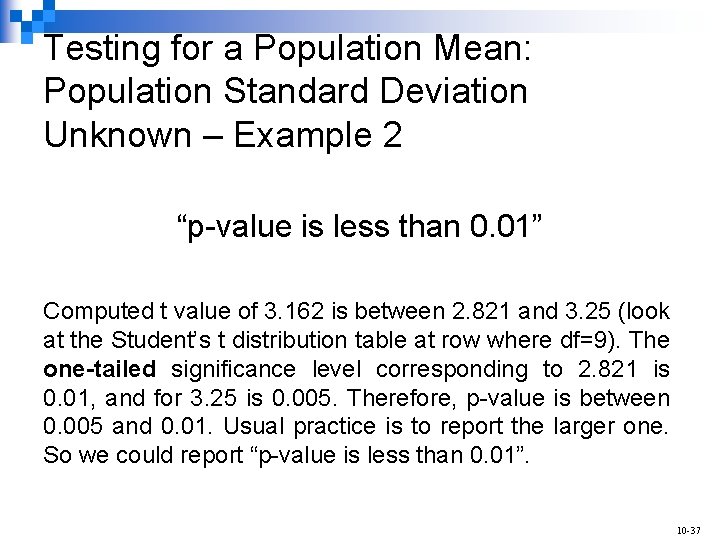
Testing for a Population Mean: Population Standard Deviation Unknown – Example 2 “p-value is less than 0. 01” Computed t value of 3. 162 is between 2. 821 and 3. 25 (look at the Student’s t distribution table at row where df=9). The one-tailed significance level corresponding to 2. 821 is 0. 01, and for 3. 25 is 0. 005. Therefore, p-value is between 0. 005 and 0. 01. Usual practice is to report the larger one. So we could report “p-value is less than 0. 01”. 10 -37
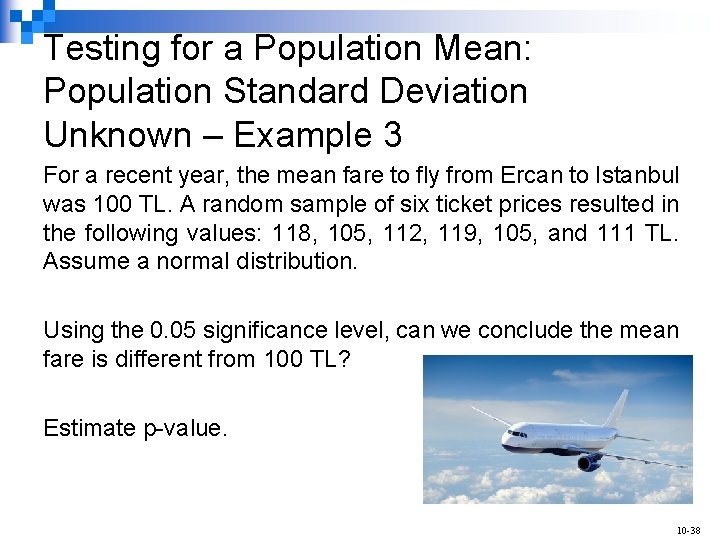
Testing for a Population Mean: Population Standard Deviation Unknown – Example 3 For a recent year, the mean fare to fly from Ercan to Istanbul was 100 TL. A random sample of six ticket prices resulted in the following values: 118, 105, 112, 119, 105, and 111 TL. Assume a normal distribution. Using the 0. 05 significance level, can we conclude the mean fare is different from 100 TL? Estimate p-value. 10 -38
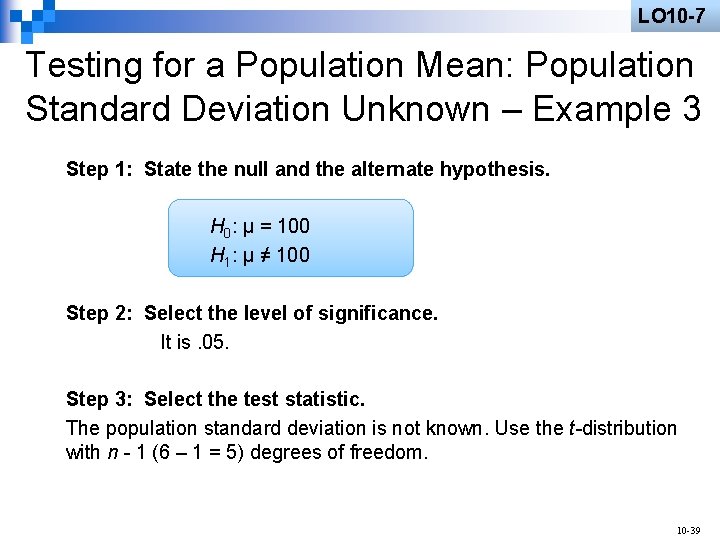
LO 10 -7 Testing for a Population Mean: Population Standard Deviation Unknown – Example 3 Step 1: State the null and the alternate hypothesis. H 0: µ = 100 H 1: µ ≠ 100 Step 2: Select the level of significance. It is. 05. Step 3: Select the test statistic. The population standard deviation is not known. Use the t-distribution with n - 1 (6 – 1 = 5) degrees of freedom. 10 -39
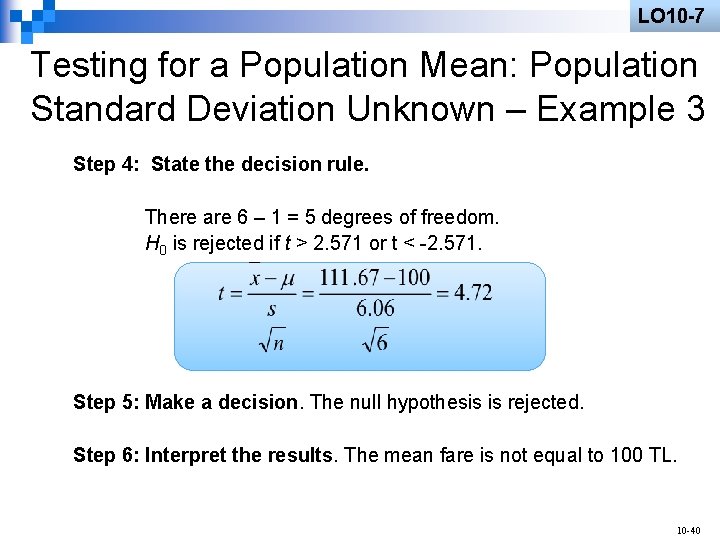
LO 10 -7 Testing for a Population Mean: Population Standard Deviation Unknown – Example 3 Step 4: State the decision rule. There are 6 – 1 = 5 degrees of freedom. H 0 is rejected if t > 2. 571 or t < -2. 571. Step 5: Make a decision. The null hypothesis is rejected. Step 6: Interpret the results. The mean fare is not equal to 100 TL. 10 -40
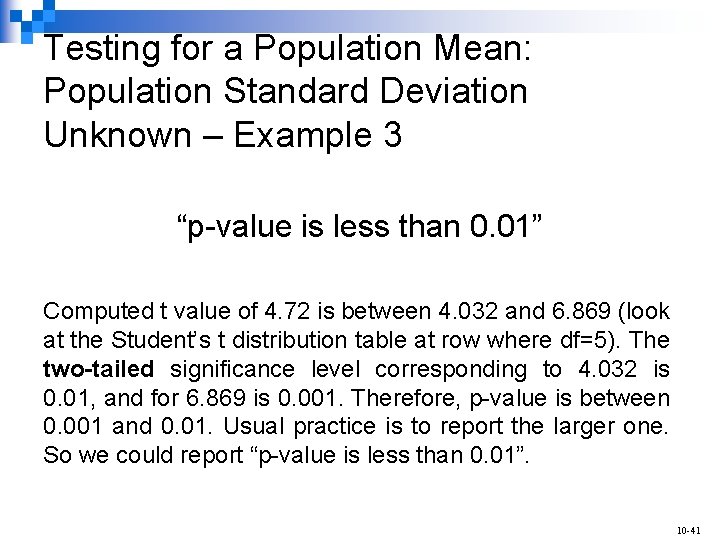
Testing for a Population Mean: Population Standard Deviation Unknown – Example 3 “p-value is less than 0. 01” Computed t value of 4. 72 is between 4. 032 and 6. 869 (look at the Student’s t distribution table at row where df=5). The two-tailed significance level corresponding to 4. 032 is 0. 01, and for 6. 869 is 0. 001. Therefore, p-value is between 0. 001 and 0. 01. Usual practice is to report the larger one. So we could report “p-value is less than 0. 01”. 10 -41