
OnePass Wavelet Synopses for MaximumError Metrics Panagiotis Karras


- Slides: 35
One-Pass Wavelet Synopses for Maximum-Error Metrics Panagiotis Karras Trondheim, August 31 st, 2005 Research at HKU with Nikos Mamoulis
Outline • Preliminaries & Motivation – Usefulness of Synopses – Haar wavelet decomposition, conventional wavelet synopses – The maximum error guarantee problem • Earlier Approach: Wavelet Synopses with Optimal Error Guarantees – Impracticability of this approach • Solution: Practicable Wavelet Synopses for Maximum Error Metrics – Low-Complexity Algorithms that provide near-optimal error results • Extension to Data Streams – One-Pass adaptations of the proposed algorithms • Conclusions & Future Directions
Compact Data Synopses useful in: • Approximate Query Processing (exact answers not always required) • Learning, Classification, Event Detection • Data Mining, Selectivity Estimation • Situations where massive data arrives in a stream
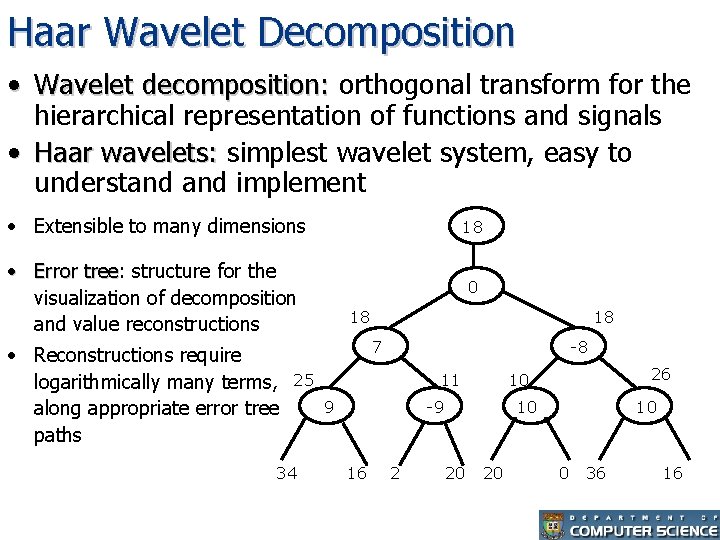
Haar Wavelet Decomposition • Wavelet decomposition: orthogonal transform for the hierarchical representation of functions and signals • Haar wavelets: simplest wavelet system, easy to understand implement • Extensible to many dimensions 18 • Error tree: tree structure for the visualization of decomposition and value reconstructions • Reconstructions require logarithmically many terms, along appropriate error tree paths 0 18 18 7 -8 25 34 11 9 -9 16 2 26 10 10 20 20 10 0 36 16
Wavelet Synopses • Compute Haar wavelet decomposition of D • Coefficient thresholding : retain B coefficients, B<<|D| • Approximate query engine can operate over such compact synopses – [MVW, SIGMOD’ 98]; [VW, SIGMOD’ 99]; [CGRS, VLDB’ 00] • Conventional approach: Retain B largest coefficients in absolute normalized value – Normalized Haar basis: divide coefficients at resolution j by – Minimizes the Total Squared (L 2) Error • However…
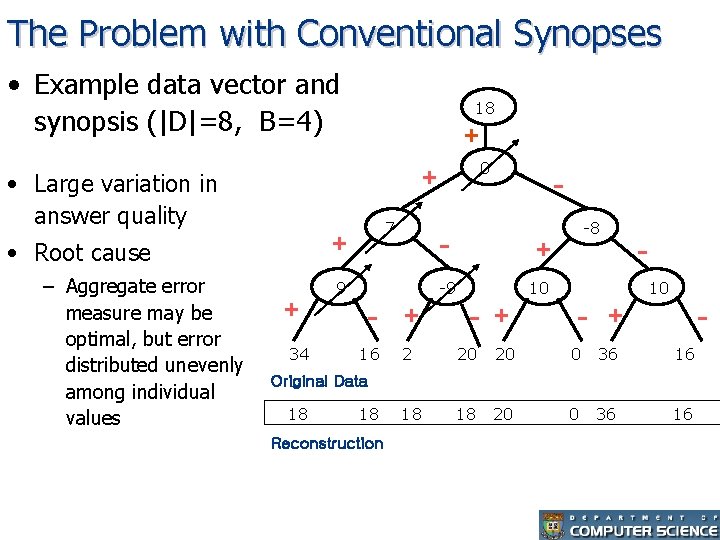
The Problem with Conventional Synopses • Example data vector and synopsis (|D|=8, B=4) 18 + • Large variation in answer quality 7 + • Root cause – Aggregate error measure may be optimal, but error distributed unevenly among individual values 0 + + 34 9 - - + -9 10 - + -8 10 - + - 16 2 20 20 0 36 16 18 18 20 0 36 16 Original Data 18 18 Reconstruction
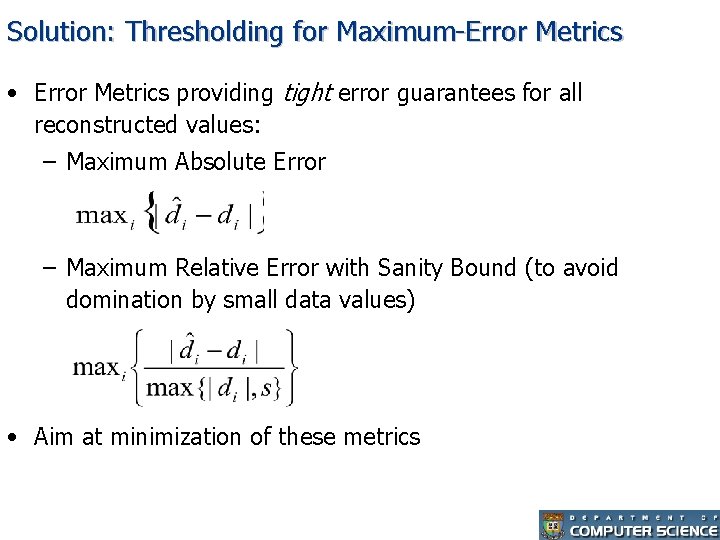
Solution: Thresholding for Maximum-Error Metrics • Error Metrics providing tight error guarantees for all reconstructed values: – Maximum Absolute Error – Maximum Relative Error with Sanity Bound (to avoid domination by small data values) • Aim at minimization of these metrics
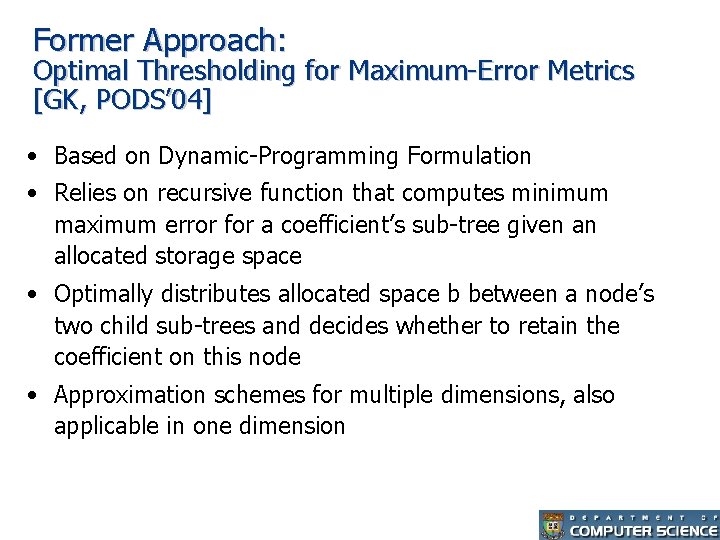
Former Approach: Optimal Thresholding for Maximum-Error Metrics [GK, PODS’ 04] • Based on Dynamic-Programming Formulation • Relies on recursive function that computes minimum maximum error for a coefficient’s sub-tree given an allocated storage space • Optimally distributes allocated space b between a node’s two child sub-trees and decides whether to retain the coefficient on this node • Approximation schemes for multiple dimensions, also applicable in one dimension
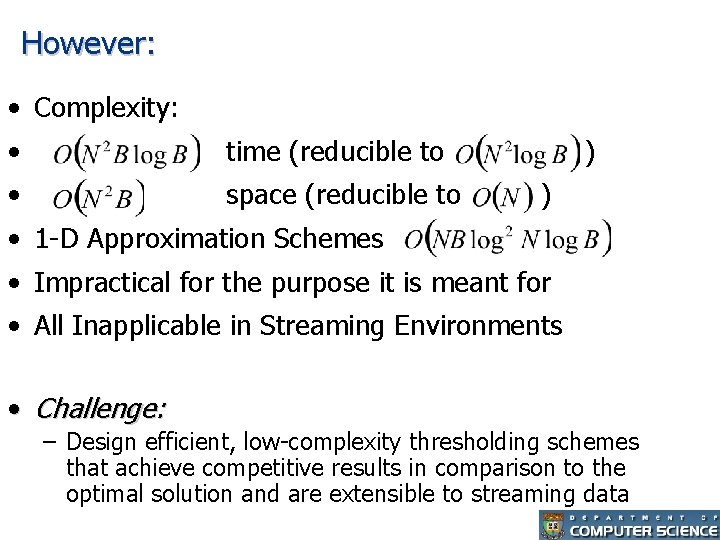
However: • Complexity: • time (reducible to • space (reducible to ) ) • 1 -D Approximation Schemes • Impractical for the purpose it is meant for • All Inapplicable in Streaming Environments • Challenge: – Design efficient, low-complexity thresholding schemes that achieve competitive results in comparison to the optimal solution and are extensible to streaming data
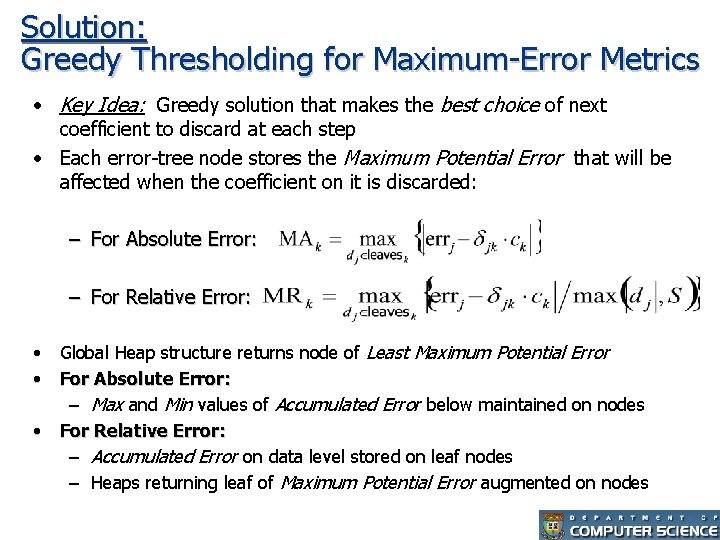
Solution: Greedy Thresholding for Maximum-Error Metrics • Key Idea: Greedy solution that makes the best choice of next coefficient to discard at each step • Each error-tree node stores the Maximum Potential Error that will be affected when the coefficient on it is discarded: – For Absolute Error: – For Relative Error: • Global Heap structure returns node of Least Maximum Potential Error • For Absolute Error: – Max and Min values of Accumulated Error below maintained on nodes • For Relative Error: – Accumulated Error on data level stored on leaf nodes – Heaps returning leaf of Maximum Potential Error augmented on nodes
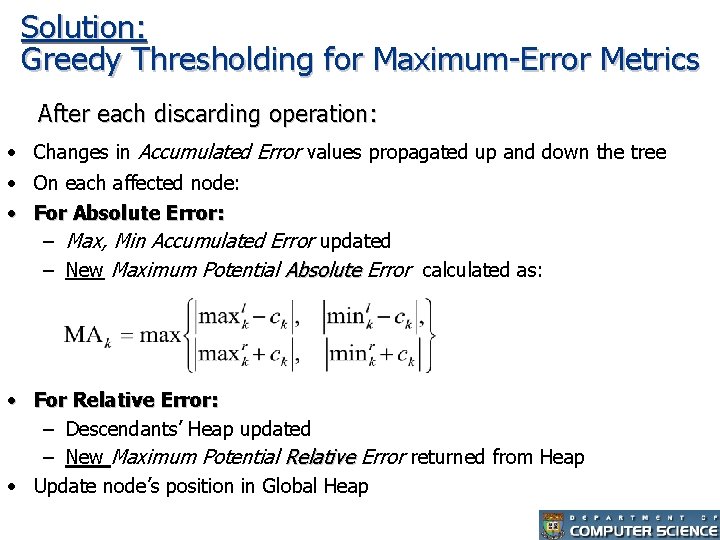
Solution: Greedy Thresholding for Maximum-Error Metrics After each discarding operation: • Changes in Accumulated Error values propagated up and down the tree • On each affected node: • For Absolute Error: – Max, Min Accumulated Error updated – New Maximum Potential Absolute Error calculated as: • For Relative Error: – Descendants’ Heap updated – New Maximum Potential Relative Error returned from Heap • Update node’s position in Global Heap
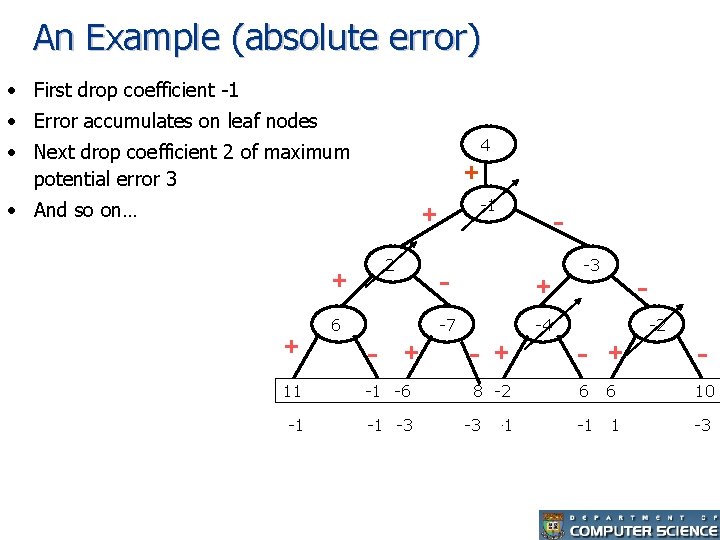
An Example (absolute error) • First drop coefficient -1 • Error accumulates on leaf nodes 4 • Next drop coefficient 2 of maximum potential error 3 + • And so on… -1 + 2 + + 6 - + -7 -4 -3 -2 - + - 6 10 11 -1 -6 8 -2 1 -1 -1 1 -31 -1 6 -1 -1 -3
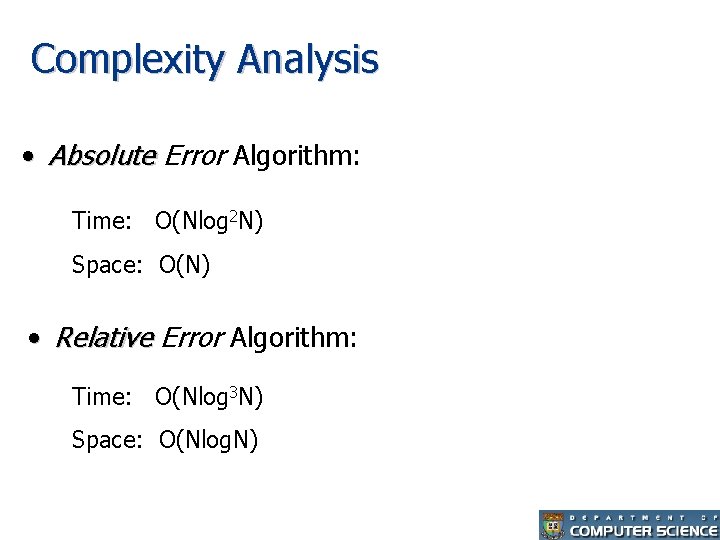
Complexity Analysis • Absolute Error Algorithm: Time: O(Nlog 2 N) Space: O(N) • Relative Error Algorithm: Time: O(Nlog 3 N) Space: O(Nlog. N)
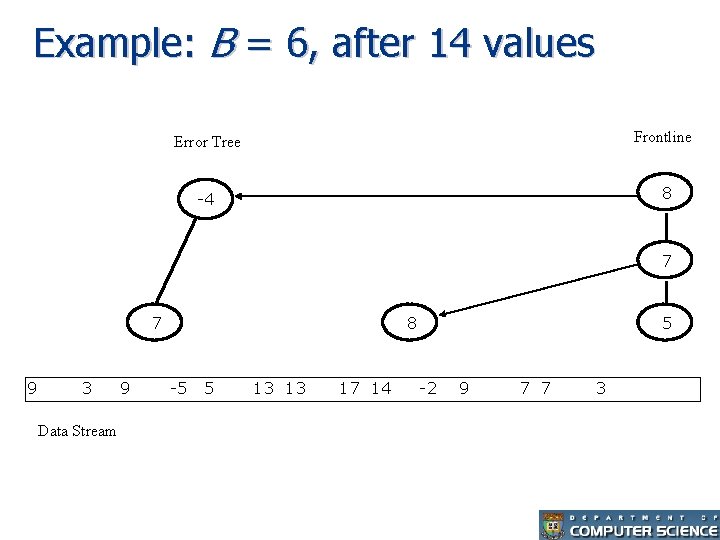
Extension to Data Streams • • Major application area Existing methods inapplicable Assumption: O(B ) available memory budget Further Problem: – Extend proposed methods to streams – One-pass overall process – Construct and truncate error-tree on-the-fly
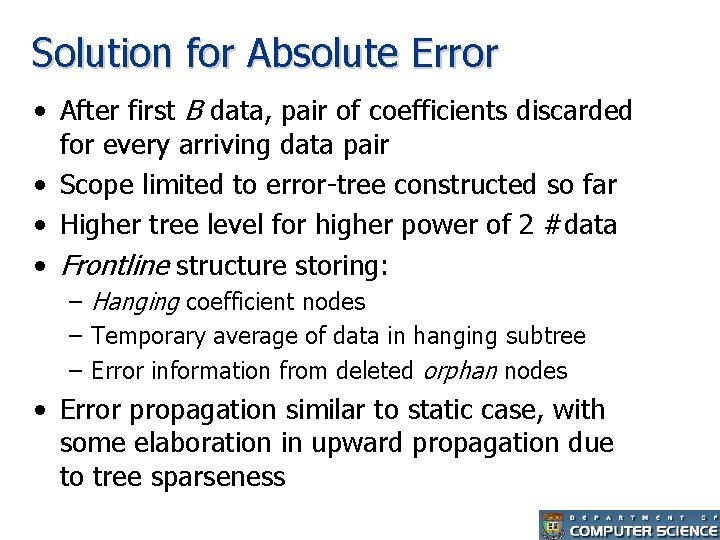
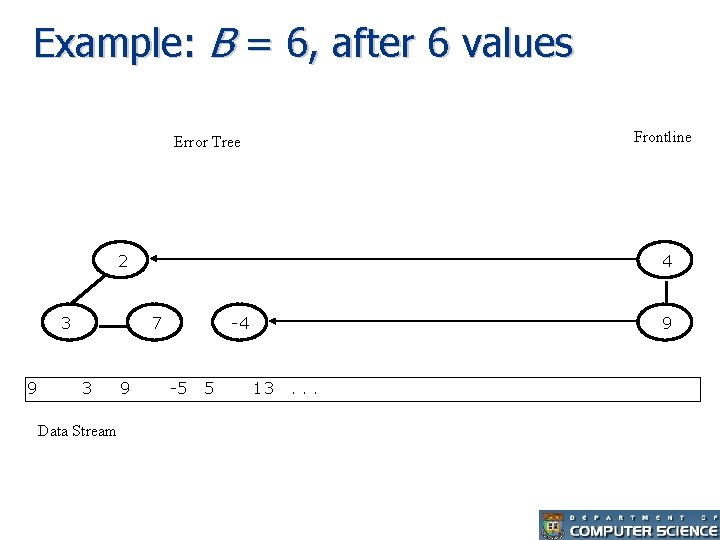
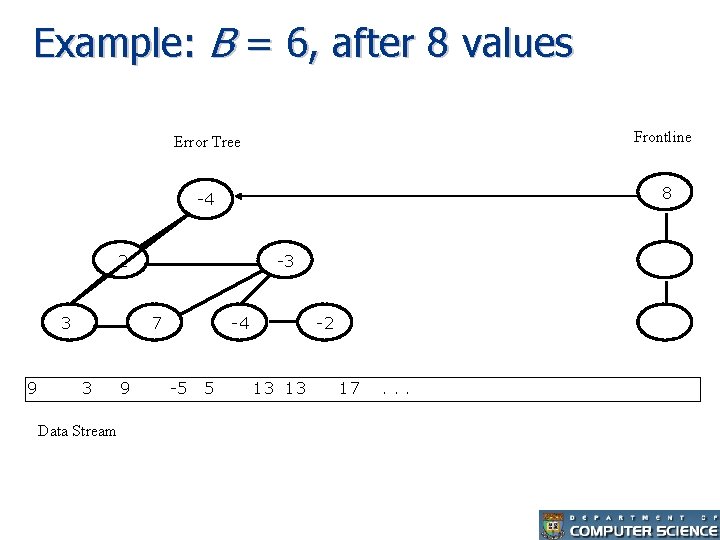
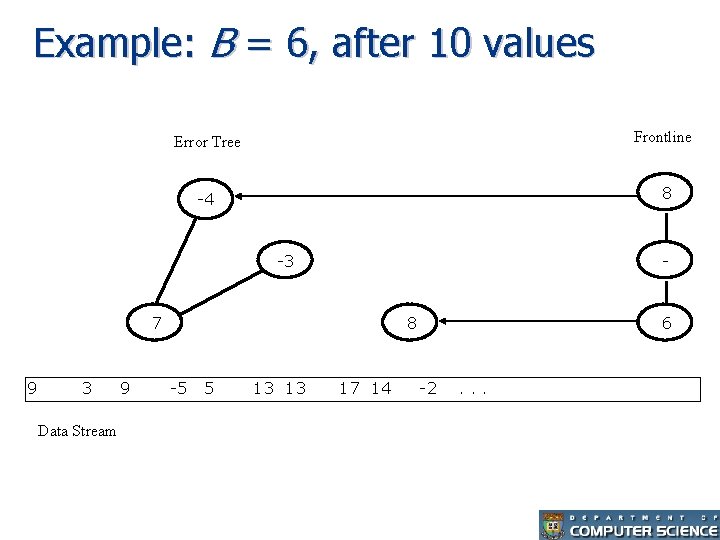
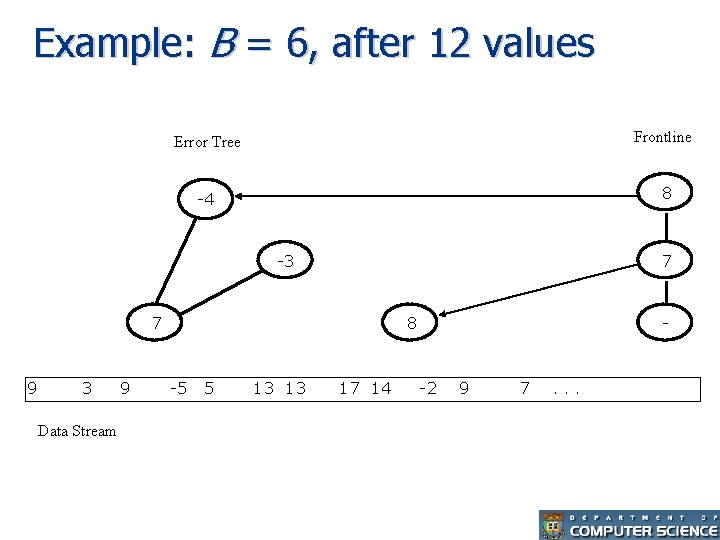
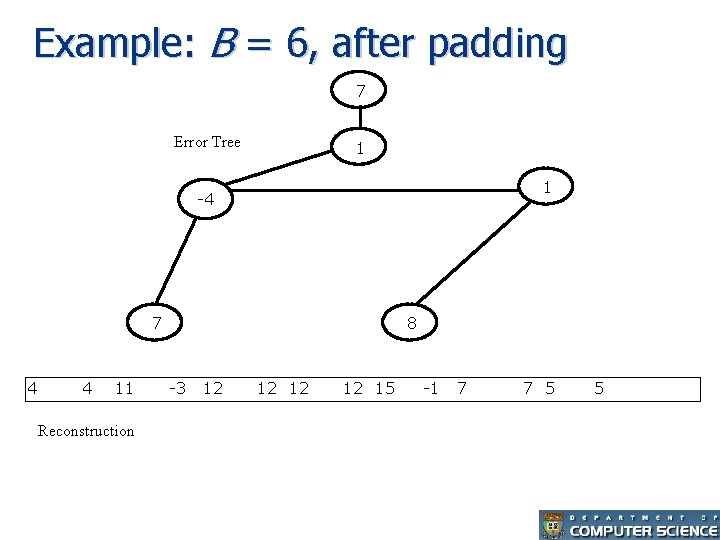
Solution for Absolute Error • After first B data, pair of coefficients discarded for every arriving data pair • Scope limited to error-tree constructed so far • Higher tree level for higher power of 2 #data • Frontline structure storing: – Hanging coefficient nodes – Temporary average of data in hanging subtree – Error information from deleted orphan nodes • Error propagation similar to static case, with some elaboration in upward propagation due to tree sparseness
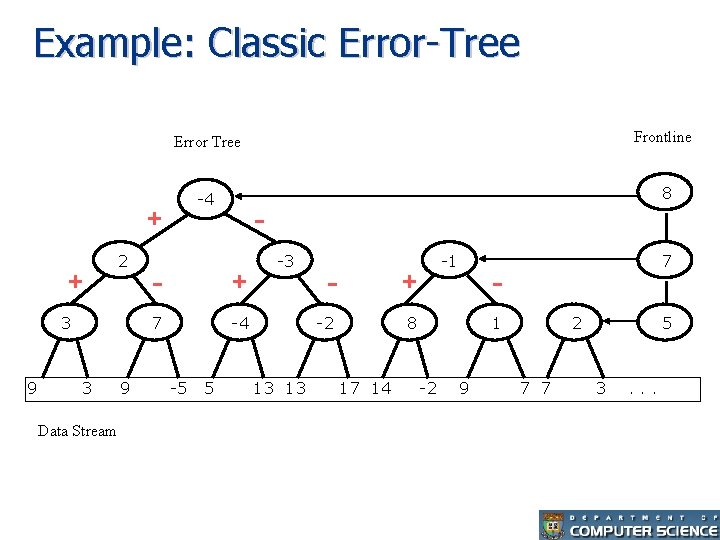
Example: Classic Error-Tree Error Tree Frontline -4 8 + + 2 3 9 3 Data Stream 9 - - + 7 -4 -5 5 -3 - + -2 13 13 -1 - 8 17 14 7 1 -2 9 2 7 7 5 3 . . .
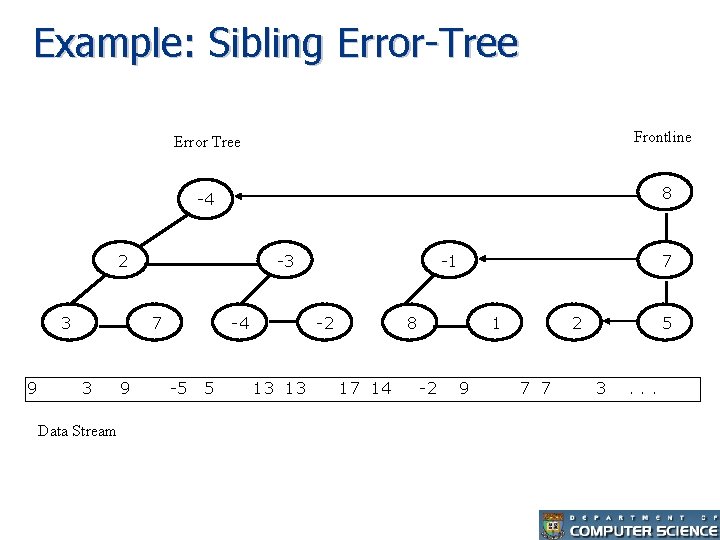
Example: Sibling Error-Tree Error Tree Frontline -4 8 2 3 9 -3 7 3 Data Stream 9 -4 -5 5 -1 -2 13 13 7 8 17 14 1 -2 9 2 7 7 5 3 . . .
Example: B = 6, after 6 values Frontline Error Tree 2 3 9 4 7 3 Data Stream 9 -4 -5 5 9 13 . . .
Example: B = 6, after 8 values Error Tree Frontline -4 8 2 3 9 -3 7 3 Data Stream 9 -4 -5 5 4 -2 13 13 9 17 . . .
Example: B = 6, after 10 values Error Tree Frontline -4 8 -3 - 7 9 3 Data Stream 9 8 -5 5 13 13 17 14 6 -2 . . .
Example: B = 6, after 12 values Error Tree Frontline -4 8 -3 7 7 9 3 Data Stream 9 8 -5 5 13 13 17 14 - -2 9 7 . . .
Example: B = 6, after 14 values Error Tree Frontline -4 8 7 7 9 3 Data Stream 9 8 -5 5 13 13 17 14 5 -2 9 7 7 3
Example: B = 6, after padding 7 Error Tree 1 1 -4 7 4 4 11 Reconstruction 8 -3 12 12 15 -1 7 7 5 5
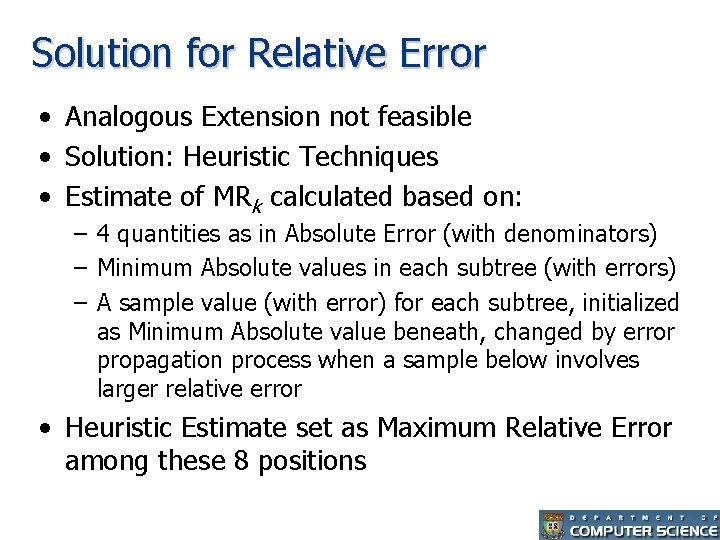
Solution for Relative Error • Analogous Extension not feasible • Solution: Heuristic Techniques • Estimate of MRk calculated based on: – 4 quantities as in Absolute Error (with denominators) – Minimum Absolute values in each subtree (with errors) – A sample value (with error) for each subtree, initialized as Minimum Absolute value beneath, changed by error propagation process when a sample below involves larger relative error • Heuristic Estimate set as Maximum Relative Error among these 8 positions
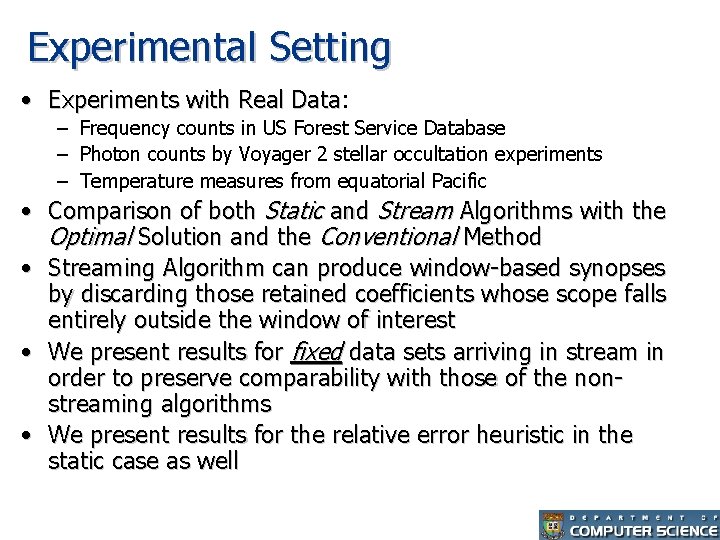
Experimental Setting • Experiments with Real Data: Data – Frequency counts in US Forest Service Database – Photon counts by Voyager 2 stellar occultation experiments – Temperature measures from equatorial Pacific • Comparison of both Static and Stream Algorithms with the Optimal Solution and the Conventional Method • Streaming Algorithm can produce window-based synopses by discarding those retained coefficients whose scope falls entirely outside the window of interest • We present results for fixed data sets arriving in stream in order to preserve comparability with those of the nonstreaming algorithms • We present results for the relative error heuristic in the static case as well
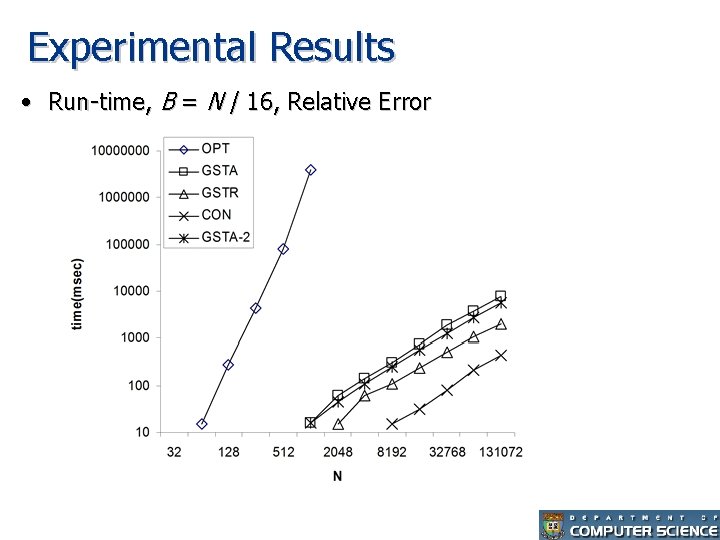
Experimental Results • Run-time, B = N / 16, Relative Error
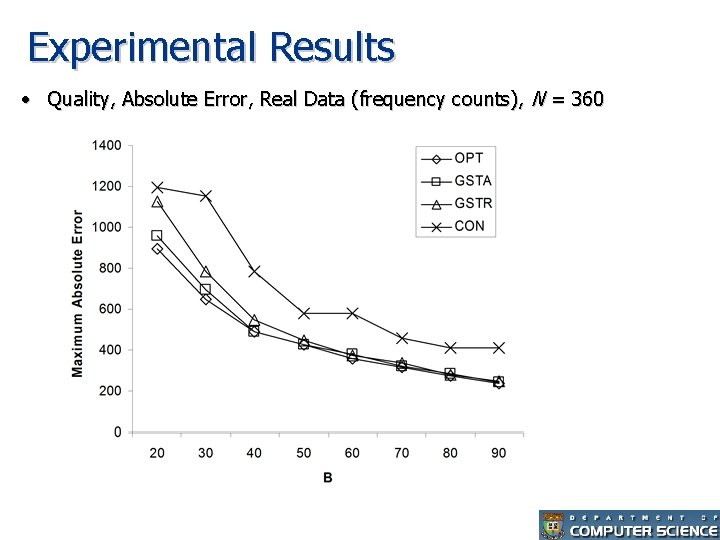
Experimental Results • Quality, Absolute Error, Real Data (frequency counts), N = 360
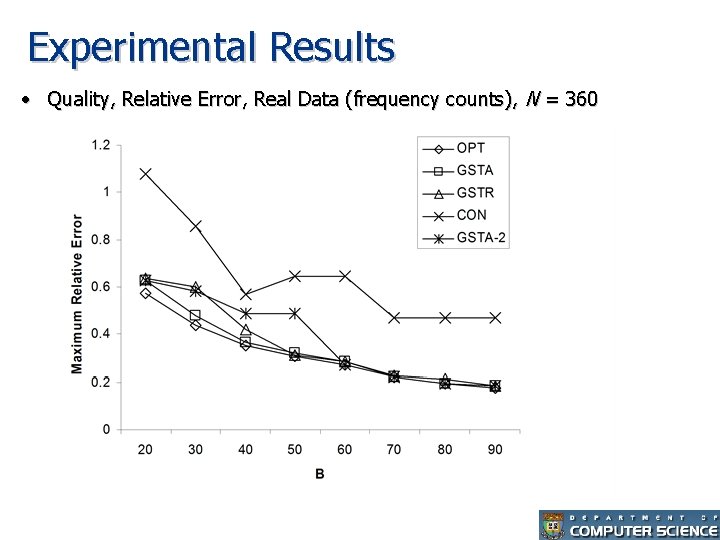
Experimental Results • Quality, Relative Error, Real Data (frequency counts), N = 360
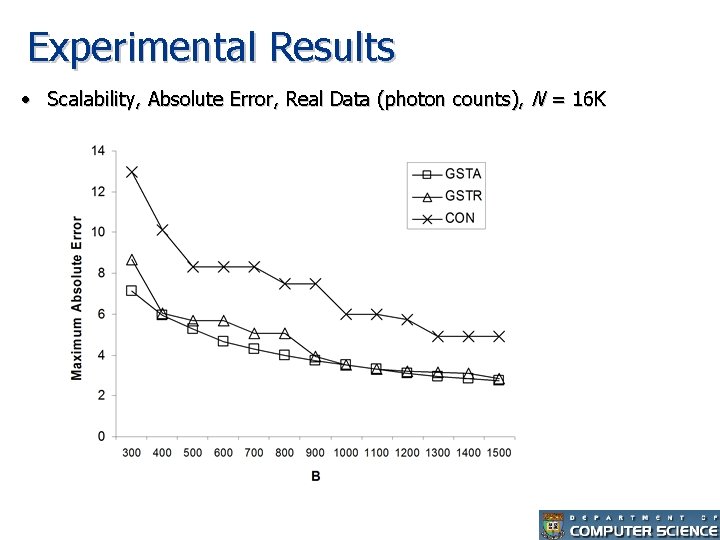
Experimental Results • Scalability, Absolute Error, Real Data (photon counts), N = 16 K
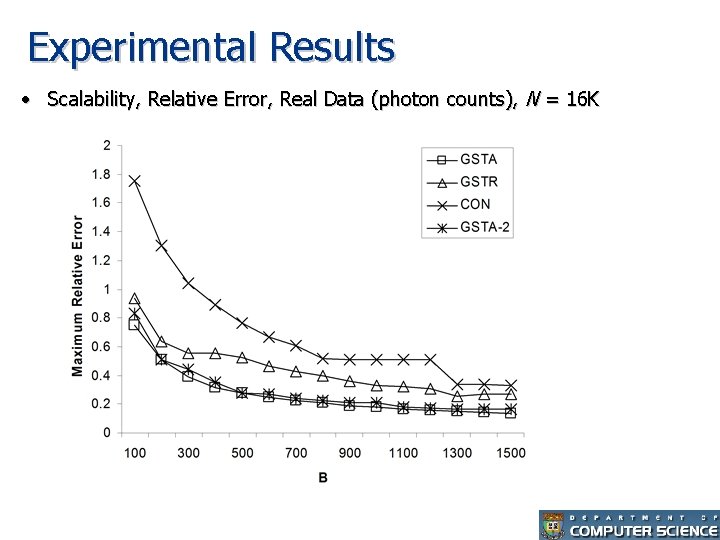
Experimental Results • Scalability, Relative Error, Real Data (photon counts), N = 16 K
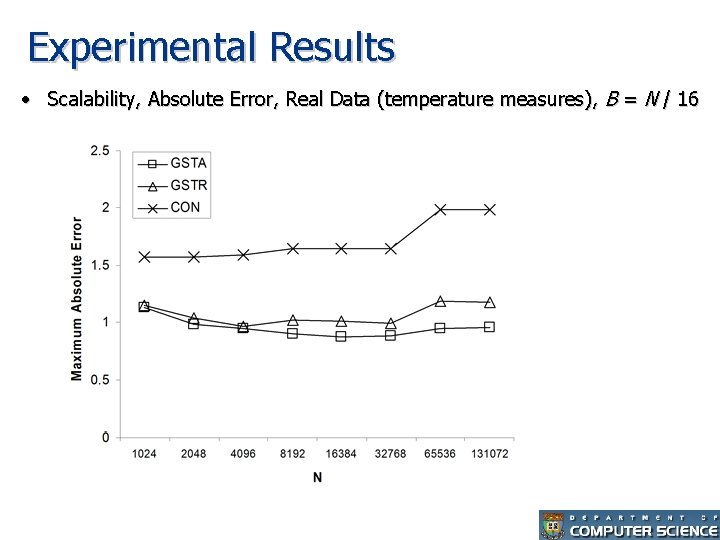
Experimental Results • Scalability, Absolute Error, Real Data (temperature measures), B = N / 16
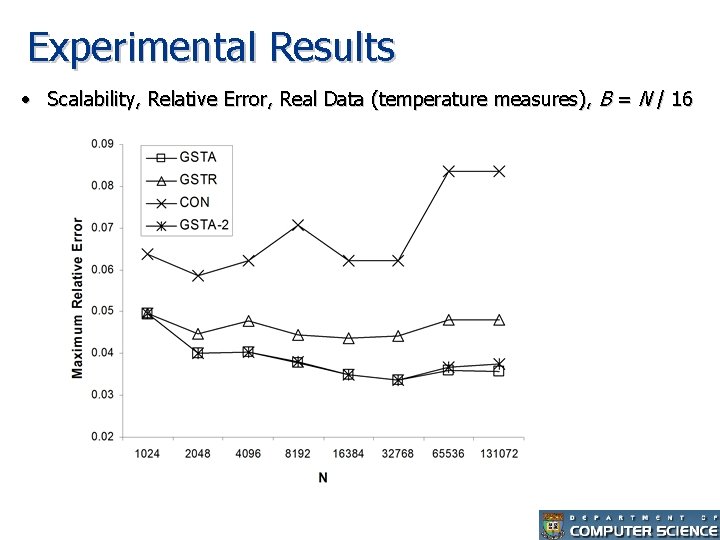
Experimental Results • Scalability, Relative Error, Real Data (temperature measures), B = N / 16
Conclusions & Future Directions • Feasibility of Wavelet Synopses with nearoptimal Error Guarantees at near-linear cost for both Static and Streaming Data • Extension to Multidimensional Wavelets? • Alternative Relative Error Heuristics? • Variable Coefficients? • Theoretical Worst-case Guarantee?
Related Work • Y. Matias, J. S. Vitter, and M. Wang. Wavelet-based histograms for selectivity estimation. SIGMOD 1998 • J. S. Vitter and M. Wang. Approximate computation of multidimensional aggregates of sparse data using wavelets. SIGMOD 1999 • K. Chakrabarti, M. Garofalakis, R. Rastogi, and K. Shim. Approximate query processing using wavelets. VLDB Journal 2001 • A. Gilbert, Y. Kotidis, S. Muthukrishnan and Martin Strauss. Surfing Wavelets on Streams: One-Pass Summaries for Approximate Aggregate Queries. VLDB 2001 • M. Garofalakis and A. Kumar. Deterministic wavelet thresholding for maximum-error metrics. PODS 2004 • S. Guha and B. Harb. Wavelet Synopses for Data Streams: Minimizing Non-Euclidean Error. KDD 2005
Thank you! Questions?