
On the use of Deep Convective Clouds DCC

- Slides: 23
On the use of Deep Convective Clouds (DCC) to calibrate visible sensors D. Doelling NASA La. RC Dan Morstad, Benjamin Scarino, Arun Gopalan GSICS/GWRG Session Beijing, China, March 5 -8, 2012 NASA Langley Research Center / Atmospheric Sciences
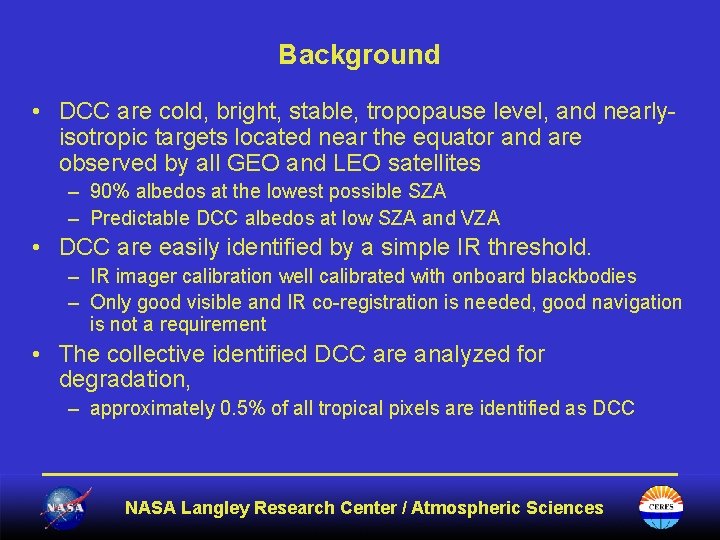
Background • DCC are cold, bright, stable, tropopause level, and nearlyisotropic targets located near the equator and are observed by all GEO and LEO satellites – 90% albedos at the lowest possible SZA – Predictable DCC albedos at low SZA and VZA • DCC are easily identified by a simple IR threshold. – IR imager calibration well calibrated with onboard blackbodies – Only good visible and IR co-registration is needed, good navigation is not a requirement • The collective identified DCC are analyzed for degradation, – approximately 0. 5% of all tropical pixels are identified as DCC NASA Langley Research Center / Atmospheric Sciences
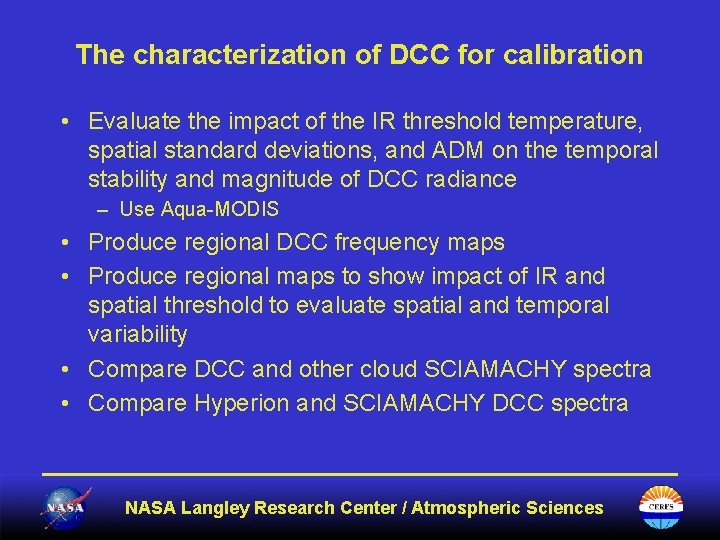
The characterization of DCC for calibration • Evaluate the impact of the IR threshold temperature, spatial standard deviations, and ADM on the temporal stability and magnitude of DCC radiance – Use Aqua-MODIS • Produce regional DCC frequency maps • Produce regional maps to show impact of IR and spatial threshold to evaluate spatial and temporal variability • Compare DCC and other cloud SCIAMACHY spectra • Compare Hyperion and SCIAMACHY DCC spectra NASA Langley Research Center / Atmospheric Sciences
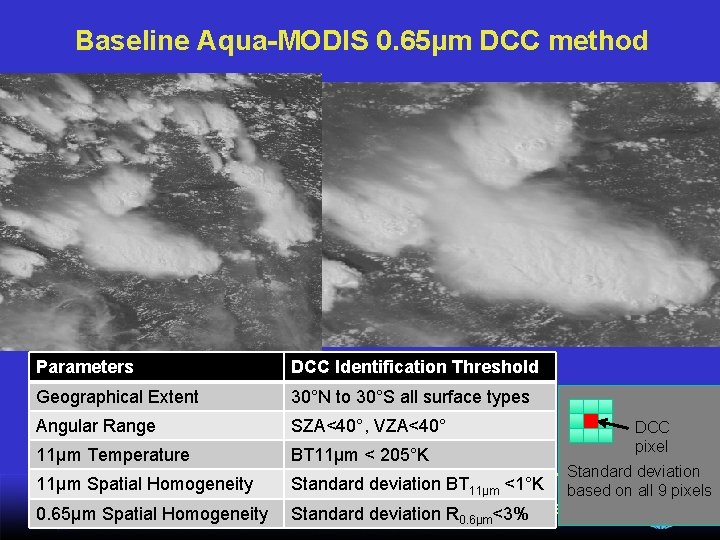
Baseline Aqua-MODIS 0. 65µm DCC method Parameters DCC Identification Threshold Geographical Extent 30°N to 30°S all surface types Angular Range SZA<40°, VZA<40° 11µm Temperature BT 11μm < 205°K DCC pixel Standard deviation 11µm Spatial Homogeneity Standard deviation BT 11μm <1°K based on all 9 pixels NASA Langley Research Center / Atmospheric 0. 65µm Spatial Homogeneity Standard deviation R <3%Sciences 0. 6μm
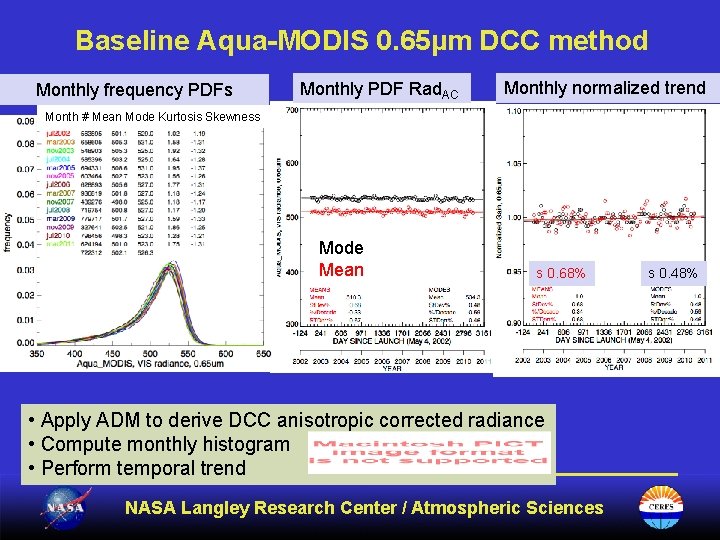
Baseline Aqua-MODIS 0. 65µm DCC method Monthly frequency PDFs Monthly PDF Rad. AC Monthly normalized trend Month # Mean Mode Kurtosis Skewness Mode Mean s 0. 68% • Apply ADM to derive DCC anisotropic corrected radiance • Compute monthly histogram • Perform temporal trend NASA Langley Research Center / Atmospheric Sciences s 0. 48%
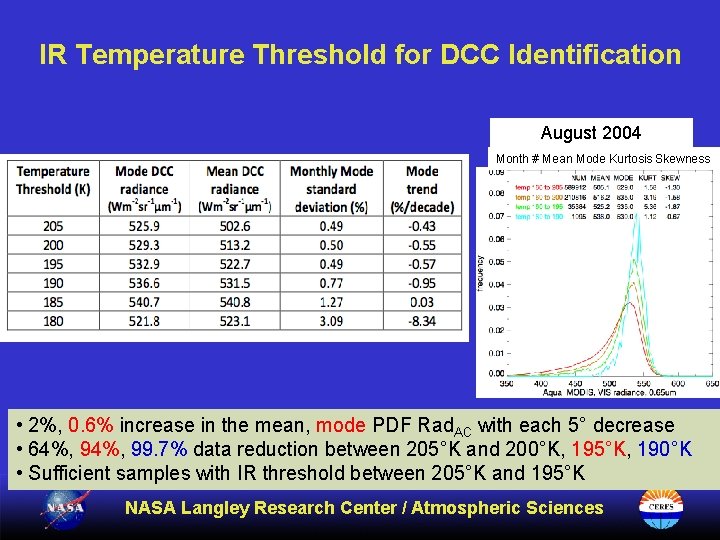
IR Temperature Threshold for DCC Identification August 2004 Month # Mean Mode Kurtosis Skewness • 2%, 0. 6% increase in the mean, mode PDF Rad. AC with each 5° decrease • 64%, 99. 7% data reduction between 205°K and 200°K, 195°K, 190°K • Sufficient samples with IR threshold between 205°K and 195°K NASA Langley Research Center / Atmospheric Sciences
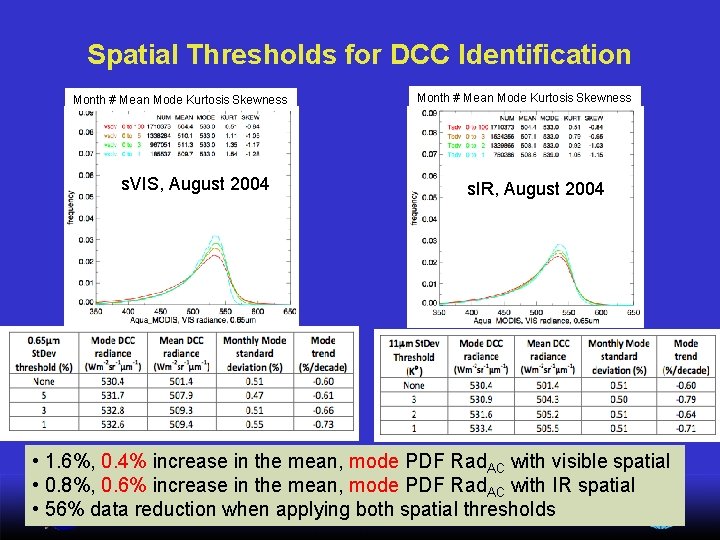
Spatial Thresholds for DCC Identification Month # Mean Mode Kurtosis Skewness s. VIS, August 2004 Month # Mean Mode Kurtosis Skewness s. IR, August 2004 • 1. 6%, 0. 4% increase in the mean, mode PDF Rad. AC with visible spatial • 0. 8%, 0. 6% increase in the mean, mode PDF Rad. AC with IR spatial NASA Langley Research Center / Atmospheric Sciences • 56% data reduction when applying both spatial thresholds
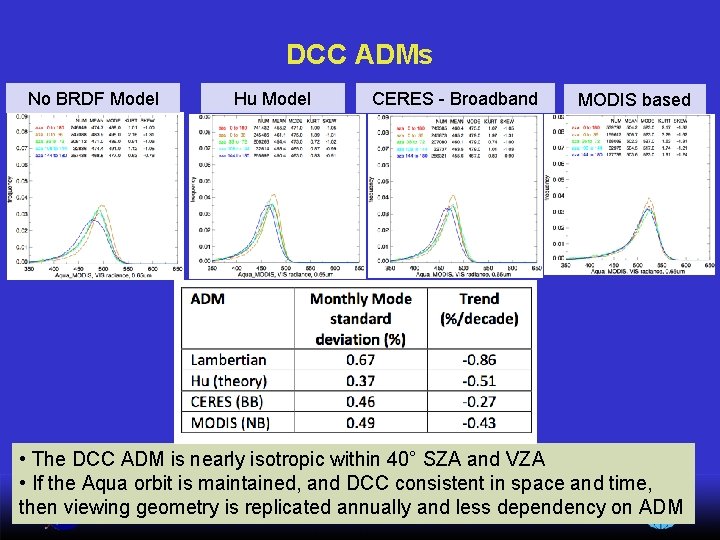
DCC ADMs No BRDF Model Hu Model CERES - Broadband MODIS based • The DCC ADM is nearly isotropic within 40° SZA and VZA • If the Aqua orbit is maintained, and DCC consistent in space and time, then viewing geometry is replicated annually and less dependency on ADM NASA Langley Research Center / Atmospheric Sciences
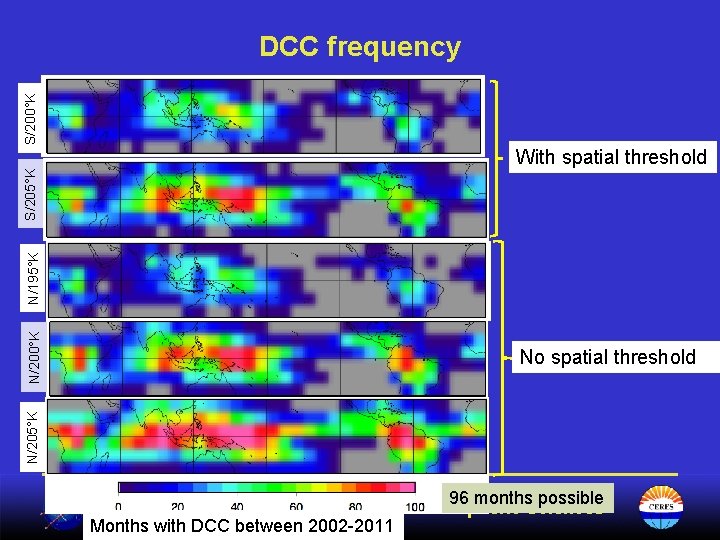
S/200°K DCC frequency No spatial threshold N/205°K N/200°K N/195°K S/205°K With spatial threshold 96 months possible NASA Langley Research Center / Atmospheric Sciences Months with DCC between 2002 -2011
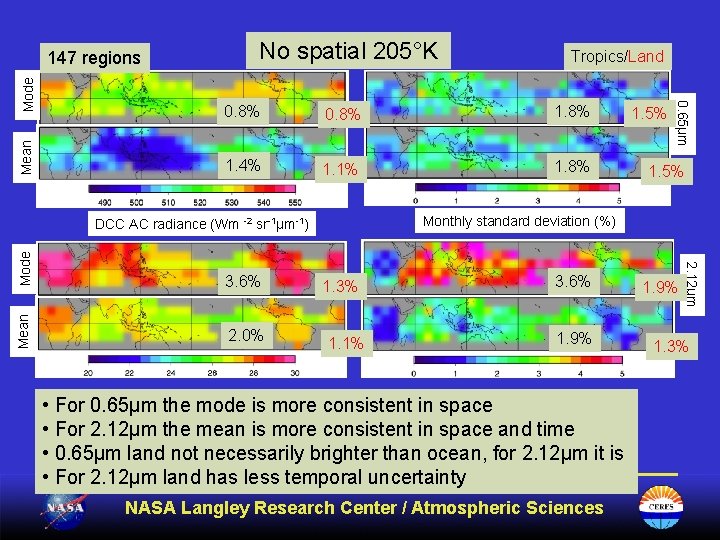
Mean No spatial 205°K 0. 8% 1. 4% 1. 1% 1. 8% 1. 5% E) 3. 6% G) 2. 0% 1. 3% 1. 1% 3. 6% 1. 9% • For 0. 65µm the mode is more consistent in space • For 2. 12µm the mean is more consistent in space and time • 0. 65µm land not necessarily brighter than ocean, for 2. 12µm it is • For 2. 12µm land has less temporal uncertainty NASA Langley Research Center / Atmospheric Sciences 1. 9% 2. 12µm Mode 1. 5% Monthly standard deviation (%) DCC AC radiance (Wm -2 sr-1µm-1) Mean Tropics/Land 0. 65µm Mode 147 regions 1. 3%
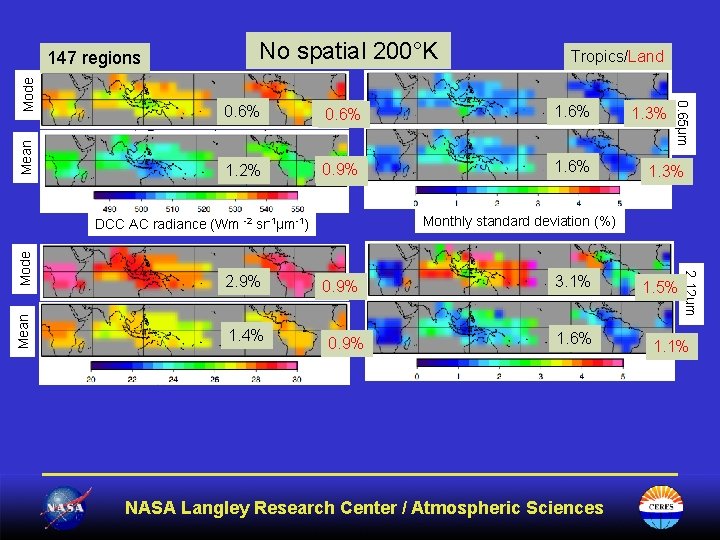
Mean No spatial 200°K Tropics/Land 0. 6% 0. 5% 0. 6% 1. 2% 0. 9% 0. 7% 1. 6% Mode Mean 0. 9% 3. 1% 1. 6% NASA Langley Research Center / Atmospheric Sciences 1. 5% 2. 12µm 1. 4% 1. 3% Monthly standard deviation (%) DCC AC radiance (Wm -2 sr-1µm-1) 2. 9% 1. 3% 0. 65µm Mode 147 regions 1. 1%
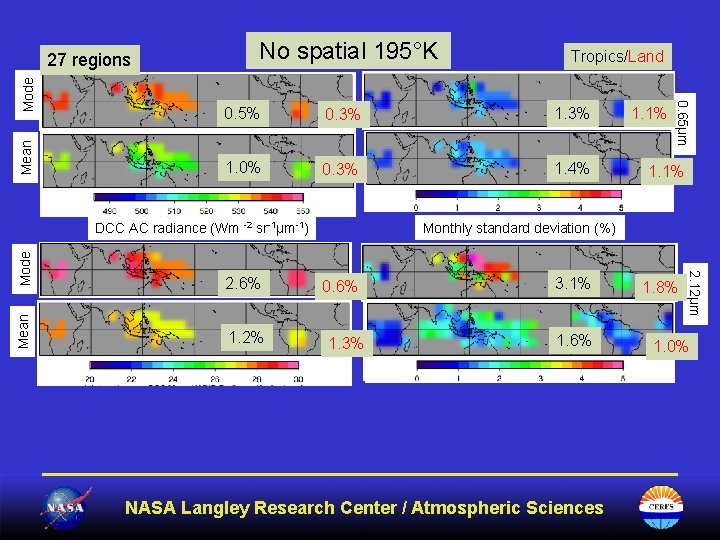
Mean No spatial 195°K Tropics/Land 0. 5% 0. 3% 1. 0% 0. 3% 1. 4% Mode 1. 2% 1. 1% Monthly standard deviation (%) 0. 6% 1. 3% 3. 1% 1. 6% NASA Langley Research Center / Atmospheric Sciences 1. 8% 2. 12µm 2. 6% Mean DCC AC radiance (Wm -2 sr-1µm-1) 1. 1% 0. 65µm Mode 27 regions 1. 0%
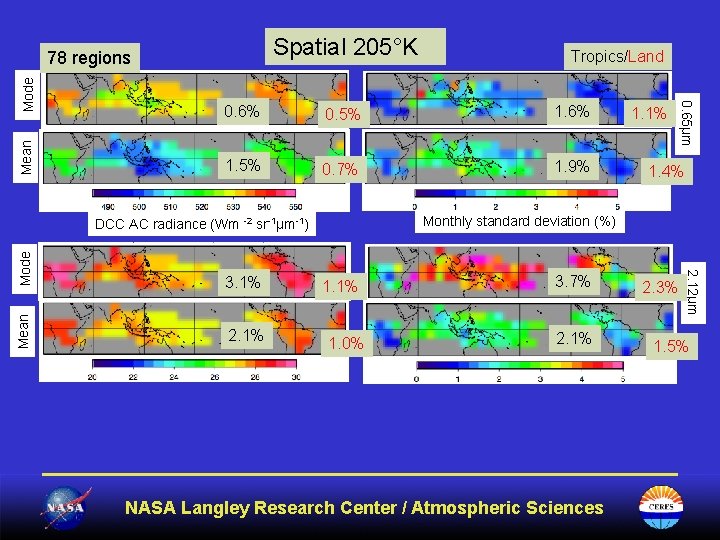
Spatial 205°K Mean Tropics/Land 0. 6% 0. 5% 1. 6% 1. 5% 0. 7% 1. 9% Mode Mean 1. 1% 1. 0% 3. 7% 2. 1% NASA Langley Research Center / Atmospheric Sciences 2. 3% 2. 12µm 2. 1% 1. 4% Monthly standard deviation (%) DCC AC radiance (Wm -2 sr-1µm-1) 3. 1% 1. 1% 0. 65µm Mode 78 regions 1. 5%
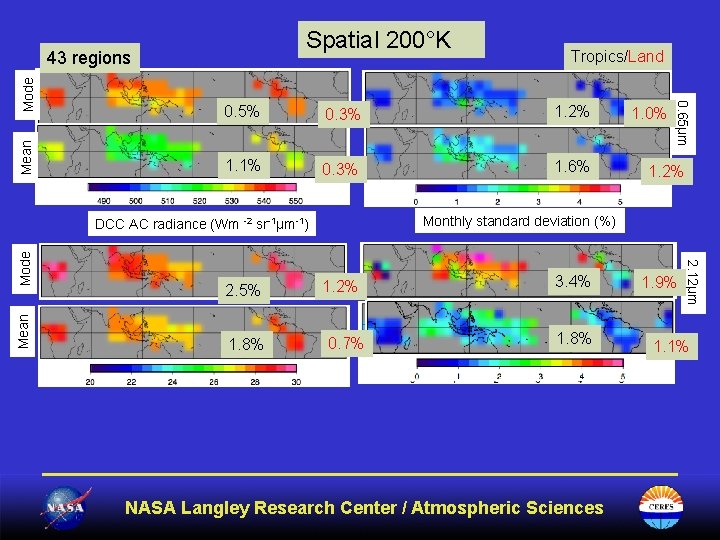
Spatial 200°K Mean 0. 5% 0. 3% 1. 2% 1. 1% 0. 3% 1. 6% 1. 8% Mode 1. 2% 0. 7% 3. 4% 1. 8% NASA Langley Research Center / Atmospheric Sciences 1. 9% 2. 12µm 2. 5% 1. 0% Monthly standard deviation (%) DCC AC radiance (Wm -2 sr-1µm-1) Mean Tropics/Land 0. 65µm Mode 43 regions 1. 1%
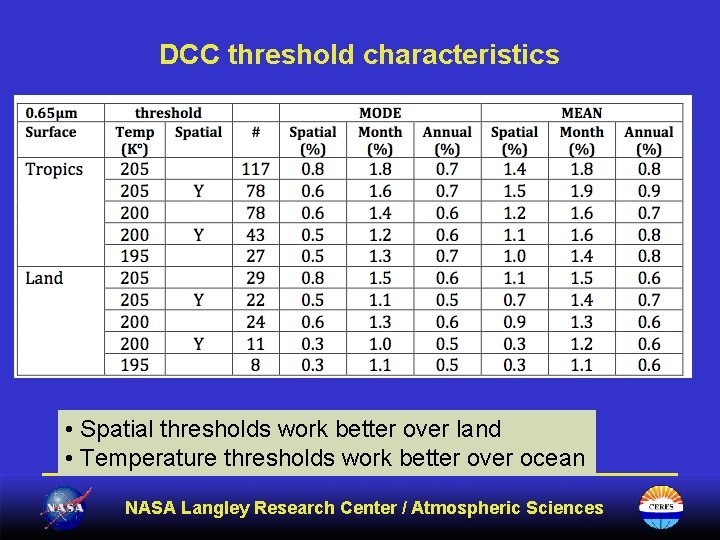
DCC threshold characteristics • Spatial thresholds work better over land • Temperature thresholds work better over ocean NASA Langley Research Center / Atmospheric Sciences
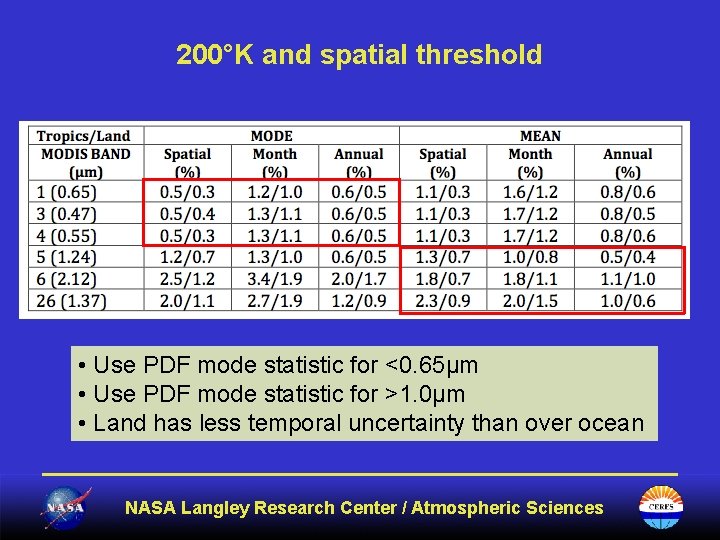
200°K and spatial threshold • Use PDF mode statistic for <0. 65µm • Use PDF mode statistic for >1. 0µm • Land has less temporal uncertainty than over ocean NASA Langley Research Center / Atmospheric Sciences
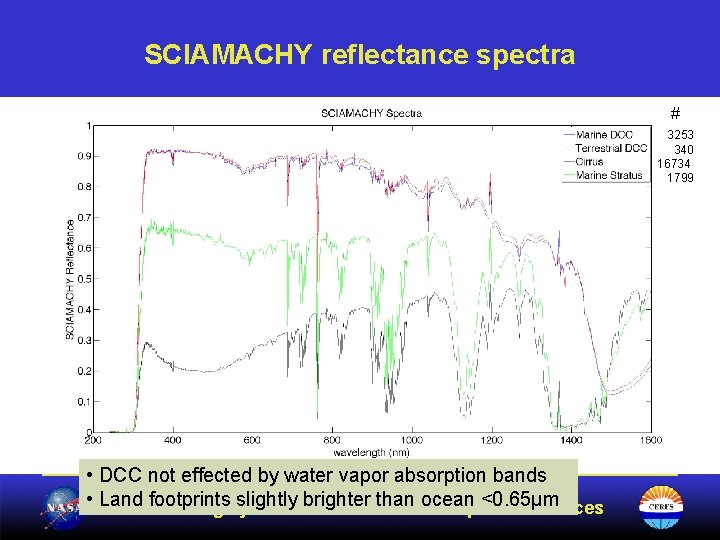
SCIAMACHY reflectance spectra # 3253 340 16734 1799 • DCC not effected by water vapor absorption bands • Land footprints slightly brighter than ocean <0. 65µm NASA Langley Research Center / Atmospheric Sciences
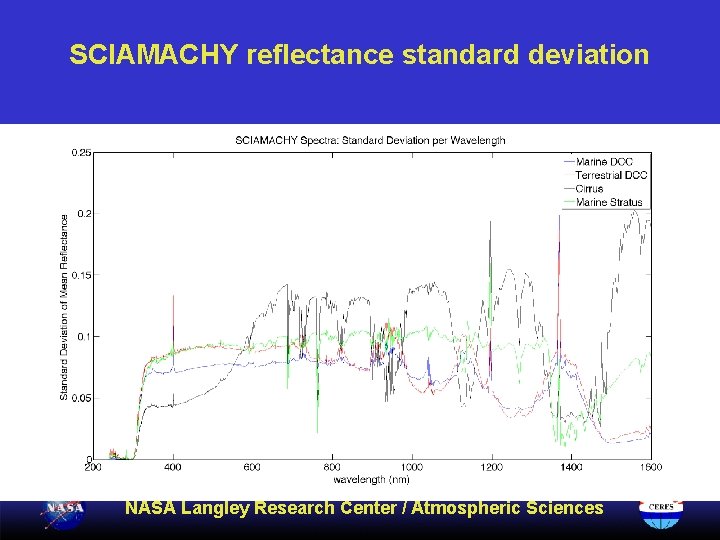
SCIAMACHY reflectance standard deviation NASA Langley Research Center / Atmospheric Sciences
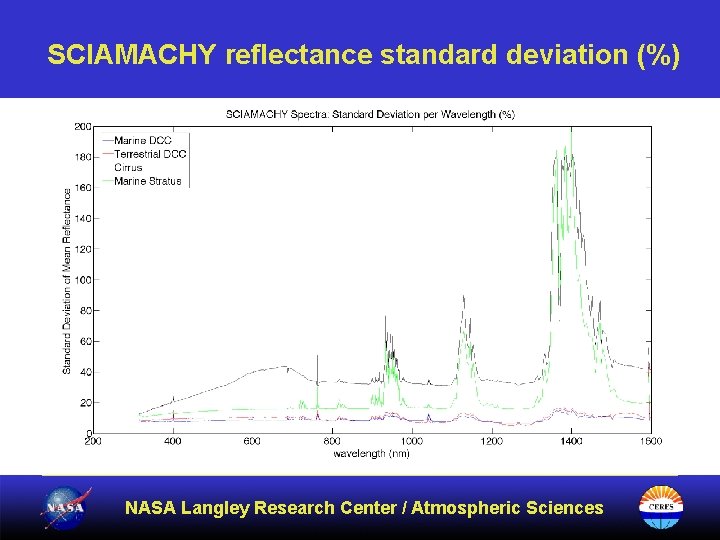
SCIAMACHY reflectance standard deviation (%) NASA Langley Research Center / Atmospheric Sciences
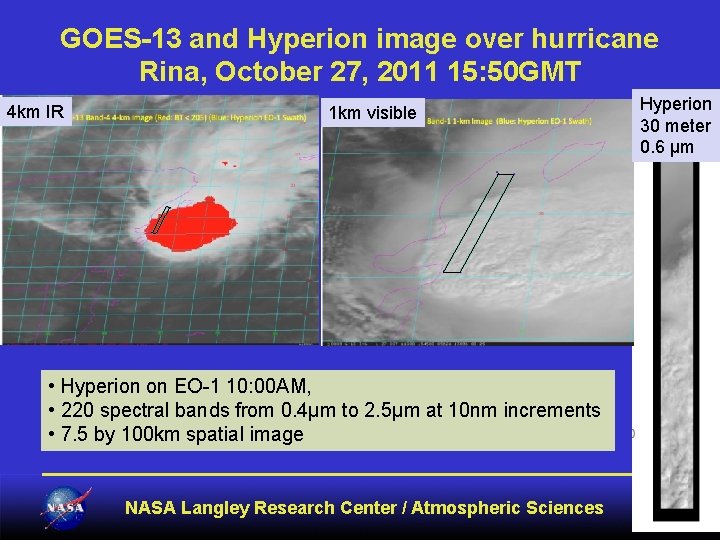
GOES-13 and Hyperion image over hurricane Rina, October 27, 2011 15: 50 GMT 4 km IR 1 km visible • Hyperion on EO-1 10: 00 AM, • 220 spectral bands from 0. 4μm to 2. 5μm at 10 nm increments • 7. 5 by 100 km spatial image NASA Langley Research Center / Atmospheric Sciences Hyperion 30 meter 0. 6 µm
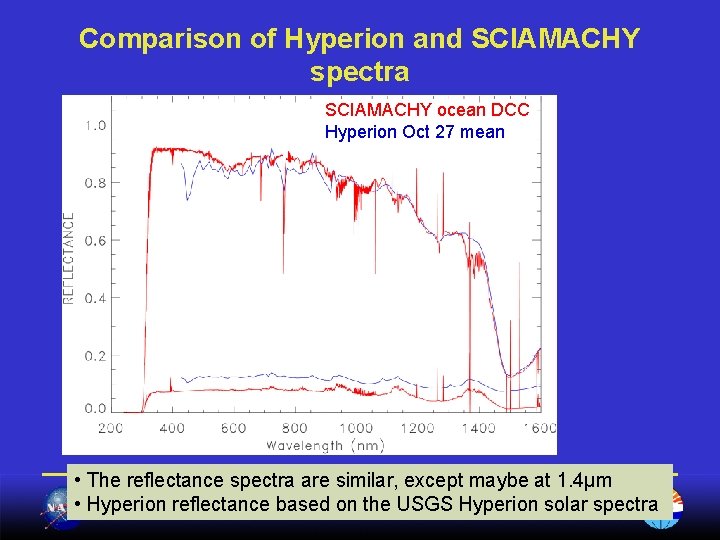
Comparison of Hyperion and SCIAMACHY spectra SCIAMACHY ocean DCC Hyperion Oct 27 mean • The reflectance spectra are similar, except maybe at 1. 4µm • Hyperion reflectance based on the USGS Hyperion solar spectra NASA Langley Research Center / Atmospheric Sciences
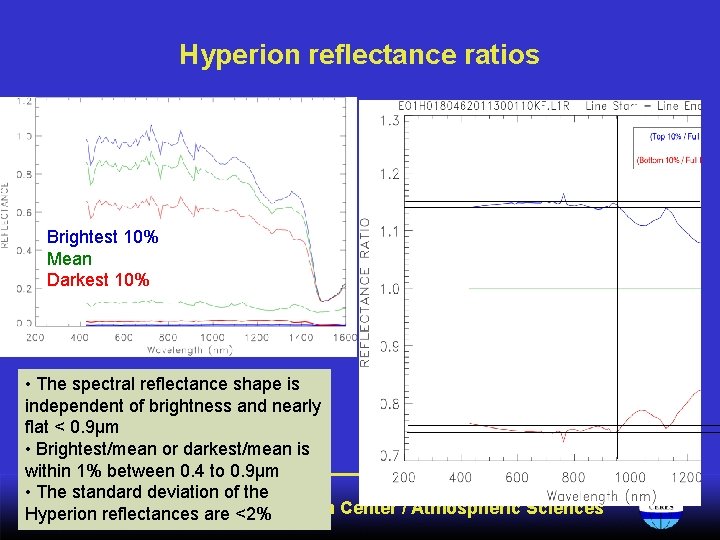
Hyperion reflectance ratios Brightest 10% Mean Darkest 10% • The spectral reflectance shape is independent of brightness and nearly flat < 0. 9µm • Brightest/mean or darkest/mean is within 1% between 0. 4 to 0. 9µm • The standard deviation of the NASA Langley Research Center / Atmospheric Sciences Hyperion reflectances are <2%
Conclusions • DCC calibration is most successful if the monthly PDF shape is consistent from month to month – – – Must balance the most stringent threshold with sample size TWP, Africa and South America have the most DCC PDF mode best for wavelengths < 0. 7µm PDF mean best for wavelengths > 1. 0µm Spatial threshold more effective over land Possible to calibrate all wavelengths < 2. 2µm • DCC over land provides a more predictable radiance and less uncertainty than over ocean • DCC not impacted by water vapor bands between 0. 4 and 1. 6µm as with other cloud types NASA Langley Research Center / Atmospheric Sciences