OMGEVINGSANALYSE LOP LOKEREN BASIS EN SECUNDAIR VERSIE JANUARI

OMGEVINGSANALYSE LOP LOKEREN BASIS – EN SECUNDAIR VERSIE JANUARI 2012 • VDAB basisstatistieken

OMGEVINGSANALYSE LOP LOKEREN Algemeen Demografisch

ALGEMEEN - DEMOGRAFISCH q Bevolking: aangroei Lokeren > Vl Gewest 2000 = 100 2010 Lokeren= 107, 4 – VL = 105, 2 39174 q Migratiesaldo 2000 – 2009= +158 q Geboorten in 2010: 498 – overlijdens: 350 q. Aandeel -25 jarigen 30, 6% (Vl: 27, 6%) q. Aandeel Maghrebijnen/Turken 3, 63% (Vl 0, 87%)

ALGEMEEN - DEMOGRAFISCH Bevolking naar leeftijd 1997 2002 2010 0 -4 jaar 2163 2230 2567 5 -9 jaar 2229 2152 2280 10 -14 jaar 2308 2225 2261 15 -19 jaar 2462 2335 2314 … totaal 36123 36772 39144

ALGEMEEN – DEMOGRAFISCH BEVOLKINGSPIRAMIDE geboortejaar aantal CAP* 2010 487 536 2002 426 543 2009 500 545 2001 477 563 2008 541 576 2000 456 SO 2007 493 538 1999 440 SO 2006 519 567 1998 464 SO 2005 524 571 1997 486 SO 2004 497 586 1996 422 SO 2003 443 521 1995 451 SO * geboortejaar/leerjaar

EVOLUTIE VAN ENKELE LEEFTIJDSGROEPEN -9 -7 +3 +19 +24 +21 75 -79 50 -54 60 -64 35 -39 55 -59 30 -34 +1 +3 -2 -6 25 -29 15 -19 10 -14 5 -9 0 -4 Stijging/daling Evolutie/ in % leeftijdsgroep Evolutie bevolking 1997 – 2010: + 8% +27
 ECM (01. 2010) genaturaliseerd Niet-Belg totaal Marokko 1205 728 1933")
ALGEMEEN - DEMOGRAFISCH (genaturaliseerde) ECM (01. 2010) genaturaliseerd Niet-Belg totaal Marokko 1205 728 1933 Turkije 932 517 1449 Nederland 116 191 307 Polen 12 80 92 Spanje 20 50 70 Tsjechië … Totaal 16 54 70 2531 (6, 5%) 2133 (5, 5%) 4664 (12%)

ALGEMEEN – DEMOGRAFISCH : EVOLUTIE MIGRATIE 2001 2005 2009 +150 +182 +178 Saldo interne migratie -41 +12 +17 Saldo externe migratie +126 +133 +158 Totaal 0/00 +2, 3 +3, 8 +4, 5 • Belg -> andere 1 0 1 • Andere -> Belg 429 107 157 Aangroei Verandering van nationaliteit
 Lokeren: 15. 633 – Vl 16. 323 q")
ALGEMEEN: LEVENSOMSTANDIGHEDEN q Gemiddeld inkomen/inwoner (2008) Lokeren: 15. 633 – Vl 16. 323 q Aangiften < 10. 000 euro (2008): Lokeren 14, 8% - Vl 15, 9% q Geboorten in kansarme gezinnen (2007) Lokeren: als 2000= 100 dan 2008 = 185, 2 Vlaanderen: stijging tot 168, 2 q Leefloon: Lokeren = Vlaanderen = 4, 1%
 Diploma Lager ond % Lokeren % Provincie 34%")
WERKLOOSHEID IN LOKEREN NAAR DIPLOMA (2007) Diploma Lager ond % Lokeren % Provincie 34% 28% Leertijd 3% 2, 6% DBSO 2% 1, 6% 2 e graad SO 24% 21% 3 e en 4 e graad SO 28% 31% HOBU 7% 11% Universitair 3% 5% 1229 =100% Totaal

WERKLOOSHEIDSGRAAD IN LOKEREN DETAILS 2011 AANDELEN NIET WERKENDE WERKZOEKENDEN Werkloosheidsgraad: . . % - Vlaanderen: 6, 55% - 25 jaar: 14, 38% - 25 -50 jaar: 5, 68% - +50 jaar: 7% Aandeel -25 jaar in de werkloosheid: 21, 3% (Vl 20, 3%) Aandeel ngl studieniveau Laaggeschoold (max 2 e gr SO) Middengeschoold (max SO) Hooggeschoold (HO/Univ) Lokeren Vlaanderen 56, 6% 49, 8% 32, 6% 34, 3% 10, 8% 16, 0% Nationaliteit (alle categorieën) Niet EU Allochtonen 11, 0% 38, 4% 10, 3% 24, 9%

WERKLOOSHEIDSGRAAD IN LOKEREN DETAILS 2011 JONGE WERKZOEKENDEN -25 JAAR Aantal: 269 - Waarvan: Laaggeschoold 52, 4% Middengeschoold 35, 6% Hooggeschoold 12, 3% <1 jaar werkloos 1 -2 jaar werkloos +2 jaar werkloos 71, 4% 14, 9% 13, 8% Niet-Eu origine 4, 5% Autochtonen Allochtonen 61% 39%

ALGEMEEN – DEMOGRAFISCH / SES Asielzoekers in 2010 Totaal: 93 waarvan 24 kinderen Geboorten in Kansarme gezinnen Aantal geboorten 1999 2005 2007 416 500 Waarvan in kansarme gezinnen 5, 8% 4, 0% verhouding voor Vlaanderen 4, 5% 5, 6% Recht op voorkeursregeling ziekteverzekering Lokeren: 14% - Vlaanderen: 13, 1% 8, 0% 6, 7%

OMGEVINGSANALYSE LOP LOKEREN Schoolbevolking • Aantallen • Stromen • Evolutie

SCHOOLBEVOLKING BAO EN SO Aantal leerlingen in Lokeren op school 01. 02. 2011 Kleuters in BO 2002 1485 42 2011 1780 54 Gewoon Lager 2422 2434 Bu. O 1 e graad SO 387 1061 419 1075 2 e + 3 e graad SO* 2007 1865° ° verlies vooral in ASO (-35) en TSO (-183) BUSO 246 (2003) 332 * modulair onderwijs en 7 e jaren niet meegerekend

EVOLUTIE LEERLINGENAANTALLEN BAO jaar kleuter lager Totaal BKO BLO 2002 2003 2004 2005 2006 2007 1485 1477 1514 1486 1513 1517 2422 2400 2423 2452 2436 2442 3907 3877 3938 3949 3959 42 42 40 39 43 41 387 391 379 377 387 2008 2009 2010 2011 1557 1658 1725 1780 2460 2443 2429 2436 4017 4101 4154 4216 46 48 55 54 392 407 419

KLEUTERPARTICIPATIE 2010 -11 Leeftijd ingeschreven niet ingeschreven 2 jaar 98 99% 1 1% 3 jaar 488 99, 4% 3 0, 6% 4 jaar 518 99, 6% 2 0, 4% 5 jaar 519 99, 6% 2 0, 4%

AN IN HET BAO IN LOKEREN OFFICIËLE GEGEVENS DEPT OND BEHALVE 2011 SCHOOLJAAR AANTAL AN 1998 -99 9 SCHOLEN MET AN 2 (vrij ond) 2000 -01 19 2(id) 2003 -04 8 1 (id) 2005 -06 4 1 (id) 2006 - 07 6 2 (vrij + GO) 2011 -12 (dec) 23* 3 (1 vrij 2 GO) * zonder Kleuters ((8)

SAMENVATTENDE TABEL 2010 -2011 LEERLINGENSTROMEN BAO LOKEREN Niveau Instroom Uitstroom Blijvers ratio Gewoon kleuter 4, 89% 11, 13% 93, 44% BO kleuter 77, 78% 36, 84% 4, 85% 12, 70% BO lager 70, 64% 30, 11% globaal 11, 59% 12, 81% Gewoon lager 91, 75%

LEERLINGENSTROMEN BAO Totaal BLO BKO Lager Kleuter 2010 – 11 WAAR GAAN LEERLINGEN DIE IN LOKEREN WONEN NAAR SCHOOL? Totaal lln in Lokeren wonend 1905 2653 19 176 4753 Naar school in Lokeren 1693 2316 12 123 4144 7 53 609 Naar school buiten Lokeren 212 337 • Lochristi 81 109 • Zele 42 62 • SNS 32 51 • Waasmunster 17 41 6 19 3 12 40 34 55 3 12 104 • Gent • … andere gemeenten 190 1 19 123 10 94 58

LEERLINGENSTROMEN BAO totaal BULO BKO Kl Lager 2010 – 11 WAAR WONEN LEERLINGEN DIE IN LOKEREN NAAR SCHOOL GAAN? Totaal lln in Lokeren op school 1780 2434 54 419 4687 In Lokeren wonend en naar school 1693 2316 12 123 4144 Komend van buiten Lokeren: 87 118 • Lochristi 15 31 1 19 66 6 10 4 19 39 • Sint Niklaaas 10 13 7 54 84 • Waasmunster 14 14 4 17 49 • Moerbeke 15 17 15 47 • … (andere) 27 33 26 172 248 • Zele 42 296 543

LEERLINGENSTROMEN BAO 2010 – 11 GEWOON BAO - CONCLUSIE Kleuter Lokeren trekt leerlingen aan Lokeren ziet leerlingen vertrekken Saldo Lager Totaal 87 118 205 212 337 609 - 125 - 219 - 344

Leerlingenstromen Lokeren SO 2010 -11 Schoolbevolking Lokeren SO 3420 Voltijds Deeltijds BUSO 3088 0 332

Leerlingenstromen Lokeren SO 2010 -11 Lln wonend in Lokeren en schoollopend in SO 3011 Voltijds 2804 Deeltijds 29 BUSO 178

Leerlingenstromen Lokeren SO 2010 -11 In Lokeren wonend en in Lokeren in SO 2073 In Voltijds Deeltijds In BUSO 1965 0 108

EVOLUTIE LEERLINGENAANTALLEN SO 1 E GRAAD jaar jongens meisjes totaal 2002 568 493 1061 2003 557 490 1047 2004 601 480 1081 2005 592 481 1073 2006 591 505 1096 2007 555 501 1056 2008 574 506 1080 2009 596 477 1073 2010 618 456 1074 2011 585 490 1075

EVOLUTIE LLN- AANTALLEN SO 2 E + 3 E GRAAD jaar 2002 2003 2004 ASO 923 925 898 TSO* 703 652 657 BSO*/** 381 401 425 2006 2007 2008 2009 2010 2011 929 918 874 924 915 911 958 619 608 632 585 598 560 520 413 398 386 377 392 370 387 * Zonder 7 e lj **BSO ook zonder modulair onderwijs

EVOLUTIE LLN- AANTALLEN BUSO jaar aantal 2003 246 2004 265 2005 281 2006 304 2007 316 2008 313 2009 323 2010 334 2011 332

LEERLINGENSTROMEN SO 2009 – 10 WAAR WONEN LEERLINGEN DIE IN LOKEREN NAAR SCHOOL GAAN? Voltijds Deeltijds BUSO Totaal lln in SO in Lokeren 3088 332 3420 Waarvan in Lokeren op school 1965 108 2073 • Zele 206 27 233 • Lochristi 189 7 196 • Sint Niklaas 139 42 181 • Waasmunster 140 8 148 • Moerbeke 162 8 170 • Berlare 77 10 87 • Wachtebeke 45 6 51 • … (rest <45 lln/gmeente) … … … 1123 224 1347 Andere lln in SO komen van: Totaal komend van buiten Lokeren

LEERLINGENSTROMEN SO 2009 – 10 WAAR GAAN LEERLINGEN DIE IN LOKEREN WONEN NAAR SCHOOL? Voltijds lln in Lokeren wonend in SO 2804 Waarvan in Lokeren in SO 1965 Deeltijds BUSO 29 Totaal 178 3011 108 2073 De rest gaat naar: • Sint Niklaas 245 16 39 300 • Gent 218 5 15 238 • Lochristi 165 • Dendermonde 32 • Wetteren 38 • Zele 26 • … andere gemeenten (<20) Totaal lln in SO die buiten Lokeren naar school gaan 839 165 6 38 2 40 26 … … … 29 70 938

SCHOOLPLAATS DBSO LEERLINGEN DIE IN LOKEREN WONEN 01. 02. 2011 Totaal: 29 Schoolplaats Dendermonde 6 in Gent 5 Antwerpen 2 Sint Niklaas 16

LEERLINGENSTROMEN 1 R GRAAD SO 2009 – 10 Woonplaats lln in Lokeren op school 1 e graad gewoon SO Lln in Lokeren wonend 693 Wonend buiten Lokeren 381 Totaal 1074 Schoolplaats lln wonend in Lokeren, en in de 1 e graad gewoon SO In Lokeren op school 693 Buiten Lokeren op school Vnl in SNS (54), Gent (46) en Lochristi (54) 203 Leerlingen van buiten Lokeren in de 1 e graad SO instromen gaan er achteraf niet meer weg dan de leerlingen uit Lokeren zelf (+/- 10% zoekt het elders in de 2 e graad – dat zijn in absolute cijfers +/- 60 Lokerse leerlingen

LEERLINGENSTROMEN IN SO 2009 -10 Aantal SO-leerlingen die in Lokeren wonen: 2944 Waarvan in Lokeren op school: 2081 = 70, 7% OV + Graad Aantal lln in Lokeren op school % 1 e graad 896 693 77, 3% 2 e graad ASO 356 310 87, 1% 3 e graad ASO 299 259 86, 6% 2 e graad TSO 283 173 61, 1% 3 e graad TSO 332 186 56, 0% 2 e graad BSO 222 150 67, 6% 3 e graad BSO 292 173 59, 2%

OMGEVINGSANALYSE LOP LOKEREN Schoolbevolking • Doorstroming • Indicatoren

DOORSTROMING BAO – SO 2009 -10 -> 2010 -11 ->B-str ->A-str school ->B str school ->A str Enkel overgangen naar A- of B-stroom weergegeven! Bloemenhof 35 12 Heirbrug 32 2 Springplank 24 5 College 43 14 Dol-fijn 14 4 Doorslaar 32 1 Boskesschool 49 35 2 Heiende 19 1 GBS Spoele 22 5 Oudenbos 19 2 GBS Staakte 22 GBS Eksaarde Bengel 6 4 Hagewinde 1 9 Klim-op 1 16 Windekind 1

DOORSTROMING NAAR HERKOMST LJ BAO Enkel 2009 -2010 naar 2010 -2011 weergegeven! Herkomst Naar BUSO 1 B 4 e lj 5 e lj 6 e lj totaal 1 1 Naar 1 A 349 Naar 1 B 5 17 30 52 totaal 5 17 380 402
 GOK-INDICATOREN GEWOON BAO 2010 -11 School/vestiging LAGER % % Bloemenhof Madelief 94% Oudenbos")
(NIEUWE) GOK-INDICATOREN GEWOON BAO 2010 -11 School/vestiging LAGER % % Bloemenhof Madelief 94% Oudenbos 22% Bloemenhof Zonnebloem 89% Bengel Zelebaan 77% Bloemenhof Rozen 49% Bengel M 61% De Springplank 71% Veertjesplein 42% Dolf-fijn Eksaarde dorp 25% OLV College 76% Dol-fijn Eksaarde Briel 11% Doorslaar 25% Boskesschool Slagveldstraat 30% SBS Eksaarde 18% Boskesschool O. Heerweg 26% SBS Spoele 33% Heiende 20% SBS Staakte 19%
 GOK-INDICATOREN GEWOON KLEUTEROND. 2010 -11 School/vestiging Kleuter % % Bloemenhof Madelief 91% Oudenbos")
(NIEUWE) GOK-INDICATOREN GEWOON KLEUTEROND. 2010 -11 School/vestiging Kleuter % % Bloemenhof Madelief 91% Oudenbos 15% Bloemenhof Zonnebloem 74% Bengel Zelebaan 78% Bloemenhof Rozen 37% Bengel M 66% De Springplank 72% Veertjesplein 42% Dolf-fijn Eksaarde dorp 18% Doorslaar 18% Dol-fijn Eksaarde Briel 11% SBS Eksaarde 18% Boskesschool 30% SBS Spoele 30% Duizendvoet 79% SBS Staakte 14% Heiende 13%
 GOK-INDICATOREN GEWOON BAO 2010 -11 CIJFERS 01/02/2010 _ NOG NIET ALLE KLEUTERS VAN")
(NIEUWE) GOK-INDICATOREN GEWOON BAO 2010 -11 CIJFERS 01/02/2010 _ NOG NIET ALLE KLEUTERS VAN 2008 INGESTAPT Kleuteronderwijs per geboortejaar Lager onderwijs per leerjaar lln % L 1 470 47% 44% L 2 409 45% 492 40% L 3 390 51% 2007 415 36% L 4 428 42% 2008 314 35% L 5 384 43% tot 1780 40% L 6 353 43% tot 2434 45% lln % 2004 41 80% 2005 478 2006

INDICATOREN BAO - SPREIDING
 1985 47% 427 24% 778 19% 281 16% geen")
CONCENTRATIEGRAAD BAO 2010 -11 (ANDERS) 1985 47% 427 24% 778 19% 281 16% geen scholen in deze range 1451 34% 1082 60% 4214 1790 44% % TNN lln <30% 30 -50% 50 -70% +70% totaal Indicator lln Niet-indicator lln % % indicator lln in de school % 63 11% 49 9% 455 80% 567 13%
 GOK-INDICATOREN GEWOON SO 2010 -11 graad % indicator lln 1 39, 4% 2")
(NIEUWE) GOK-INDICATOREN GEWOON SO 2010 -11 graad % indicator lln 1 39, 4% 2 44, 7% 3 46, 1% AN 0
 GOK-INDICATOREN Adm groep 1 E GRAAD SO 2010 -11 % Adm groep %")
(NIEUWE) GOK-INDICATOREN Adm groep 1 E GRAAD SO 2010 -11 % Adm groep % 1 A 33, 3% 2/1 Hotel-Voeding 50% 2 A Grieks - Latijn 11, 8% 2/1 Bouw- en houttechnieken 38, 5% 2 A Latijn 22, 5% 2/1 Mod talen-wetenschappen 26, 5% 1 B 89, 1% 2/1 Handel 70, 8% BVL Decoratie-Metaal 73, 1% 2/1 IW 30, 8% BVL Hotel-bakkerij-slagerij 87, 5% 2/1 Mechanica- Electriciteit 46, 8% BVL Hout-Metaal 100% 2/1 STV 42, 9% BVL Kant. -verk - Voeding-verz 94, 1%

GOK-INDICATOREN SO PER GRAAD OV AN 1 e graad GSO ASO 2 ASO 3 BSO 2 BSO 3 TSO 2 TSO 3 2009 -10 Aantal lln 57 1075 514 GOK 70, 2% 38% 20% Indicator 91% 38% 21% 444 215 237 264 282 23% 85% 76% 54% 50%

GOK INDICATOREN GSO PER SCHOOL 2010 -11 School St Thereisia St Lodewijk OLV 2 VTI Atheneum Azalealaan Atheneum Groendreef Aantal lln GOK % 258 334 117 17% 20% 84% 199 114 53 50% 60% 91%

GOK ASO PER GRAAD EN SCHOOL Aantal lln 2010 -11 school graad GOK % St Theresia St Lodewijk Atheneum 2 154 287 73 12% 21% 51% St Lodewijk Atheneum 3 371 73 20% 49%

GOK TSO PER GRAAD EN SCHOOL 2009 -10 School Graad VTI 2 KTA OLV Presentatie 1 OLV Presentatie 2 VTI 3 KTA OLV Presentatie 1 OLV Presentatie 2 Aantal lln Indicator lln 150 37 51 41% 78% 73% 26 65% 144 46 62 30 38% 78% 52% 67%

INDICATOREN BSO PER GRAAD EN SCHOOL 2009 -10 school graad VTI 2 KTA OLV Presentatie 1 Aantal lln Indicatorlln % 78 77% 61 98% 24 96% OLV Presentatie 2 49 78% VTI 3 KTA OLV Presentatie 1 OLV Presentatie 2 63 96 27 33 68% 90% 96% 48%

INDICATOREN BUSO PER SCHOOL 2009 -10 School Hagewinde Broedersschool Molenstraat Broedersschool Daknam Aantal lln Indicator lln % 189 84% 97 51% 46 41%

OMGEVINGSANALYSE LOP LOKEREN Schoolse vertraging* * leerlingen niet in de groep waar ze qua leeftijd kunnen verwacht worden – zegt niet noodzakelijk iets over (aantal keren) overzitten

SCHOOLSE ACHTERSTAND BAO Algemeen: leerlingen met schoolse achterstand in Lokeren in Ba. O 2002: Lokeren: 22, 5% - Vlaanderen: 14, 6% 2011: Lokeren: 21, 5% - Vlaanderen: 15, 5% L 1: 17, 4% - Vl 12, 1% Ter vergelijking: enkele centrumsteden voor 2011: Sint Niklaas 19, 8%; Mechelen 24, 7%; Kortrijk 17, 7%; Roeselare 15, 8%; Turnhout 14, 9%; Aalst 19, 2%
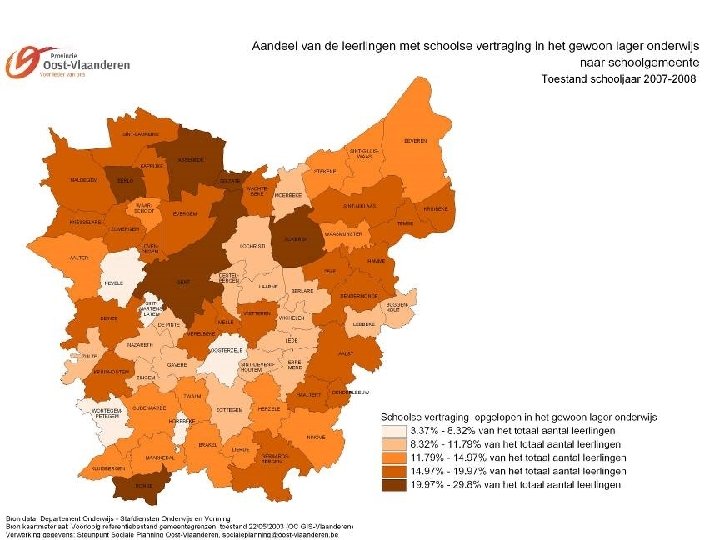

SCHOOLSE ACHTERSTAND SO Algemeen: leerlingen met schoolse achterstand in Lokeren in SO 2002: Lokeren: 26% - Vlaanderen: 28, 7% 2011: Lokeren: 26% - Vlaanderen: 29% Ter vergelijking: verstedelijkte gemeenten: in 2010 29, 6% “schoolvertraagden”

SCHOOLSE ACHTERSTAND SO 2002 % aantal 1 e graad 2011 % aantal Vl. 2011 242 22, 8% 214 19, 9% 21, 7% 2 e en 3 e gr ASO 58 6, 3% 97 10, 1% 12, 2% 2 e en 3 e gr TSO 255 36, 3% 187 36% 38, 1% 2 e en 3 e gr BSO 243 63, 8% 237 61, 2% 60, 6%

SCHOOLSE ACHTERSTAND SO 2010 -11 voor Op leeftijd >1 jaar 1 A 1 10 1 B 2 A 4 BVL achter totaal 1 jaar 2 jaar >2 jaar 420 68 5 1 505 23 29 3 367 50 12 1 434 36 38 4 3 81 55 2 e gr ASO 10 457 38 9 514 3 e gr ASO 4 390 40 9 1 444 2 e gr TSO 175 66 15 8 264 3 e gr TSO 158 74 19 5 256 2 e gr BSO 89 89 30 7 215 3 e gr BSO 61 78 27 6 172

einde
- Slides: 59