OMD CE Paul Hinchey MD MBA FACEP Jose

OMD - CE Paul Hinchey MD, MBA, FACEP Jose Cabanas MD, MPH, FACEP

The Plan � Update on important new EMS literature Therapeutic hypothermia EMS 12 -lead ECG � Discuss medication related events � Understand the extent of medication errors and their impact on patient care � Discuss common strategies to prevent medical errors � Update on clinical performance improvement activities

Science Update

�What is optimal target temperature for PCAC Therapeutic Hypothermia? �Total 939 patients in randomized controlled trial � 36 International ICUs across Europe �Study endpoint: mortality/neuro outcome � 80% VF/VT; 20% Non VF/VT NEJM (2013)

� 32 -33 vs. 35 -36 TH �Unwitnessed asystole cases not included � 24% intravascular; 76% surface cooling � 28 hours of total cooling NEJM (2013)

Study Outcomes 60 55 54 52 53 52 50 45 40 35 Survival 30 Poor Neuro 25 20 15 10 36 33 NEJM (2013)

Study Outcomes

Conclusion �In unconscious survivors of OHCA of presumed cardiac cause, TH at a targeted temperature of 33°C did not confer a benefit as compared with a targeted temperature of 36°C. �Preventing Hyperthermia appears crucial. �No changes in our current process for PCAC

�Does Prehospital TH have benefits? �Randomized clinical trial 1, 359 patients �Seattle King County Medic 1 � 583 with VF; 776 non-VF �Almost all patients cooled on ED arrival JAMA (2013)

�EMS cooling: up to 2 L of 4 C° LR �Mean core temp decrease by 1. 20 C° to ED �EMS patients took 1 hr less to get to 34°C �Study endpoints: mortality and neuro status �EMS pts: 7 -10 mg pavulon + 1 -2 mg valium JAMA (2013)

Survival 70 64 63 60 50 VF 40 Non‐VF 30 20 10 16 No EMS TH 19 EMS TH

Neurological Status �No difference in Neuro Outomes
 • Remember")
Important Results • EMS TH higher cases of pulmonary edema. (p<. 001) • Remember Control group did NOT receive paralytics.

Conclusion �Prehospital TH reduced core temperature and reduced the time to reach a temperature of 34°C. �No improvement in survival or neurological status. �This is one study, no change in our system at this time.

�How often are STEMI patients initial ECG non-diagnostic? �Do repeat ECGs have real value in routine evaluation of CP patients? � 41, 560 STEMI patients in ACTION Registry (2007 -2010)
 , 72. 4% (N= 3,")
Results �For patients with an initial non-diagnostic ECG (11%) , 72. 4% (N= 3, 305) had an ECG diagnostic for STEMI within 90 minutes. �No significant differences in the administration of guidelines-recommended treatments for STEMI.

Wait…. . There’s more!

�Do repeat 12‐lead ECGs make a difference? �Do repeat prehospital ECGs make any difference in STEMI diagnosis? �Canadian Study Prehosp Emerg Care 2012; 16: 109 -114

�Retrospective Analysis of 325 consecutive prehospital STEMI’s �EKG on‐scene, repeat en‐route and pre ED entry 275 STEMI’s in First EKG (84. 6%) 30 STEMI’s in second EKG (93. 8%) 20 STEMI’s in third EKG (100%) Prehosp Emerg Care 2012; 16: 109 -114

Take Home � 1/10 STEMI cases not apparent in first 12 - lead ECG. �ACS cases evolve – repeat 12 -leads! �Prehospital ECG’s save approx. 20 -30 minutes in reperfusion time.

Patient Safety
 report: � 3 -4% of hospital")
Medical Errors � 1999 Institute of Medicine (IOM) report: � 3 -4% of hospital patients are harmed by the health care system � 7% of hospital patients are exposed to a serious medication error � 50, 000 – 100, 000 deaths/ yr from medical mistakes

Patient Safety Event Serious Safety Event that reaches the patient & results in (death, life-threatening consequences, or serious physical or psychological injury Precursor Safety Event that reaches the patient & results in minimal to no harm Near Miss “Good Catch” An event that almost happened, but error caught by a detection barrier © 2010 Healthcare Performance Improvement, LLC. ALL RIGHTS RESERVED. Courtesy Dr. Edmond – SETON HRO Serious Safety Event Precursor Safety Event Near Miss Safety Event “Good Catch”

“Swiss cheese” model of accident causation Some holes due to active failures Losses Hazards Other holes due to latent conditions Successive layers of defences, barriers and safeguards System defences

Can you think about a particular patient safety event in our system?

Can you think of specific examples? �Wrong medication �Wrong dose / route �Unrecognized clinical deterioration �Wrong procedure �Tunnel vision / decision‐making �Treatment delay

What Kinds of Errors do Human Make? Knowledge-based 1. Figuring it Out 30 -60 errors/100 acts 15% of healthcare errors Rule-based 2. By the Rules 1 error/100 acts Skill-based 3. Auto-Pilot 3 errors/1, 000 acts 60% of 25% of healthcare errors

Medication Related Events are common in prehospital care…

Medication Error “Any preventable event that may cause or lead to inappropriate medication use or patient harm while the medication is in the control of the health care professional, patient, or consumer” National Coordinating Committee-Medication Error Reporting and Prevention (NCC MERP); accessed at http: //www. nccmerp. org/about. Med. Errors. html; Jan. 2012.

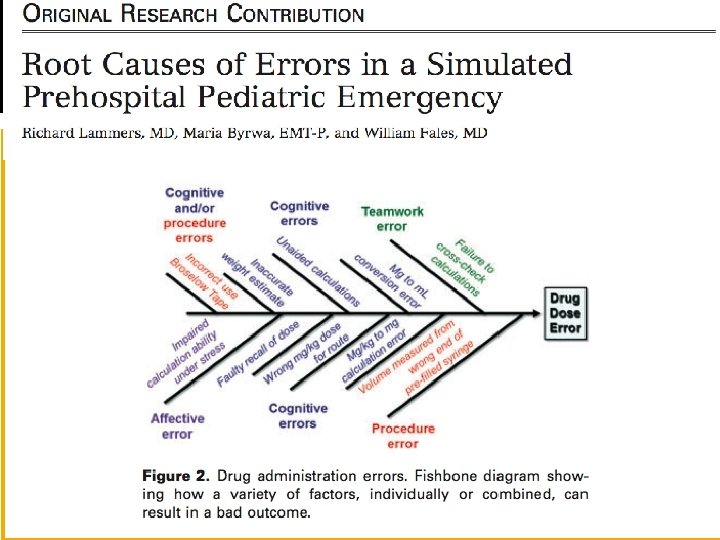
Medication Errors Figure 2. Commonly studied medication errors as causes of adverse drug events (ADEs): percent of ADEs for each cause: Reducing and Preventing Adverse Drug Events To Decrease Hospital Costs. March 2001. Agency for Healthcare Research and Quality, Rockville, MD

Out-of-hospital environment �Emergency situation �No written order �No external crosscheck �No electronic decision support �High‐risk medications �Drug shortage issues and constant substitutions

�EMTPs completed pediatric patient simulation scenarios �Failure to use Broselow tape: 50% �Incorrect use of Broselow tape: 47% �Incorrect dosing: Epinephrine: 68 -73% Diazepam: 47%; Midazolam 60%

ATCEMS Medication Related Events 61 70 49 60 50 40 30 20 10 0 2012 2013

g. M ro n y 2 la 3 De 0 tio n 2 ed ica n io at 4 W C 10 ep ar OL M 4 Pr No ed 0 rm io n 12 fo tp er 0 ra t e ut 1 No nt nc e 2 Ro 12 tio n ed ica io n 16 Co M ca t di 4 In 14 Do se 4 n 6 tio ca n tio la lcu in di nt ra Co Ca ATCEMS Medication Related Events 16 16 12 10 8 8 5 4 2012 3 2013 2 1 1 0 0 0

Fentanyl administration �We continue to see confusion with dosage calculation � 1 mcg/kg first dose (max 100 mcg) 25 mcg every 10 minutes if needed – max total 300 mcg �Goal is to reduce confusion �Protocol committee looking at other potential COG changes

Prevention of Medication Errors �Most providers have memorized the five rights of medication administration Right patient, Right route, Right dose, Right time and Right medication. �These 5 “Rights” focus mostly on individual performance. �System-wide issues may impact the ability for providers to perform the 5 “Rights”

Medication Safety Strategies �Standardization in medication administration procedure �Use of memory aids and checklists �Risk-reduction strategies to minimize opportunities for error Medication storage and packaging �Redundancies and independent backups Team-work crosscheck

Medication Errors �Performance improvement team actively working in identifying additional ways to eliminate medication related events in our system �More information to come with 2015 COG update.
")
PI Updates STEMI Update Cardiac Arrest Update Clinical Performance Indicators Clinical Audits (Surveillance)

Reminder

PI Updates Performance Improvement Activities
 � 560+ calls DMO Line")
Performance Improvement Activities � 17, 730 PCR’s reviewed (2013) � 560+ calls DMO Line 211 clinical events 45% self report rate �Medical Director meetings CY 2012 = 22 CY 2013 = 33
 � PCR’s Reviewed: (n=13, 495) Trauma Activations (n=181) Stroke Activations")
EMS Calls Reviewed (2013) � PCR’s Reviewed: (n=13, 495) Trauma Activations (n=181) Stroke Activations (n=415) STEMI Activation/Feedback (n=271) ACS (n=2260) Altered Mental Status (n=5550) Seizure (n=3513) Stroke (n=635) Cardiac Arrest (n=670)
 High Risk Low Frequency Events (n=4, 025) NTI (n=5) OTI (n=22)")
Clinical Audits (2013) High Risk Low Frequency Events (n=4, 025) NTI (n=5) OTI (n=22) Surgical Airway (n=1) Diltiazem (n=42) Versed (n=605) Fentanyl (n=3, 000) Tourniquet (n=13) Pelvic Binder (n=3) Needle Decompression (n=13) CPAP (n=305) Pacing (n=24) Cardioversion (n=5) July-Dec 2013

Clinical Events Reviewed DMO Activity 140 120 100 80 Count 60 40 2012 Level 11 41 Level 22 105 Level 33 62 Near Miss 1 Self Reports 92 2013 53 134 23 1 93

STEMI

How important is to save time if the D 2 B time will beat the 90 minute goal?

� 43, 801 STEMI PCI patients �Median D 2 B of 83 min (IQR 6‐ 109 min) �Examined D 2 B time vs. Mortality � 2005‐ 2006; 600 US Centers

�Consecutive Patients �No Transfers �No Pre PCI thrombolytic treatments �Analysis repeated excluding patients in shock �Analysis repeated using only D 2 B < 6 hours
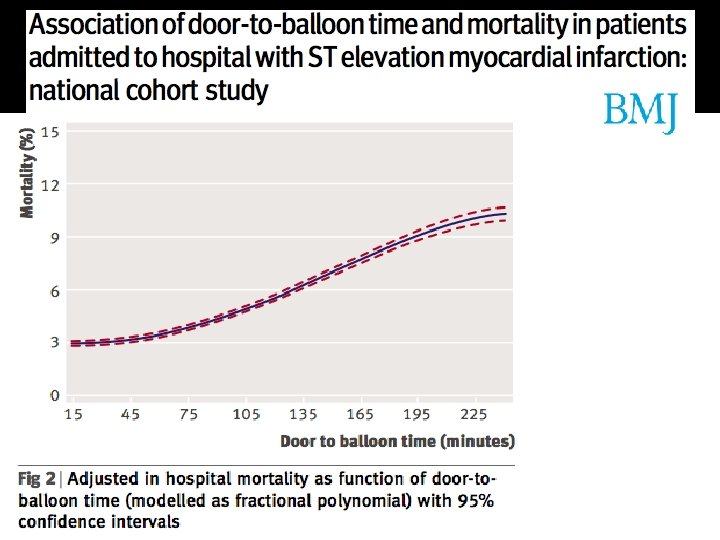

Key Take Home Message for STEMI: • Limit Scene Time • Identify STEMI early • Activating the PCI team makes a difference

We need to work harder… �Minimize on scene interventions �Shorten time‐to‐First 12‐lead �Minimize total Scene Time Remember prehospital STEMI Bundle ▪ ASA, 12‐lead (activation), PCI Center (< 90 balloon) ▪ NNT = 15 Harm avoided: Stroke, 2 nd MI or Death

Cardiac Arrest

Cardiac Arrest Data, Analysis & CPR Quality

� 84, 625 in hospital arrests 2000‐ 2009 � 79. 3% AS or PEA � 20. 7% VF or VT �Survival to D/C 13% to 22. 3%
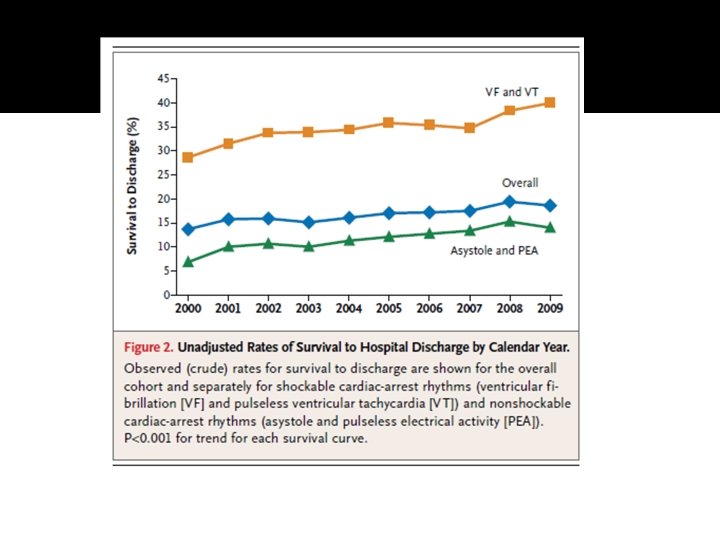

In-Hospital Cardiac Arrest �Asystole and PEA survival about 13‐ 14% � 40% significant, 17% severe disability �VF / VT survival 40% � 25% Significant, 8% Severe Disability New Engl J Med 2012; 367: 1917 -20

�AHA Consensus Statement addressing four key areas: Metrics of CPR Performance Monitoring and feedback Team‐level logistics issues Emphasis on CQI for resuscitation
, �Chest compression rate �Chest compression")
Components of High Performance CPR �Chest compression fraction (CCF), �Chest compression rate �Chest compression depth � Chest recoil (residual leaning) � Ventilation.

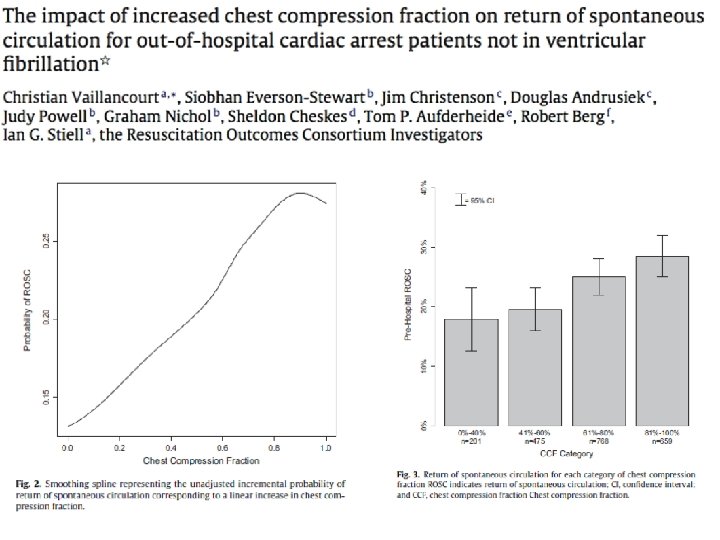
Minimize Interruptions �Goal is to maximize the amount of time chest compressions generate blood flow �CCF is the proportion of time that chest compressions are performed during a cardiac arrest �Data on out‐of‐hospital cardiac arrest indicate that lower CCF is associated with decreased ROSC and survival

�Chest

� 2013 Non‐VF patients from ROC Network � 64% Asystole, 28% PEA �Median Compression Rate: 110/min �ROSC 24. 2% � 2% Survival to D/C �Increasing CCF = ROSC �Target a CCF of 80%

Our EMS System Compression Fraction 89%
 94 93 91 91 W/ Mechanical ct")
Compression Fraction 2013 CPR Compression Fraction (Median) 94 93 91 91 W/ Mechanical ct ob e r No ve m be r Se Manual 91 90 90 90 st gu Au ly Ju ne Ju ay M ril ch M ar ua ry 91 90 Fe br 92 90 89 Ja nu 92 O 90 92 be r 91 Ap 91 92 pt em 92 ar y 95 94 93 92 91 90 89 88 87 86
 91 91 92 91 88 87 87")
Compression Fraction 2013 CPR Compression Fraction (Average) 91 91 92 91 88 87 87 88 90 91 90 88 92 91 90 88 88 85 83 Manual W/ Mechanical ob e O ct be r r No ve m be r Se pt em st gu Au ly Ju ne Ju ay M ril Ap ch M ar br Fe Ja nu ua ry 81 ar y 94 92 90 88 86 84 82 80 78 76 74

Our System’s Cardiac Arrest Survival Rates

Current CARES Sites As of January 2014

National CARES 10. 1% * *Indicates incomplete quarter The clinical measures presented above have been approved by the EMS System Medical Director

National CARES 30. 8% * *Indicates incomplete quarter The clinical measures presented above have been approved by the EMS System Medical Director

Performance improvement updates Clinical Performance Indicators

Trauma Scene Time 16: 39 09: 42

Stroke Scene Time 15: 32 10: 57

STEMI Scene Time 19: 02 11: 52

Delays STEMI Scene Time � 19 minutes on-scene, 10 minutes to first 12 lead. NTG OS � 23 minutes, 15 minutes to 12 lead, � 19 minutes on-scene, 9 minutes to obtain 12 lead � 19 minutes, 5 minutes to 12 lead. 3 NTG on the scene prior to transport � 15: 35 on-scene, 10 minutes to 1 st 12 lead � 16 minutes on the scene, 6 minutes to the first 12 lead. IV initiated prior to leaving the scene

Aspirin in ACS 96%

BGL in Altered Mental Status 94%

BGL in Seizure 94%

BGL in Stroke 96%

AHA Mission lifeline EMS System Recognition Measures

D 2 B of ≤ 90 minutes now reads “an ideal of FMC ‐to‐device time. STEMI System goal of ≤ 90 minutes” (1 B) FMC of 120 minutes or less is new target for patients who arrive at a non‐PCI center (1 B) D 2 B now officially transitioning to “E 2 B”

Mission Lifeline EMS Recognition FMC to Device < 90 Minutes 88%

Mission Lifeline EMS Recognition 92%

Questions? ? �Paul. hinchey@austintexas. gov �Jose. cabanas@austintexas. gov
- Slides: 85