
OLIGOPOLY Definition and characteristics Price and Output Decisions





- Slides: 15
OLIGOPOLY § Definition and characteristics § Price and Output Decisions for an Oligopoly: § Non-price Competition § Price Rigidity and Kinked Demand Curve § Price Leadership Model § Cartel § Game theory
Definition: Oligopoly = the market where there are only a few firms (more than two firms) in the industry producing either identical or differentiated products. Characteristics: 1. Few numbers of firms: • Small number of firms but size of firm is large. The market share of each firm is large enough to dominate the market. Few firms control the overall industry. • The main criterion is the mutual interdependence between these firms. Firms will consider the reactions of its rivals/competitors in decision making.
2. Homogeneous or differentiated product: For example cement or electrical appliances produced by one firm are identical to another firm. On the other hand, automobiles produced by major automakers are different in term of design, technology, performance and price. 3. Mutual interdependence: A condition in which an action by one firm may cause a reaction from other firms. Changes in price or output by one firm can have direct effect on another firm. (Firms will consider the reactions of its rivals/competitors in decision making). 4. Barriers to entry: Oligopoly firms will restrict new entrants into market. These barriers include control over certain resources, patent rights, exclusive financial requirements and other legal barriers.
Price and Output Decisions for an Oligopolist Mutual interdependence among firms in an oligopoly makes this market structure more difficult to analyze. Firms have to consider the reaction of its rivals when taking decisions. Some well-known oligopoly models: • non-price competition • the kinked demand curve • price leadership • the cartel • Game theory
Nonprice Competition: Firms will compete with each other by using better advertising and product differentiation (producing new products and improve the quality of the existing product). These strategies will attract more customers to the firm, and give consumers more choice. Note: Oligopolists would compete through non-price competition, rather than price competition. If a firm reduces the price of a product, its rivals/competitors will easily and quickly reduce their prices. There is a risk of price war if the price reduction continues.
Price Rigidity and Kinked Demand Curve = a demand curve facing an oligopolist that assumes rivals will match a price decrease, but ignore a price increase. Price F Po If a firm ↑P, competitors will Ep >1 not follow. Customers switch to rivals. E If a firm ↓P, Ep <1 competitors will follow. Customers do not switch D Qo Quantity
Price Rigidity Price F P* MC 0 E MC 1 a b The kinked dd curve below point E creates a gap in the MR (dotted line ab). Any change in MC between ab, equilibrium price and quantity will be constant. The stability in price and quantity is called price rigidity. D Q* MR Quantity
Example: Athletic footwear faces the following demand curve: P 1 = 600 – 0. 5 Q 1 for price increase P 2 = 700 – 0. 75 Q 2 for price decrease The firm’s marginal cost is RM 150. (a) What is the price and quantity at the kink? (b) At what range of value will the marginal cost shift without changing price and output? (c) What is the profit maximizing price and quantity if the marginal cost is RM 250?
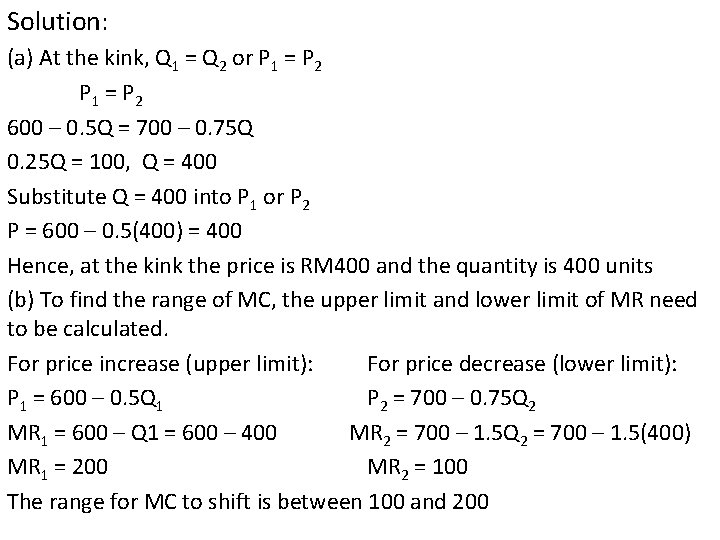
Solution: (a) At the kink, Q 1 = Q 2 or P 1 = P 2 600 – 0. 5 Q = 700 – 0. 75 Q 0. 25 Q = 100, Q = 400 Substitute Q = 400 into P 1 or P 2 P = 600 – 0. 5(400) = 400 Hence, at the kink the price is RM 400 and the quantity is 400 units (b) To find the range of MC, the upper limit and lower limit of MR need to be calculated. For price increase (upper limit): For price decrease (lower limit): P 1 = 600 – 0. 5 Q 1 P 2 = 700 – 0. 75 Q 2 MR 1 = 600 – Q 1 = 600 – 400 MR 2 = 700 – 1. 5 Q 2 = 700 – 1. 5(400) MR 1 = 200 MR 2 = 100 The range for MC to shift is between 100 and 200
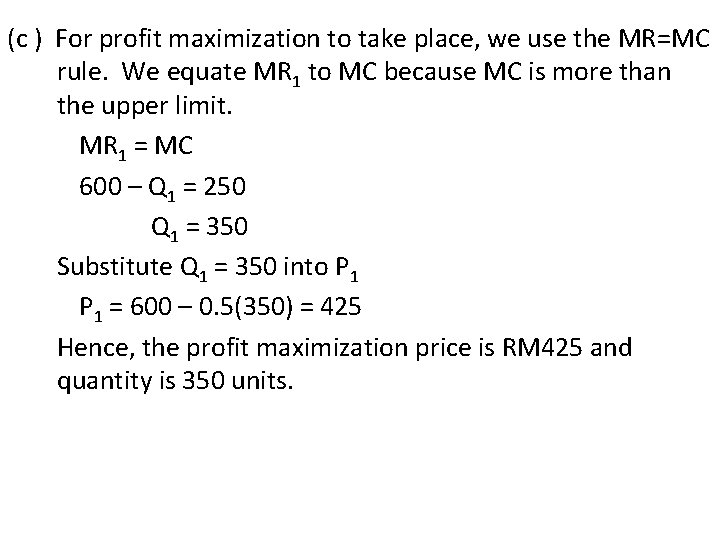
(c ) For profit maximization to take place, we use the MR=MC rule. We equate MR 1 to MC because MC is more than the upper limit. MR 1 = MC 600 – Q 1 = 250 Q 1 = 350 Substitute Q 1 = 350 into P 1 = 600 – 0. 5(350) = 425 Hence, the profit maximization price is RM 425 and quantity is 350 units.
Price Leadership Model: • A pricing strategy in which a dominant firm sets the price for an industry, and the other firms follow. • The dominant firm may be • The largest firm that dominates the overall industry • Due to lower costs of production • Being economically powerful • Being able to forecast the market condition accurately. • Hence, the dominant price leader firm can act as a monopoly. The firm sets its price to maximize profits and other firms will set the prices at the same level.
CARTEL: § Cartel is a group of firms that formally agree to control the price and the output of a product. § The objective is to get monopoly profits by replacing competition with cooperation. § The best known cartel is the Organization of Petroleum Exporting Countries (OPEC).
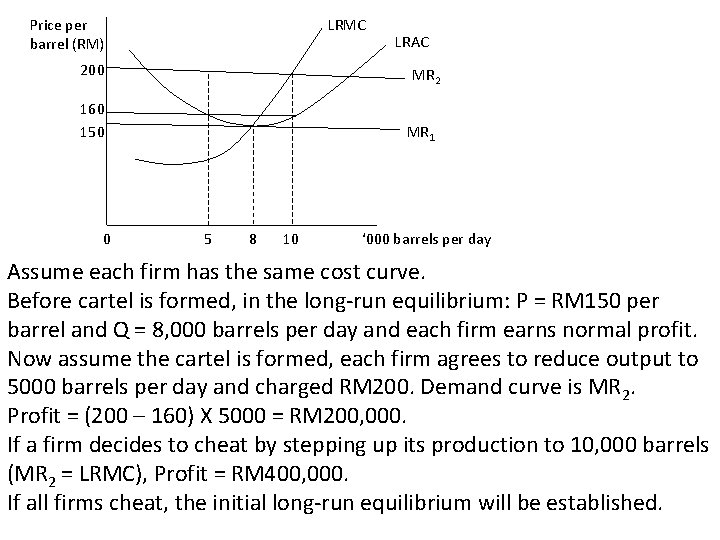
Price per barrel (RM) LRMC 200 MR 2 160 150 0 LRAC MR 1 5 8 10 ‘ 000 barrels per day Assume each firm has the same cost curve. Before cartel is formed, in the long-run equilibrium: P = RM 150 per barrel and Q = 8, 000 barrels per day and each firm earns normal profit. Now assume the cartel is formed, each firm agrees to reduce output to 5000 barrels per day and charged RM 200. Demand curve is MR 2. Profit = (200 – 160) X 5000 = RM 200, 000. If a firm decides to cheat by stepping up its production to 10, 000 barrels (MR 2 = LRMC), Profit = RM 400, 000. If all firms cheat, the initial long-run equilibrium will be established.
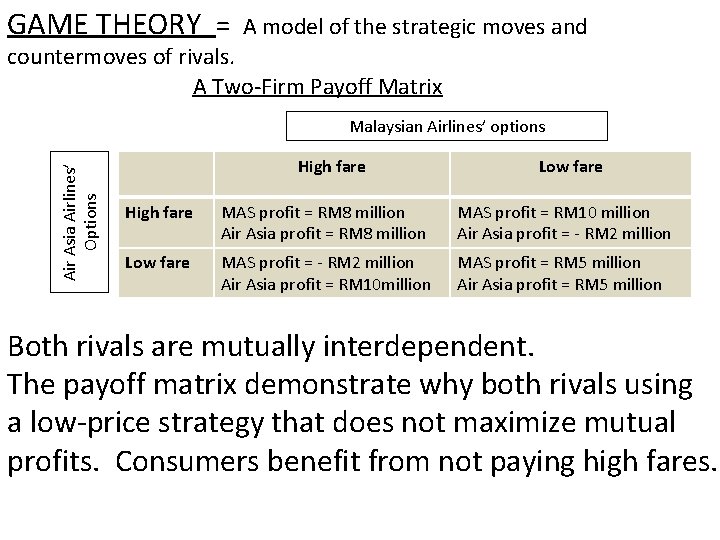
GAME THEORY = A model of the strategic moves and countermoves of rivals. A Two-Firm Payoff Matrix Air Asia Airlines’ Options Malaysian Airlines’ options High fare Low fare High fare MAS profit = RM 8 million Air Asia profit = RM 8 million MAS profit = RM 10 million Air Asia profit = - RM 2 million Low fare MAS profit = - RM 2 million Air Asia profit = RM 10 million MAS profit = RM 5 million Air Asia profit = RM 5 million Both rivals are mutually interdependent. The payoff matrix demonstrate why both rivals using a low-price strategy that does not maximize mutual profits. Consumers benefit from not paying high fares.
How can these firms avoid the low-price outcome? • Price leadership: informal agreement, the leader sets the profit maximizing high price & other competitor follows. • Form cartel: an agreement among firms to cooperate with one another to act together as a monopoly. Cartels will establish monopoly price and earns supernormal profit.