OLAP fundamentals OLAP Conceptual Data Model Goal of


: – technology used to perform updates")

 – Array-based storage structures – Direct")


 – dimension reduction: e. g. ,")
 NY LA Juice 10 Cola 47 Milk 30 Cream")
 • http:")


 § Cognos Accelerator § Copy Manager, Data Migrator")
 Brio")
 Decision Series (Accrue) Enterprise")


 • Support for")


 Duration Pain 2 Intensity Elevation Pain ECG:")
")
 Explanation Provided Modeling Examples Effort Needed Rule-based Exp.")

 • Creating the future hospital system –")
 • Creating the future payor system –")
- Slides: 84
OLAP fundamentals
OLAP Conceptual Data Model § Goal of OLAP is to support ad-hoc querying for the business analyst § Business analysts are familiar with spreadsheets § Extend spreadsheet analysis model to work with warehouse data § Multidimensional view of data is the foundation of OLAP
OLTP vs. OLAP § On-Line Transaction Processing (OLTP): – technology used to perform updates on operational or transactional systems (e. g. , point of sale systems) § On-Line Analytical Processing (OLAP): – technology used to perform complex analysis of the data in a data warehouse OLAP is a category of software technology that enables analysts, managers, and executives to gain insight into data through fast, consistent, interactive access to a wide variety of possible views of information that has been transformed from raw data to reflect the dimensionality of the enterprise as understood by the user. [source: OLAP Council: www. olapcouncil. org]
OLTP vs. OLAP OLTP OLAP User Function DB Design • • Clerk, IT Professional Day to day operations • • Knowledge worker Decision support • • Subject-oriented (Star, snowflake) Data View Usage Unit of work Access Operations # Records accessed #Users Db size Metric • • • Application-oriented (E-R based) Current, Isolated Detailed, Flat relational Structured, Repetitive Short, Simple transaction Read/write Index/hash on prim. Key Tens Thousands 100 MB-GB Trans. throughput • • • Historical, Consolidated Summarized, Multidimensional Ad hoc Complex query Read Mostly Lots of Scans Millions Hundreds 100 GB-TB Query throughput, response Source: Datta, GT
Approaches to OLAP Servers • Multidimensional OLAP (MOLAP) – Array-based storage structures – Direct access to array data structures – Example: Essbase (Arbor) • Relational OLAP (ROLAP) – Relational and Specialized Relational DBMS to store and manage warehouse data – OLAP middleware to support missing pieces • Optimize for each DBMS backend • Aggregation Navigation Logic • Additional tools and services – Example: Microstrategy, Meta. Cube (Informix)
MOLAP
Multidimensional Data NY LA SF Juice Cola Milk Cream 10 47 30 12 3/1 3/2 3/3 3/4 Date Sales Volume as a function of time, city and product
Operations in Multidimensional Data Model • Aggregation (roll-up) – dimension reduction: e. g. , total sales by city – summarization over aggregate hierarchy: e. g. , total sales by city and year -> total sales by region and by year • Selection (slice) defines a subcube – e. g. , sales where city = Palo Alto and date = 1/15/96 • Navigation to detailed data (drill-down) – e. g. , (sales - expense) by city, top 3% of cities by average income • Visualization Operations (e. g. , Pivot)
A Visual Operation: Pivot (Rotate) NY LA Juice 10 Cola 47 Milk 30 Cream 12 Region SF th n Mo Product 3/1 3/2 3/3 3/4 Date
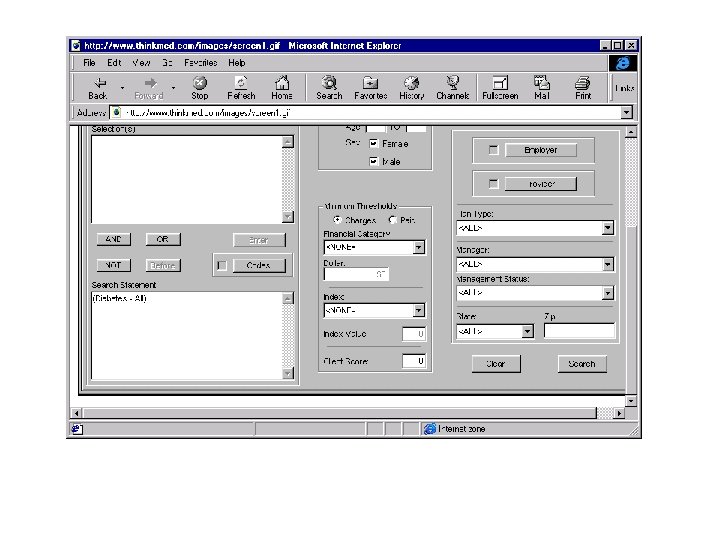
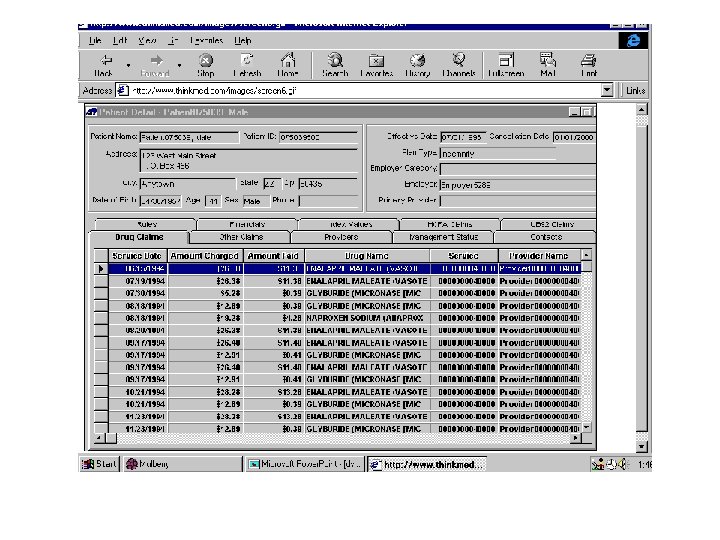
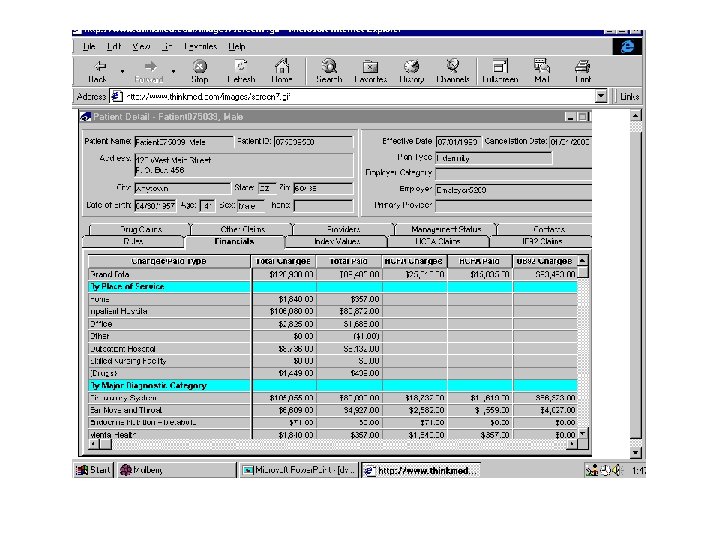
Thinkmed Expert: Data Visualization and Profiling (http: //www. click 4 care. com) • http: //www. thinkmed. com/softdemo. ht m
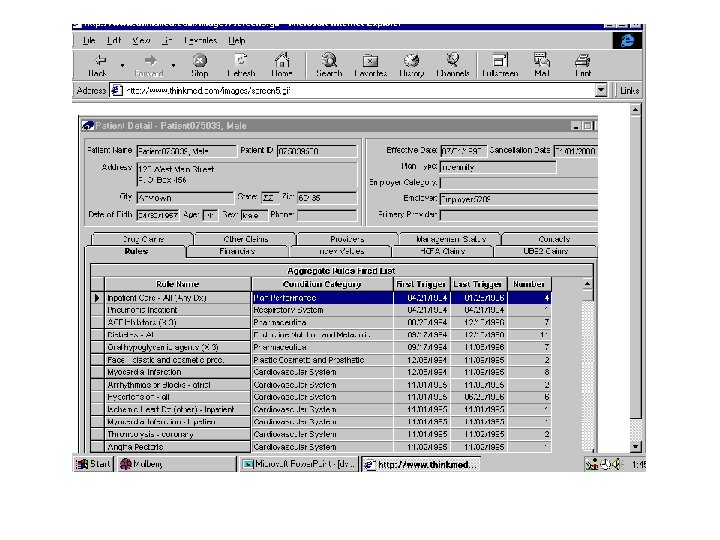
Think. Med Expert • Processing of consolidated patient demographic, administrative and claims information using knowledge-based rules • Goal is to identify patients at risk in order to intervene and affect financial and clinical outcomes
Vignette • High risk diabetes program • Need to identify – patients that have severe disease – patients that require individual attention and assessment by case managers • Status quo – rely on provider referrals – rely on dollar cutoffs to identify expensive patients
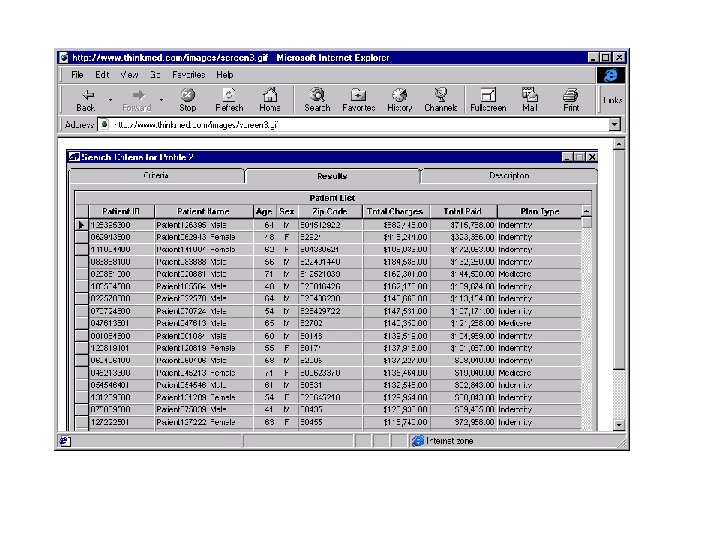
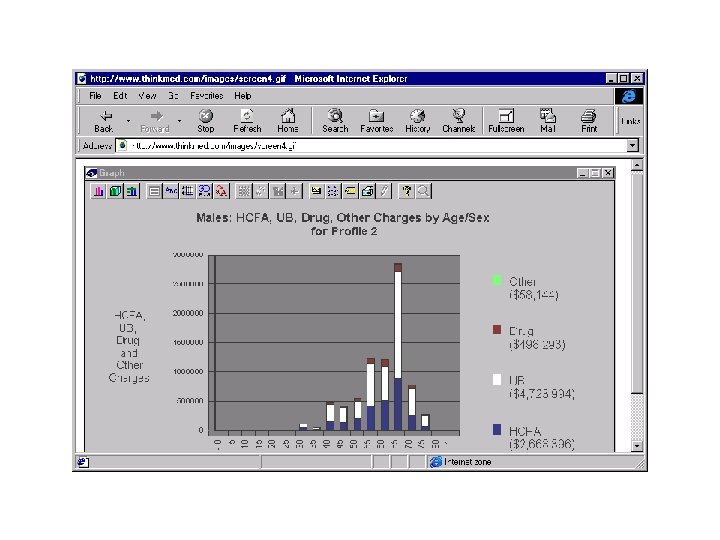
Vignette • Think. Med approach – Interactive query facility with filters to identify patients in the database that have desired attributes • patients that are diabetic and that have cardiac, renal, vascular or neurological conditions (use of codes or natural language boolean queries) • visualize financial data by charge type
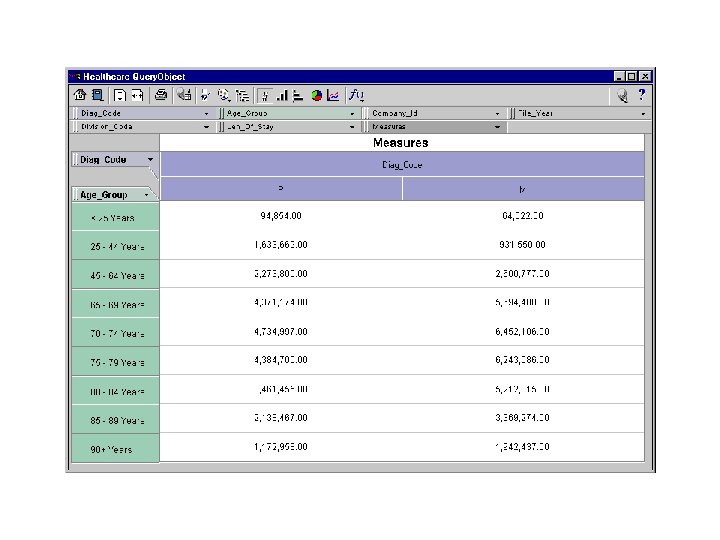
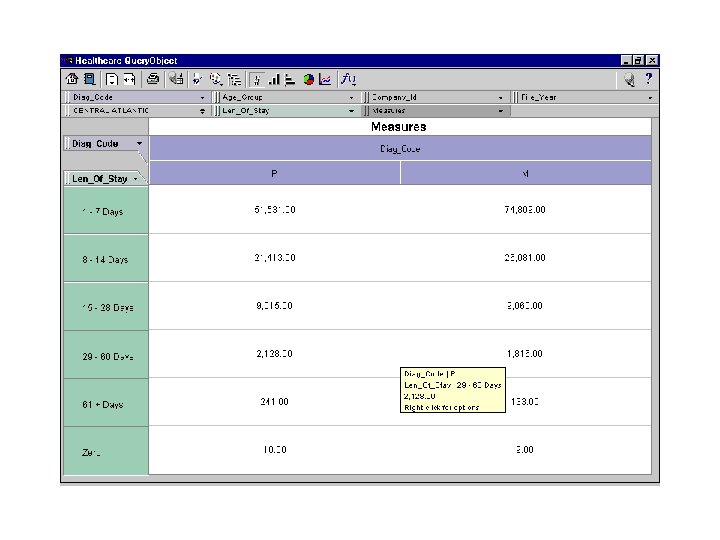
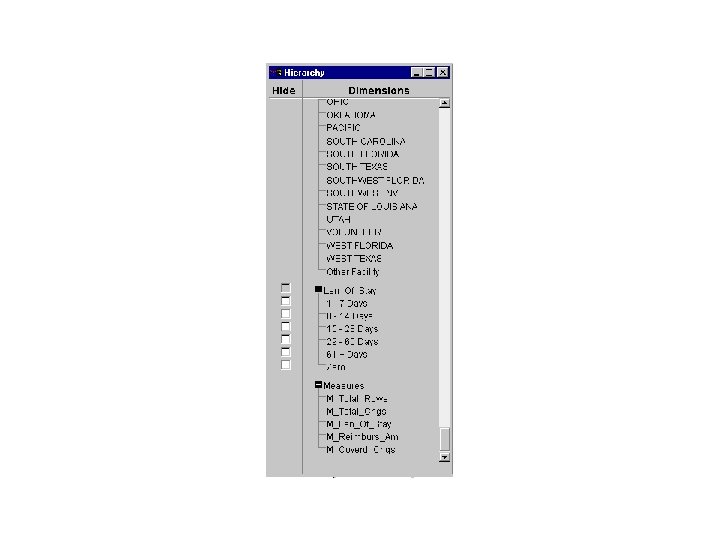
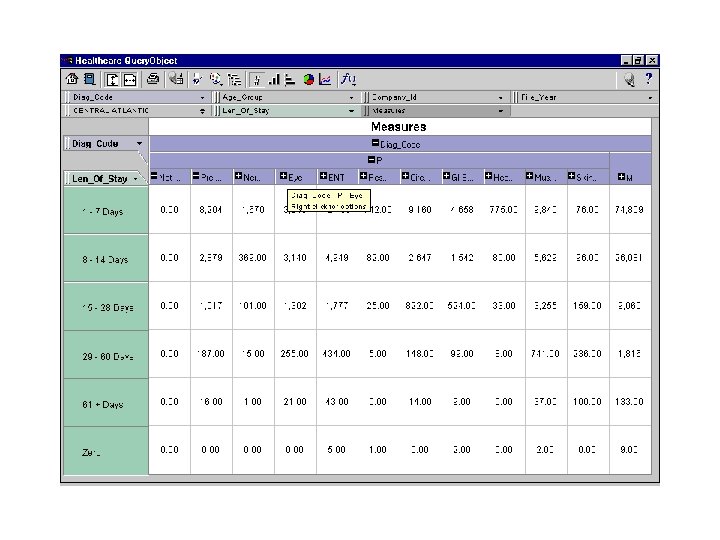
Administrative DSS using WOLAP
ROLAP
Relational DBMS as Warehouse Server • Schema design • Specialized scan, indexing and join techniques • Handling of aggregate views (querying and materialization) • Supporting query language extensions beyond SQL • Complex query processing and optimization • Data partitioning and parallelism
MOLAP vs. OLAP • Commercial offerings of both types are available • In general, MOLAP is good for smaller warehouses and is optimized for canned queries • In general, ROLAP is more flexible and leverages relational technology on the data server and uses a ROLAP server as intermediary. May pay a performance penalty to realize flexibility
Tools: Warehouse Servers § The RDBMS dominates: § § § § Oracle 8 i/9 i IBM DB 2 Microsoft SQL Server Informix (IBM) Red Brick Warehouse (Informix/IBM) NCR Teradata Sybase…
Tools: OLAP Servers § Support multidimensional OLAP queries § Often characterized by how the underlying data stored § Relational OLAP (ROLAP) Servers § Data stored in relational tables § Examples: Microstrategy Intelligence Server, Meta. Cube (Informix/IBM) § Multidimensional OLAP (MOLAP) Servers § Data stored in array-based structures § Examples: Hyperion Essbase, Fusion (Information Builders) § Hybrid OLAP (HOLAP) § Examples: Power. Play (Cognos), Brio, Microsoft Analysis Services, Oracle Advanced Analytic Services
Tools: Extraction, Transformation, & Load (ETL) § Cognos Accelerator § Copy Manager, Data Migrator for SAP, People. Soft (Information Builders) § Data. Propagator (IBM) § ETI Extract (Evolutionary Technologies) § Sagent Solution (Sagent Technology) § Power. Mart (Informatica)…
Tools: Report & Query § § § § Actuate e. Reporting Suite (Actuate) Brio One (Brio Technologies) Business Objects Crystal Reports (Crystal Decisions) Impromptu (Cognos) Oracle Discoverer, Oracle Reports QMF (IBM) SAS Enterprise Reporter…
Tools: Data Mining § § § Business. Miner (Business Objects) Decision Series (Accrue) Enterprise Miner (SAS) Intelligent Miner (IBM) Oracle Data Mining Suite Scenario (Cognos)…
Data Mining: A brief overview Discovering patterns in data
Intelligent Problem Solving • Knowledge = Facts + Beliefs + Heuristics • Success = Finding a good-enough answer with the resources available • Search efficiency directly affects success
Focus on Knowledge • Several difficult problems do not have tractable algorithmic solutions • Human experts achieve high level of performance through the application of quality knowledge • Knowledge in itself is a resource. Extracting it from humans and putting it in computable forms reduces the cost of knowledge reproduction and exploitation
Value of Information • Exponential growth in information storage • Tremendous increase in information retrieval • Information is a factor of production • Knowledge is lost due to information overload
KDD vs. DM • Knowledge discovery in databases – “non-trivial extraction of implicit, previously unknown and potentially useful knowledge from data” • Data mining – Discovery stage of KDD
Knowledge discovery in databases • • Problem definition Data selection Cleaning Enrichment Coding and organization DATA MINING Reporting
Problem Definition • Examples – What factors affect treatment compliance? – Are there demographic differences in drug effectiveness? – Does patient retention differ among doctors and diagnoses?
Data Selection • • • Which patients? Which doctors? Which diagnoses? Which treatments? Which visits? Which outcomes?
Cleaning • • • Removal of duplicate records Removal of records with gaps Enforcement of check constraints Removal of null values Removal of implausible frequent values
Enrichment • Supplementing operational data with outside data sources – Pharmacological research results – Demographic norms – Epidemiological findings – Cost factors – Medium range predictions
Coding and Organizing • • • Un-Normalizing Rescaling Nonlinear transformations Categorizing Recoding, especially of null values
Reporting • • Key findings Precision Visualization Sensitivity analysis
Why Data Mining? · Claims analysis - determine which medical procedures are claimed together. · Predict which customers will buy new policies. · Identify behavior patterns of risky customers. · Identify fraudulent behavior. · Characterize patient behavior to predict office visits. · Identify successful medical therapies for different illnesses.
Data Mining Methods • Verification – OLAP flavors – Browsing of data or querying of data – Human assisted exploration of data • Discovery – Using algorithms to discover rules or patterns
Data Mining Methods • Artificial neural networks: Non-linear predictive models that learn through training and resemble biological neural networks in structure. • Genetic algorithms: Optimization techniques that use processes such as genetic combination, mutation, and natural selection in a design based on the concepts of natural evolution. • Decision trees: Tree-shaped structures that represent sets of decisions. These decisions generate rules for the classification of a dataset. • Nearest neighbor method: A technique that classifies each record in a dataset based on a combination of the classes of the k record(s) most similar to it in a historical dataset (where k 1). Sometimes called the knearest neighbor technique. • Rule induction: The extraction of useful if-then rules from data based on statistical significance. • Data visualization: The visual interpretation of complex relationships in multidimensional data. Graphics tools are used to illustrate data relationships.
Types of discovery • Association – identifying items in a collection that occur together • popular in marketing • Sequential patterns – associations over time • Classification – predictive modeling to determine if an item belongs to a known group • treatment at home vs. at the hospital • Clustering – discovering groups or categories
Association: A simple example • • Total transactions in a hardware store = 1000 number which include hammer = 50 number which include nails = 80 number which include lumber = 20 number which include hammer and nails = 15 number which include nails and lumber = 10 number which include hammer, nails and lumber = 5
Association Example • Support for hammer and nails =. 015 (15/1000) • Support for hammer, nails and lumber =. 005 (5/1000) • Confidence of “hammer ==>nails” =. 3 (15/50) • Confidence of “nails ==> hammer”=15/80 • Confidence of “hammer and nails ===> lumber” = 5/15 • Confidence of “lumber ==> hammer and nails” = 5/20
Association: Summary • Description of relationships observed in data • Simple use of bayes theorem to identify conditional probabilities • Useful if data is representative to take action – market basket analysis
Bayesian Analysis New Information Prior Probabilities Bayesian Analysis Posterior Probabilities
A Medical Test A doctor must treat a patient who has a tumor. He knows that 70 percent of similar tumors are benign. He can perform a test, but the test is not perfectly accurate. If the tumor is malignant, long experience with the test indicates that the probability is 80 percent that the test will be positive, and 10 percent that it will be negative; 10 percent of the tests are inconclusive. If the tumor is benign, the probability is 70 percent that the test will be negative, 20 percent that it will be positive; again, 10 percent of the tests are inconclusive. What is the significance of a positive or negative test?
. 2 Test positive. 7 Benign . 1 Inconclusive. 7 Test negative . 8 Test positive. 3 Malignant . 1 Inconclusive. 1 Test negative
Benign Test Positive Malignant Benign Test inconclusive Malignant Benign Test negative Malignant
. 7 Benign . 3 Malignant . 2 Test Positive. 1 Test inconclusive. 7 Test negative. 8 Test positive. 1 Test inconclusive. 1 Test negative Benign Test positive. 14 +. 24 =. 38 . 14/. 38 =. 368 Malignant. 27/. 38 =. 632 Test inconclusive. 07 +. 03 =. 10 . 49 +. 03 =. 52 . 14. 07. 49. 24. 03 Path probability. 14. 24 Benign . 07 Malignant . 03 . 07/. 10 =. 7. 03/. 10 =. 3 Test negative Path probability Benign . 49/. 52 =. 942 Malignant . 03/. 52 =. 058 . 49. 03
Decision pro
Rule-based Systems A rule-based system consists of a data base containing the valid facts, the rules for inferring new facts and the rule interpreter for controlling the inference process • Goal-directed • Data-directed • Hypothesis-directed
Classification • Identify the characteristics that indicate the group to which each case belongs – pneumonia patients: treat at home vs. treat in the hospital – several methods available for classification • regression • neural networks • decision trees
Generic Approach • Given data set with a set of independent variables (key clinical findings, demographics, lab and radiology reports) and dependent variables (outcome) • Partition into training and evaluation data set • Choose classification technique to build a model • Test model on evaluation data set to test predictive accuracy
Multiple Regression • Statistical Approach – – independent variables: problem characteristics dependent variables: decision • the general form of the relationship has to be known in advance (e. g. , linear, quadratic, etc. )
Neural Nets Source: GMS Lab, UIUC
Neural Nets Source: GMS Lab, UIUC
Neural networks • Nodes are variables • Weights on links by training the network on the data • Model designer has to make choices about the structure of the network and the technique used to determine the weights • Once trained on the data, the neural network can be used for prediction
Neural Networks: Summary • widely used classification technique • mostly used as a black box for predictions after training • difficult to interpret the weights on the links in the network • can be used with both numeric and categorical data
Myocardial Infarction Network (Ohno-Machado et al. ) Duration Pain 2 Intensity Elevation Pain ECG: ST 4 1 Myocardial Infarction 0. 8 Smoker 1 Age 50 Male 1 “Probability” of MI
Thyroid Diseases (Ohno-Machado et al. )
Model Comparison (Ohno-Machado et al. ) Explanation Provided Modeling Examples Effort Needed Rule-based Exp. Syst. Bayesian Nets moderate Classification Trees low Neural Nets low Regression Models high low high moderate high “high” low moderate
Summary Neural Networks are • mathematical models that resemble nonlinear regression models, but are also useful to model nonlinearly separable spaces • “knowledge acquisition tools” that learn from examples • Neural Networks in Medicine are used for: – pattern recognition (images, diseases, etc. ) – exploratory analysis, control – predictive models
Case for Change (Price. Waterhouse. Coopers 2003) • Creating the future hospital system – Focus on high-margin, high-volume, highquality services – Strategically price services – Understand demands on workers – Renew and replace aging physical structures – Provide information at the fingertips – Support physicians through new technologies
Case for Change (Price. Waterhouse. Coopers 2003) • Creating the future payor system – Pay for performance – Implement self-service tools to lower costs and shift responsibility – Target high-volume users through predictive modeling – Move to single-platform IT and data warehousing systems – Weigh opportunities, dilemmas amid public and private gaps