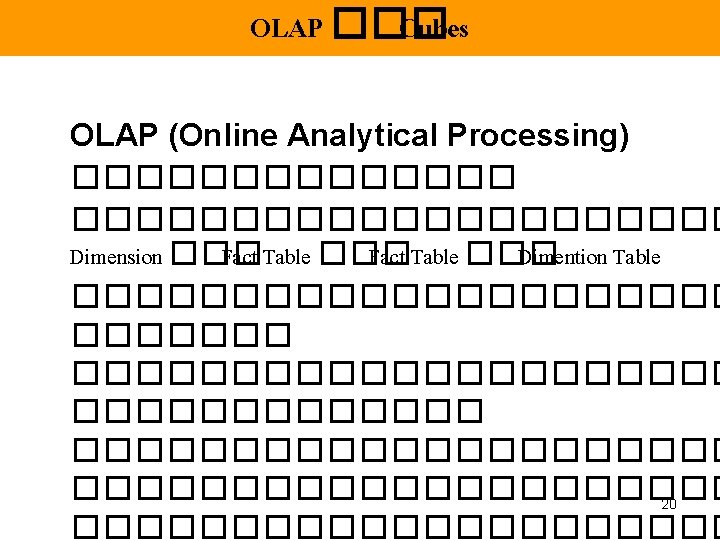
OLAP Analysis and Design 1 Star Schema Dimensional


 Region Sum North 61,")
 Product Type Glossary Misc. Region")
 Source Cube ABC North South 10, 000 20, 000")
 Product Type Glossary Misc. Product Fish Meat Pork Medicine")
 Shop Date Product Type Date Shop Product Type 31")
 Product Type Glossary Misc. Shop ABC 30, 000 Platter")
, Database Systems: A Practical Approach")


, Database Systems: A Practical Approach")

- Slides: 38
OLAP Analysis and Design 1
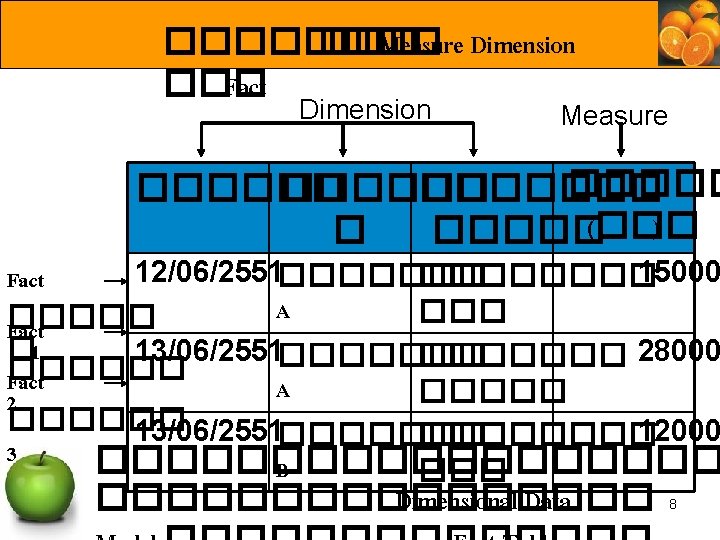
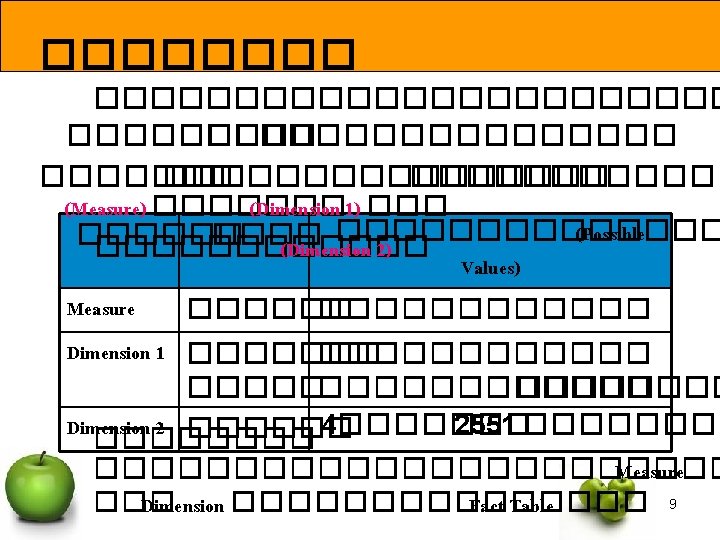
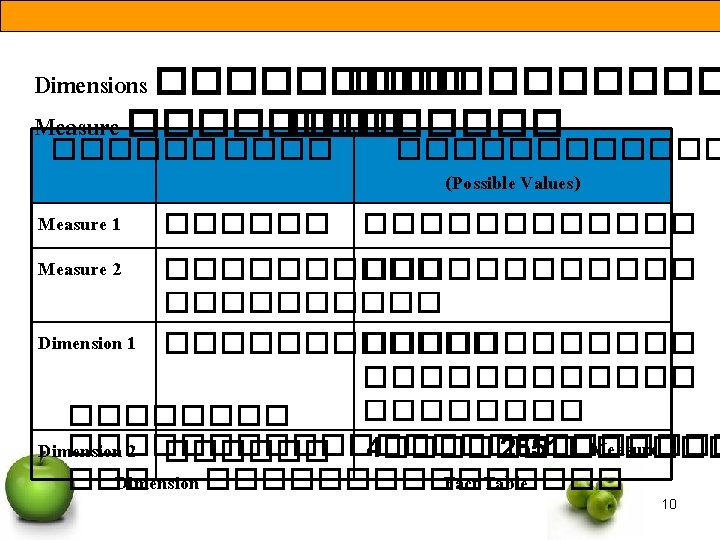
Star Schema ������� Dimensional Data Model ����� Fact Table ���������� Dimension Table ���������� Measure �� Fact Table ������������ Dimension Table ������� 11
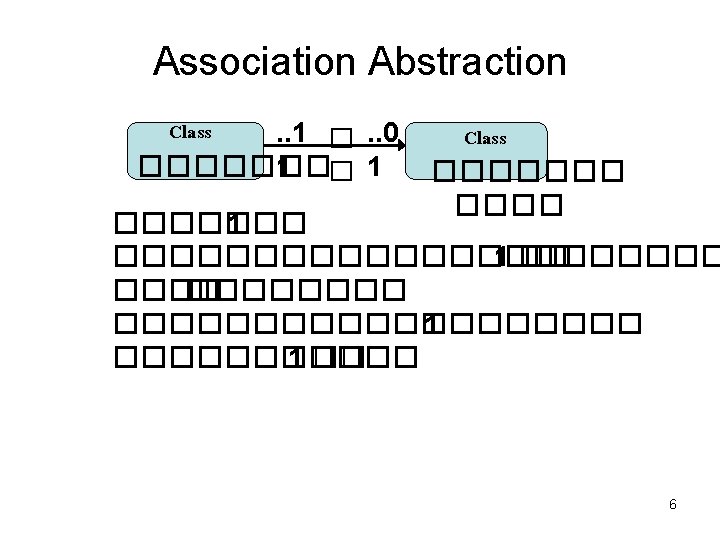
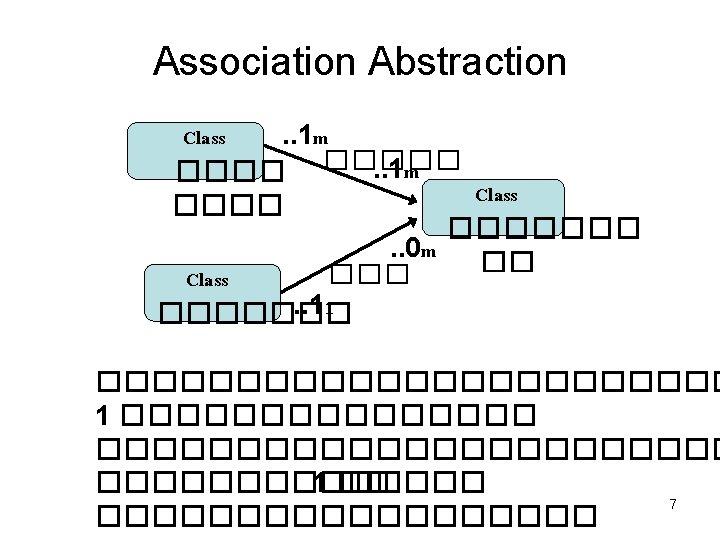
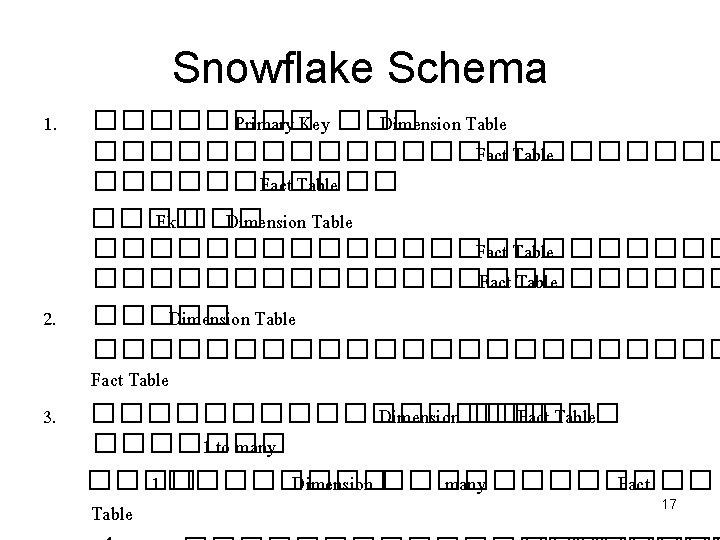
Star Schema 1. ���� Primary Key ��� Dimension Table ������� Fact Table 2. ���������� Dimension ��� Fact Table ������� 1 to many ���� 1 ���� Dimension ���� many ���� Fact Table 3. Measure ��������� 4. Attribute ����� Dimension 12 ���������� (Varchar)
Dimension: Shop Id Dimension: Product Shop Name Product Id Product Name 001 เจรญใจ 112 BISCUIT 002 JJ Service 113 ICE CREAM 003 คมคา 114 CAKE Fact: Sales Shop Id Dimension: Date Product Id Date Id Sales Amount Date Id Date Month Year 2130 10/Jan/2001 112 2130 800 2165 11/Jan/2001 113 2156 900 2174 12/Jan/2001 002 113 2156 700 003 114 2156 600 14 ������
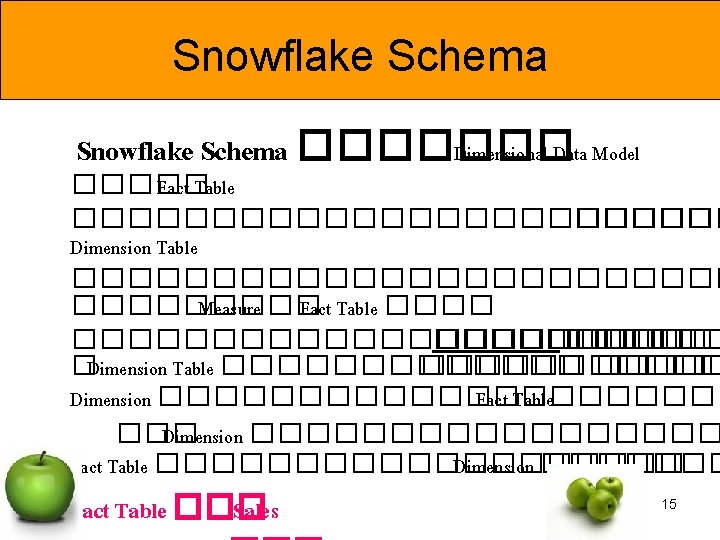
Snowflake Schema ��� ���������� �� ������ Dimension Table ������� ��� Date, Shop, Product, Region, Product type ����� Dimension ������� Fact Table ��� Date, Shop, Product 16
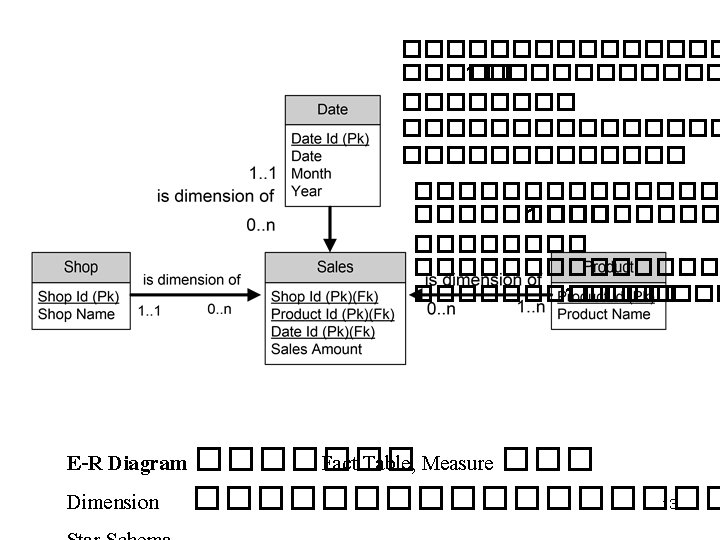
E-R Diagram ������� Fact Table, Measure ��� Dimension ��������� 18
Dimension: Shop Region Id Shop Id 11 001 เจรญใจ 11 Maeka Phayao 22 002 JJ Service 22 Muang Phayao 22 003 คมคา Fact: Sales Shop Name Region Id Shop Id Product Id Date Id Sales Amount 001 112 2130 800 001 113 2156 002 113 003 114 Region Name Dimension: Date Id Date Month Year 2130 10/Jan/2001 900 2165 11/Jan/2001 2156 700 2174 12/Jan/2001 2156 600 Dimension: Product Type Id Product Name 1 112 BISCUIT 2 113 ICE CREAM 1 114 CAKE Product Type Id Product Type Name 1 Snack 2 Ice Cream 19 ������
2 -dimension Cube 2 nd Dimension 1 st Dimension 21
- 3 dimension Cube 2 nd Dimension 1 st Dimension 3 rd Dimension 22
4 - dimension Cube 2 nd Dimension 4 th Dimension 3 rd Dimension 1 st Dimension 23
900 700 114 600 001 002 003 2156 2130 d 113 te I 112 Da Product Id 800 Shop Id �������� 113 ������ 900+700 = 1600 ���� Cube ����� Star Schema 24
Product Type Product Id 800 113 1 114 Shop Id Region Id 900 700 600 001 11 002 22 003 22 2156 2130 d 2 te I 112 Da 1 �������� 113 ������ 900+700 = 1600 ���� Cube ����� Snowflake Schema 25
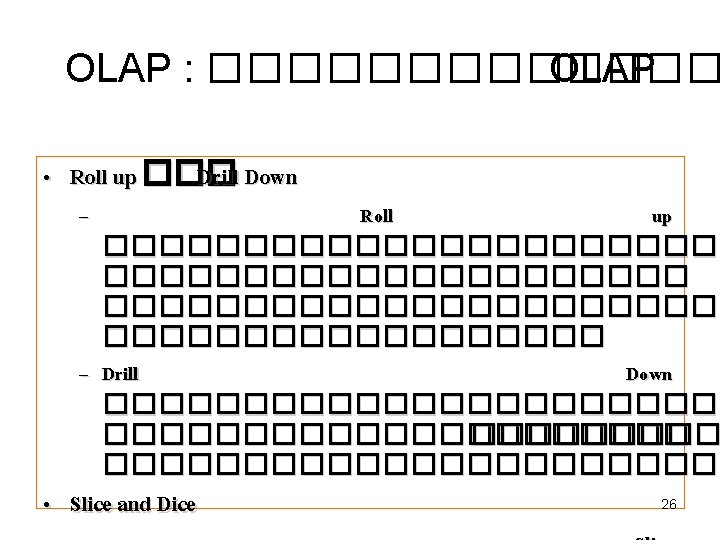
�������� OLAP : Roll up ��� Drill Region Down (1/2) Region Sum North 61, 000 South 41, 500 Roll up Drill Down Product Type Glossary Misc. Region North 55, 000 South 31, 000 Roll up 6, 000 10, 500 Region-Product Type Drill Down Product Type Glossary Region Shop North ABC 30, 000 North Platter 25, 000 South Five Mart 31, 000 Misc. 6, 000 27 10, 500 Region-Shop-Product Type
�������� OLAP : Roll up ��� Drill Down (2/2) Product Type Glossary Misc. Region Shop North ABC 30, 000 North Platter 25, 000 6, 000 South Five Mart 31, 000 10, 500 Roll up Region-Shop-Product Type Drill Down Product Type Glossary Misc. Product Fish Meat Pork Medicine Pencil Region Shop North ABC North Platter South Five Mart 10, 000 20, 000 8, 000 Region-Shop-Product Type 25, 000 6, 000 23, 000 10, 000 500 28
�������� OLAP : Slice (1/2) Source Cube ABC North South 10, 000 20, 000 10, 000 Platter 10, 000 25, 000 6, 000 Five Mart 8, 000 10, 000 23, 000 10, 000 500 Fish Meat Pork Glossary Med. Slice ABC Pencil North Misc. South Slice 10, 000 20, 000 10, 000 Platter 10, 000 25, 000 Five Mart 10, 000 8, 000 23, 000 Fish ABC North South 10, 000 20, 000 10, 000 25, 000 6, 000 Five Mart 10, 000 8, 000 23, 000 10, 000 Meat Glossary Pork Glossary Platter Fish Meat Med. 500 Pencil Misc. ������� Slice ��� 29 �������
�������� OLAP : Slice (2/2) Product Type Glossary Misc. Product Fish Meat Pork Medicine Pencil Region Shop North ABC North Platter South Five Mart 10, 000 20, 000 8, 000 25, 000 6, 000 23, 000 10, 000 500 Slice: Glossary Product Type Glossary Product Fish Meat Pork Region Shop North ABC North Platter 10, 000 25, 000 South Five Mart Slice 8, 000 23, 000 �������� 30 �������������
�������� OLAP : Dice (1/2) Shop Date Product Type Date Shop Product Type 31 �����������
�������� OLAP : Dice (2/2) Product Type Glossary Misc. Shop ABC 30, 000 Platter 25, 000 6, 000 Five Mart 31, 000 10, 500 Product Type Glossary Shop-Product Type Misc. Date 6/07/2004 43, 000 10, 000 7/07/2004 43, 000 6, 500 Date-Product Type 32 �����������
Example: Star Schema 33 Source: Connelly & Begg (2001), Database Systems: A Practical Approach to Design, Implementation, and Management (3 rd Edition), Addison Wesley
Example: Snowflake Schema 4 Measures = Offer. Price, Selling. Price, Sale. Commission, Sale. Revenue ����� City. ID, Province ������� Fact Table 34 Source: Connelly & Begg (2001), Database Systems: A Practical Approach to Design, Implementation, and Management (3 rd Edition), Addison Wesley
Constellation Schema • A Constellation Schema contains more than one fact table sharing one or more dimension tables – Multiple fact tables and dimension tables form ‘constellation’ of facts 35
Example: Constellation Schema 36 Source: Connelly & Begg (2001), Database Systems: A Practical Approach to Design, Implementation, and Management (3 rd Edition), Addison Wesley
Fact constellation schema architecture • For each star schema or snowflake schema it is possible to construct a fact constellation schema. This schema is more complex than star or snowflake architecture, which is because it contains multiple fact tables. This allows dimension tables to be shared amongst many fact tables. That solution is very flexible, however it may be hard to manage and support. http: //etl-tools. info/en/bi/datawarehouse_constellation-schema. htm 37