Oil Sands 101 ERG Victoria Jan 09 Roger


 Initial")
 Shaft & Tunnel Access SAGD Well Pairs Horizontal Injector And")


")


- Slides: 37
Oil Sands 101 ERG Victoria Jan 09 Roger Bailey
Alberta Tar Sands • • • Big, Tough Expensive Job Not Economic Depends on government handouts Dirty Oil Pollutes the Environment – Air: SOx, Nox, CO 2, Climate – Water: consumption, toxic sludge – Land: Devastates Boreal forest • Destroys society
Alberta Oil Sands • • World’s largest oil deposit 2, 000, 000 Established Reserves: 173, 000 barrels Canada’s economic engine $70 billion invested, $70 billion planned Now 1. 2 million BPD, 5 million BPD in 2030 Creates Jobs and Wealth Mining yesterday’s technology In-Situ SAGD is the future
What Changed? 1. 2. 3. 4. 5. Price of oil over $50 / bbl “The end of cheap oil” Government Policy. Technology Resources to Reserves
What Recently Changed? 1. Price of oil under $40 / bbl 2. Not “the end of cheap oil” 3. Government Policy 1. Royalties up (Syncrude + $2 billion) 2. Taxation: No accelerated CCA 3. CO 2 Penalties 4. Technology: CO 2 focus 5. Resources to Reserves? Economics
AOSTRA • Alberta Oil Sands Technology and Research Authority • Alberta invested $750 million in R&D • Industry matched funding and did the work • Enabling Technologies – Steam Assisted Gravity Drainage (SAGD) – Cold Water Extraction (OCWE) – Consolidated Tailings (CT)
Alberta’s Oil Sands Areas
Alberta Geology
Alberta Oil Sands Production
Alberta Oil Production Source: CERI Study CAPP Backgrounder 2008
Alberta Oil Update Dec 2008 Source: CAPP Update Dec 2008
Oil Sands Projects Athabasca Mining 1, 115, 000 – 2, 977, 000 Athabasca In-Situ 324, 000 – 1, 543, 000 Cold Lake In-Situ 219, 000 – 280, 000 Peace River In-Situ 12, 000 – 100, 000
Mining Technology Change • Truck and Shovel Hydrotransport Cold Water Extraction Consolidated Tailings
Athabasca – Mining Operator Project Initial Potential Albian/Shell Muskeg/Jackpine 150, 000 560, 000 Suncor Base Plant 280, 000 550, 000 Syncrude Base Plant 300, 000 600, 000 CNRL Horizon (2008) 135, 000 577, 000 Imperial Kearl (2010) 100, 000 300, 000 Petro-Canada Fort Hills (2011) 100, 000 190, 000 Total Joslyn Creek Mine(2013) 50, 000 200, 000
Athabasca – In Situ - SAGD Operator Project Initial Potential • JACOS Hangingstone 1 0, 000 30, 000 • Suncor Firebag 68, 000 375, 000 • Conoco. Phillips Surmont 25, 000 110, 000 • En. Cana Christina/Foster 42, 000 400, 000 • Devon Jackfish 35, 000 70, 000 • Husky Sunrise (2012) 50, 000 200, 000 • OPTI/Nexen Long Lake 72, 000 288, 000 • Petro-Canada Mac. Kay River 22, 000 70, 000
Cold Lake – In Situ –SAGD Operator Project • Shell Hilda Lake (pilot) Initial 600 Potential 20, 000 • CNRL Primrose 50, 000 110, 000 • Imperial Cold Lake (CSS) 150, 000 110, 000 • Husky Tucker 18, 000 40, 000 • Peace River – In Situ • Shell Peace River 12, 000 100, 000
Underground Test Facility (UTF) Shaft & Tunnel Access SAGD Well Pairs Horizontal Injector And Producer
Steam Assisted Gravity Drainage • Steam injected in upper horizontal well melts the bitumen • Bitumen flows by gravity down to the lower producing well • Steam chamber grows as bitumen is produced • Recovery over 60%
SAGD Applicability • • • Resources to Reserves 352 Billion @ 6% 239 Billion @ 10% EUB Reserves in 2000 173 Billion based on SAGD • Steam Assisted Gravity Drainage
Oil Sands Reserves
Steam Assisted Gravity Drainage
Steam Assisted Gravity Drainage • SADG needs steam. Steam Oil Ratio ~3 • Steam is water and energy – Both are limited and expensive • • Little fresh water: saline and recycle Expensive water treatment required Energy? Gas, Co-generation? Gasification? Pitch? Nuclear?
SAGD CO 2 Emissions • Natural gas for steam ~1 GJ/barrel • CO 2 Emissions ~60 kg/bbl • Cogeneration: – Gas turbine produces electricity – Exhaust + re-firing produces steam • Cogen steam for SAGD with no CO 2 • CO 2 in Cogen charged to electricity • CO 2 from Cogen less than coal
Nuclear Energy for Oil Sands? Nuclear for steam, electricity and hydrogen is possible but….
Oil Sands Projects Source: CERI Study CAPP Backgrounder 2008
Bitumen Upgrading • Upgrading takes the black out of black oil, the tar (asphalt) • Synthetic crude approximates crude oil for refineries • SCO flows and distils to refinery fuel products • Bitumen needs carbon out or hydrogen in • Capital, energy and CO 2 intensive • Refinery integration in US?
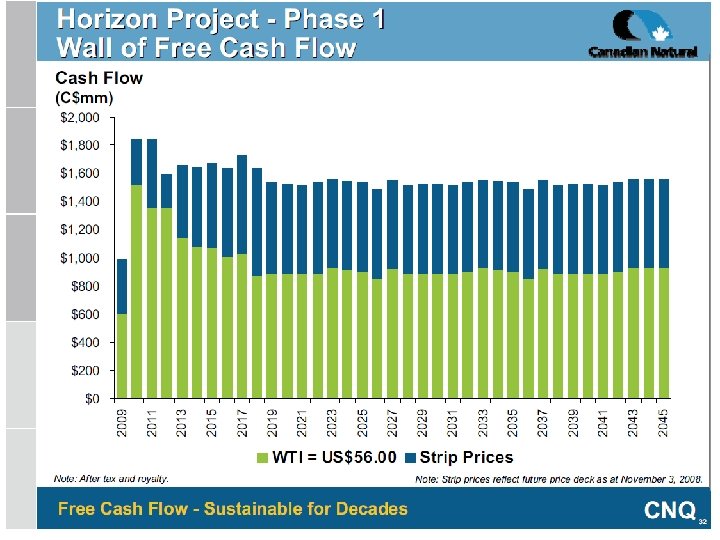
Wall of Cash Flow “Wall of Cash Flow”
20 Year Horizon Source: CERI Study CAPP Backgrounder 2008
20 Year Horizon Source: CERI Study CAPP Backgrounder 2008
Oil Sands Challenges • Environmental sustainability – CO 2 costs – Natural gas limitations and costs • • • Fiscal changes, lower returns Infrastructure limitations Workforce New Markets and Pipelines Upgrading? Moving to US refineries
Inflation: Capital Cost Source: CAPP Backgrounder 2008
Dirty Oil? • • Not the “End of Oil” nirvana Other oil options will be produced Oil Sands, Oil Shale, Carbonates Life Cycle Analysis: – 85% of Emissions in use as fuel
Life Cycle Analysis