Ohio River Source Water Protection Program USEPA Regional


- Slides: 34
Ohio River Source Water Protection Program USEPA Regional Source Water Protection Program Briefing Thank you for your patience. This webinar will begin shortly after 10: 00 am EDT
Presentation Guide �Who is ORSANCO �Current Source Water Protection program �Current algae/nutrients programs and what they tell us �Future Ohio River HAB program
The Ohio River � 981 miles long �Starts in Pittsburgh, ends in Cairo, IL � 204 k square mile watershed �Part of 15 states (ORSANCO Compact District only 8 states) � 25 million people basin population � 20 locks and dams � 70 flood control reservoirs �Triples the flow of the Mississippi at their confluence
ORSANCO � Compact signed in 1948 by 8 states of the Ohio River Basin. Approved by Congress � 3 Commissioners appointed from each State and the Federal Government � ORSANCO performs studies at the direction of the Commissioners, �Water Quality Monitoring and Assessment � 305(b) Report �Spill Management �Source Water Protection �Pollution Control Standards �Public Information
Partnerships - Nutrients/Algae �Federal partners �US EPA �Regional Technical Assistance Groups �US ACE �Datasonde/Telemetry system at JT Myers L&D in 2016 �USGS �KASMC �Datasonde/Telemetry � Olmstead L&D � Licking River �State partners �Indiana �Wabash River project �Ohio �Toxin Analysis �Private partners �Utilities �Universities �Hyperspectral analysis
ORSANCO Source Water Protection Program � Provide maximum protection to drinking water purveyors that use the Ohio River and tributary waters as their primary water source. �SWP and Emergency Response interchangeable � most events occur outside of “Zones of Critical Concern” �Facilitate communication � between state and federal agencies � between drinking water utilities � Water Users Advisory Committee, emergency response communications � In developing SWP plans and programs � Regarding activities that have potential to impact water quality for drinking water use, i. e. , dredging, construction, demolition, etc. �Convene interstate/regional SWP meetings between purveyors and other river users
Source Water Protection Program Challenges �The Ohio River is the single, longest most heavily industrialized river in the country �≈ 600 NPDES permitted discharges �> 260 M tons of waterborne commodities � 6% of which is hazardous material (14. 4 M tons) � 70% hazardous material past Cincinnati* *Southwest Ohio Hazardous Materials Commodity Flow Study, Blue Rock Enterprises, 2013
Source Water Protection Program Challenges � 33 Drinking Water Utilities serving more than 5 million consumers
Ohio River Source Water Protection �Petrochemical issues addressed through Organics Detection System and Spill Response �Algae issues need to be addressed in similar manner.
Questions �Are there any questions on general source water protection prior to moving on to nutrients/algae programs?
ORSANCO Algae/Nutrients Programs � Long Term Monitoring � 30 years of data �Nutrients (Total Phosphorus, TKN, Nitrate/Nitrite, Ammonia) collected bi-monthly from 16 Ohio River locations and 14 tributaries. � Biological Monitoring � 60 Ohio River sampling sites per year. Rotates each year. Covers entire river in 5 years �Nutrients/Chlorophyll a with macroinvertebrate/fish samples since 2014 � Used for identifying stressor/response relationship � Dissolved Oxygen Monitoring �Smithland (ORM 918) and JT Myers (ORM 848) dams � 5 years of data. June-October. �Physical parameters (p. H, Temp, Conductivity, DO, Turbidity, Chl. a) �Nutrients, BOD, TSS
ORSANCO Algae/Nutrients Programs � Algae/Nutrients Program � Collected nutrients, algae, chlorophyll a � 10 water utilities � 2000 -2013 � Purpose was to develop numeric nutrient criteria � Discontinued in 2013 to combine resources with macroinvertebrate sampling � Water Quality Trading Program � First water quality trading program designed to be interstate. � Pilot trades have been completed in Ohio, Kentucky and Indiana � Removed 100, 000 lbs nutrients from the basin (combined N&P) � WARMF Model � Calculates loads from point and non-point sources; determines in-stream attenuation � Can be used for determining effect of nutrient reduction actions and setting limits for TMDLs � Calibration for 6 sub-basins complete with the Wabash River soon to begin. This will cover essentially the northern half of the Ohio River Basin � Calibrated Ohio River Basin model is free for use
HAB Monitoring and Response Plan �Draft in 2015 �Uses WHO algal concentrations to rate blooms from low to high probability of effects �Plan is only for source water, not finished water �Defines communications between ORSANCO and it’s partners
Nutrients on the Ohio River � Current concentrations and downriver trend �Average TN 1. 5 mg/L �Average TP 0. 19 mg/L �Nutrients increase downriver with the largest “bump” coming from the tributaries that drain the corn belt �Nutrients are not generally a limiting factor in algae growth � Annual Trends �TP increasing �Nitrate/Nitrite stable � Load to Gulf of Mexico from Ohio River � 41% nitrogen (avg. 500, 000 metric tons) � 38% phosphorus (avg. 38, 000 metric tons)
Nutrient Sources to Gulf of Mexico Source: Gulf Hypoxia Action Plan
HABs on the Ohio River � 2008 � Microcystis bloom covers 30 miles of river in Cincinnati area � Health Department issued contact advisory � 2009 � Taste and odor complaints from Pittsburgh, PA to Wheeling WV (88 miles) � 2010 � Taste and odor complaints from Pittsburgh, PA to Wheeling WV and from Louisville, KY to Evansville, IN (278 miles) � Headlines in several papers concerning algae blooms � 2015 � Taste and odor complaints in Louisville, KY � Identified as diatom bloom
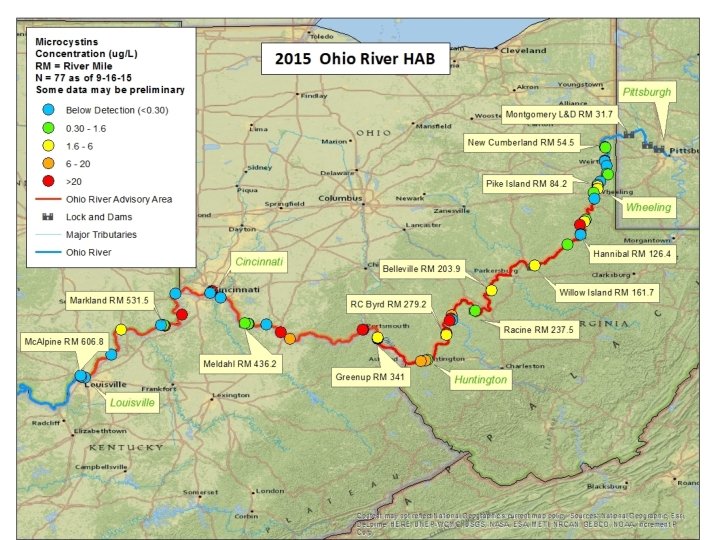
2015 HAB Event � Began Aug 19 as a reported � � � paint spill at ORM 84 (Wheeling, WV) By Sept 22 expanded to ORM 720 (110 miles downstream of Louisville, KY) HAB has not yet ended Microcystis Aerugenosa cell counts up to 31, 000 cells/ml Toxin concentrations up to 1, 900 ug/L ORSANCO has coordinated response with 6 States, 5 Federal Agencies (USEPA, Corps, F&W, USGS, USCG), numerous local health departments To date recreation advisories/bulletins in 4 States
HABs on Ohio River Tributaries � 2009 �Taste and odor complaint on Beaver River � 2011 �Complaint of “paint” coming from Little Miami River was algae bloom � 2010 – 2014 �Wabash River study identified 14 blooms over 20, 000 cells/ml in 4 year period
Potential Knowledge Gaps � What are the variables that contribute to HABs � A previous small scale study identified river velocity and light penetration as major factors � Timing of nutrient loads. � Temperature. Water utilities do not identify algae issues at temps below 80° F. � Role of tributaries � A study of the Wabash River showed some influence on the algal community of the Ohio River � Role of USACE reservoirs � Several reservoirs used to supply water to the Ohio River are known to have serious HAB occurrences � Toxin monitoring � 2 Ohio River water utilities (Louisville and Cincinnati) test for toxins. State of Ohio water utilities will soon have the capability. � State of Ohio sampling of algae blooms identified toxins in 40% of samples
Questions �Any questions on ORSANCO monitoring programs or the problems we have identified before moving on?
The Future of HAB Monitoring on the Ohio River �Goal 1: Develop a monitoring system that identifies and tracks algae blooms on the Ohio River and provides this data to State water managers and water utilities to allow treatment decisions to be made to maintain safe drinking water. �Goal 2: Predict the occurrence of HABs on the Ohio River �Goal 3: Development of stressor-response relationships
Benefits � Forecasting will improve utility preparedness � Sensor network will help provide additional preparation time for utilities and health departments � Ancillary Benefits �Improved trends and loading information � Support of Hypoxia Task Force Goals � Demonstrate effect of State nutrient reduction plans �Improved TMDL development with WARMF model
Critical Issues �Lessons learned from Ohio River Harmful Algae Bloom �Many organizations are interested in monitoring and tracking algae blooms and their causal factors. Communicating this information to the appropriate parties is a large part of a successful program.
Potential Components � River wide nutrients and algae monitoring system which provides real-time data � Rapid toxin analysis of identified algal blooms � Web portal for easy access to data � Integration with existing data sources (e. g. flow models) � Expert analysis of data (e. g. time of travel modeling) � Communications with affected entities � Investigate application of cutting edge technologies for monitoring and predicting HABS �Satellite imagery �Drone/Airplane mounted hypersectral imager
Proposed. Monitoring System � 32 telemetry stations. � 17 on Ohio River � 15 major tributaries �p. H, Temp, Turbidity, DO, Chlorophyll a, Cyanobacteria sensors �Associated sampling for nutrients � 3 FTE �Equipment Calibration 2/month (May-Oct) �Annual Maintenance �Upgrades to existing equipment (mobile laboratory, survey boat) � 10 yr equipment replacement cost
Web Portal http: //habs. glos. us/map
Projected Timeframe �Year 1 �Identify potential partners and form collaborative �State Environmental, Natural Resources, Health Dept’s �Federal agencies (EPA, USGS, NOAA) �Universities �Local monitoring organizations (KASMC) �Water utilities �Identify existing sources of data �Develop toxin analysis capability �Install real-time monitoring system �Research on cutting edge monitoring technologies
Projected Timeframe �Year 2 �Develop website/web portal �Begin pilot scale applications of cutting edge monitoring technology �Continue installation of real-time monitoring system �Years 3 -5+ �Continue installation of real-time monitoring equipment �Continue pilot scale applications of cutting edge monitoring technology
Goal 2 �Annual prediction of HABs �Model similar to those developed for Lake Erie HABs or Gulf of Mexico Hypoxia. Estimate the magnitude of issues associated with HABs for the summer season. �Identification of conditions appropriate for HABs. Inform utilities when they should be on the lookout for HAB formation.
Model Development �Timeframe: 3 -5 Years �Identify knowledge gaps �Use expertise from Collaborative formed for Goal 1 �Implement sampling programs to fill gaps �Final calibration of WARMF model �Develop predictive model
Goal 3 �Identification of the relationship between nutrients and HABs �Current focus is on macro-invertebrates
Projected Costs �Total implementation over 5 years �Capital Costs: $2, 750 K- $3, 200 �Annual O&M: $500 K-$800 K �Other Costs (annual): $100 K �Equipment replacement
Questions �Any questions on this draft proposal for dealing with HABs in the future?