
of MARKETING foundations Market Segmentation Finding a Base

of MARKETING foundations Market Segmentation: Finding a Base to Start Chapter 3 Copyright © 2003 by Nelson, a division of Thomson Canada Limited.
Market Segmentation: Finding a Base to Start Chapter 3 Objectives 3 -1 1. Explain the concept of the marketing plan. 2. Define market segmentation. 3. Discuss and apply five types of market segmentation in consumer markets. 4. Illustrate some aspects of the Canadian market in terms of the five types of consumer market segmentation. 5. Discuss and apply the main types of segmentation in industrial markets. Copyright © 2003 by Nelson, a division of Thomson Canada Limited.
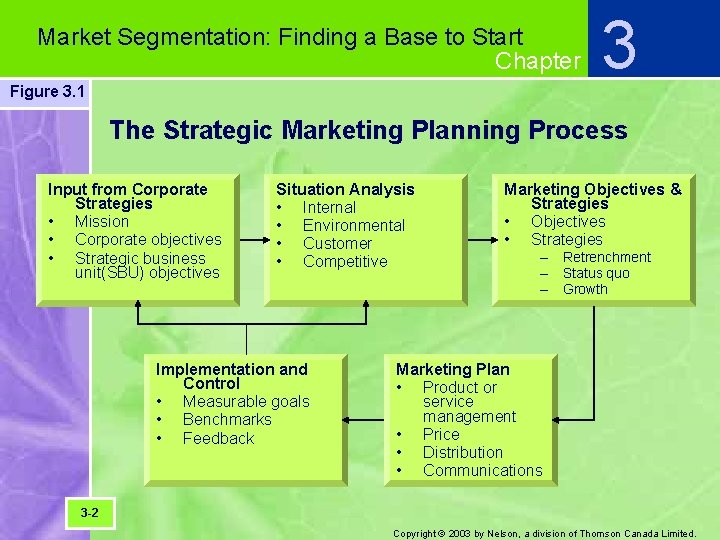
Market Segmentation: Finding a Base to Start Chapter 3 Figure 3. 1 The Strategic Marketing Planning Process Input from Corporate Strategies • Mission • Corporate objectives • Strategic business unit(SBU) objectives Situation Analysis • Internal • Environmental • Customer • Competitive Implementation and Control • Measurable goals • Benchmarks • Feedback Marketing Objectives & Strategies • Objectives • Strategies – Retrenchment – Status quo – Growth Marketing Plan • Product or service management • Price • Distribution • Communications 3 -2 Copyright © 2003 by Nelson, a division of Thomson Canada Limited.
Market Segmentation: Finding a Base to Start Chapter 3 Fundamental Tasks in Developing a Strategic Marketing Plan 1. Target Market 2. Implement a Marketing Program 3 -3 Copyright © 2003 by Nelson, a division of Thomson Canada Limited.
Market Segmentation: Finding a Base to Start Chapter 3 What is a Market? • People with the willingness, purchasing power, and the authority to buy. 3 -4 Copyright © 2003 by Nelson, a division of Thomson Canada Limited.
Market Segmentation: Finding a Base to Start Chapter 3 Consumer Goods • Those products and services purchased by the ultimate consumer for personal use. 3 -5 Copyright © 2003 by Nelson, a division of Thomson Canada Limited.
Market Segmentation: Finding a Base to Start Chapter 3 Industrial Goods • Those products purchased to be used, either directly or indirectly, in the production of other goods or for resale. 3 -6 Copyright © 2003 by Nelson, a division of Thomson Canada Limited.
Market Segmentation: Finding a Base to Start Chapter 3 Market Segmentation • Grouping people according to their similarity in one or more dimensions related to a particular product category. 3 -7 Copyright © 2003 by Nelson, a division of Thomson Canada Limited.
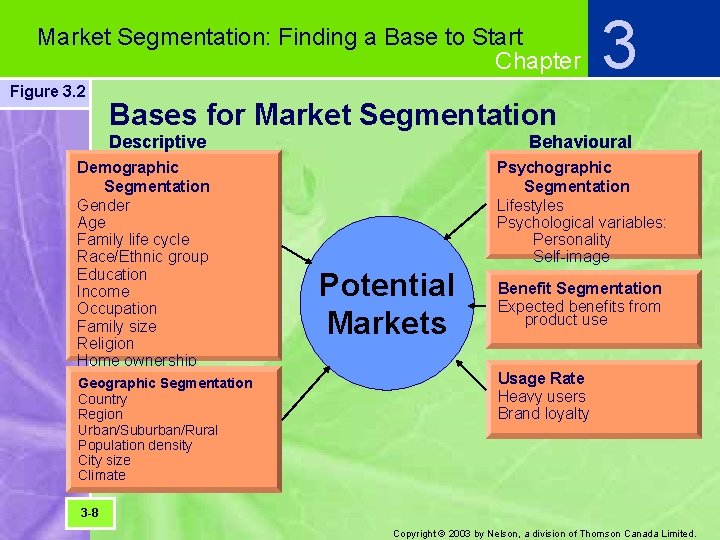
Market Segmentation: Finding a Base to Start Chapter Figure 3. 2 3 Bases for Market Segmentation Descriptive Demographic Segmentation Gender Age Family life cycle Race/Ethnic group Education Income Occupation Family size Religion Home ownership Geographic Segmentation Country Region Urban/Suburban/Rural Population density City size Climate Behavioural Psychographic Segmentation Lifestyles Psychological variables: Personality Self-image Potential Markets Benefit Segmentation Expected benefits from product use Usage Rate Heavy users Brand loyalty 3 -8 Copyright © 2003 by Nelson, a division of Thomson Canada Limited.
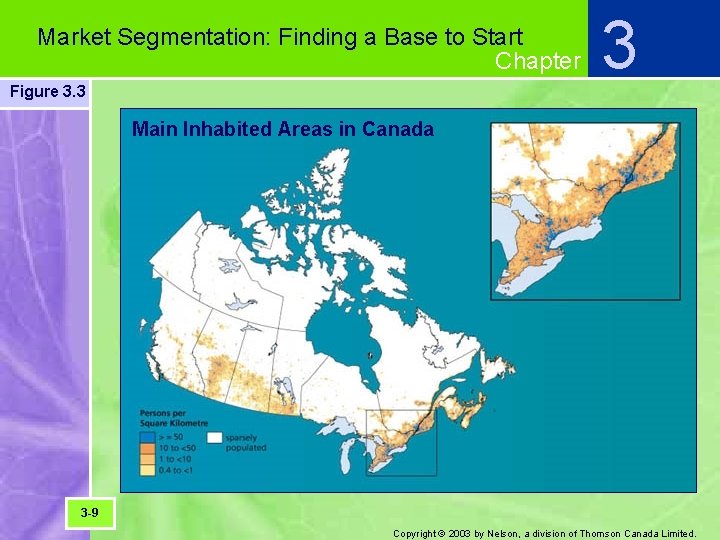
Market Segmentation: Finding a Base to Start Chapter 3 Figure 3. 3 Main Inhabited Areas in Canada 3 -9 Copyright © 2003 by Nelson, a division of Thomson Canada Limited.
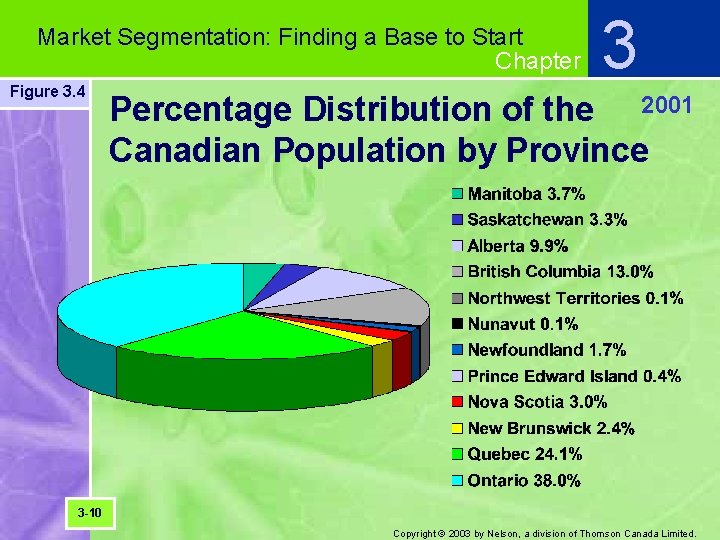
Market Segmentation: Finding a Base to Start Chapter Figure 3. 4 3 Percentage Distribution of the 2001 Canadian Population by Province 3 -10 Copyright © 2003 by Nelson, a division of Thomson Canada Limited.
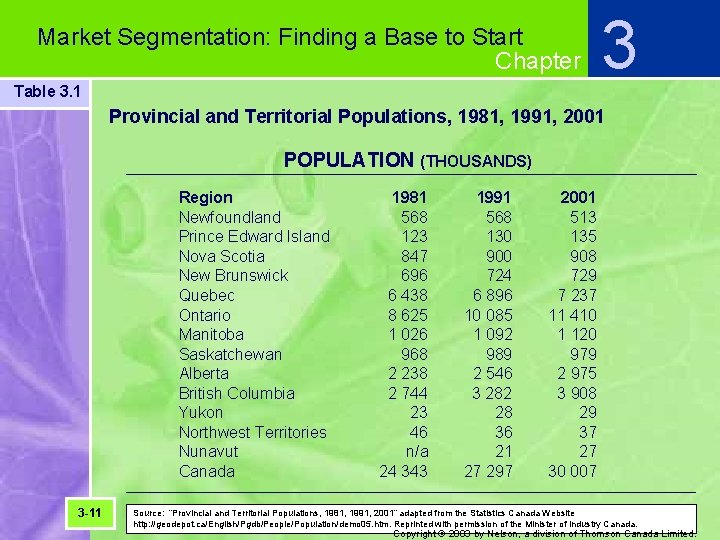
Market Segmentation: Finding a Base to Start Chapter 3 Table 3. 1 Provincial and Territorial Populations, 1981, 1991, 2001 POPULATION (THOUSANDS) Region Newfoundland Prince Edward Island Nova Scotia New Brunswick Quebec Ontario Manitoba Saskatchewan Alberta British Columbia Yukon Northwest Territories Nunavut Canada 3 -11 1981 568 123 847 696 6 438 8 625 1 026 968 2 238 2 744 23 46 n/a 24 343 1991 568 130 900 724 6 896 10 085 1 092 989 2 546 3 282 28 36 21 27 297 2001 513 135 908 729 7 237 11 410 1 120 979 2 975 3 908 29 37 27 30 007 Source: “Provincial and Territorial Populations, 1981, 1991, 2001” adapted from the Statistics Canada Website http: //geodepot. ca/English/Pgdb/People/Population/demo 05. htm. Reprinted with permission of the Minister of Industry Canada. Copyright © 2003 by Nelson, a division of Thomson Canada Limited.
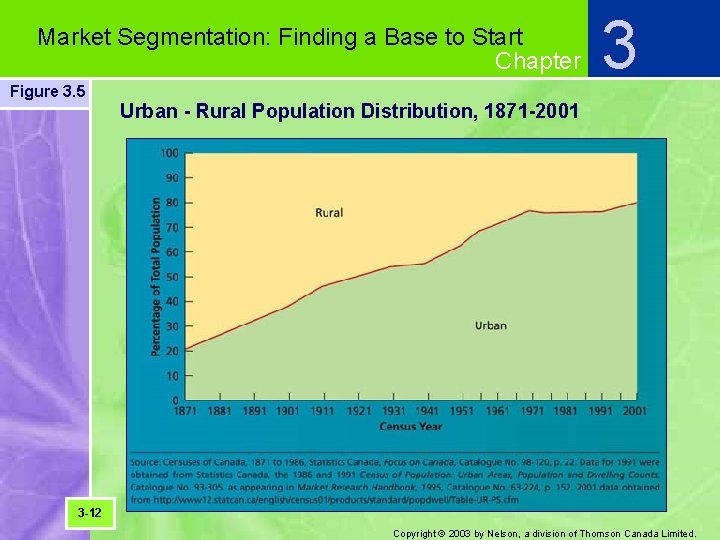
Market Segmentation: Finding a Base to Start Chapter Figure 3. 5 3 Urban - Rural Population Distribution, 1871 -2001 3 -12 Copyright © 2003 by Nelson, a division of Thomson Canada Limited.
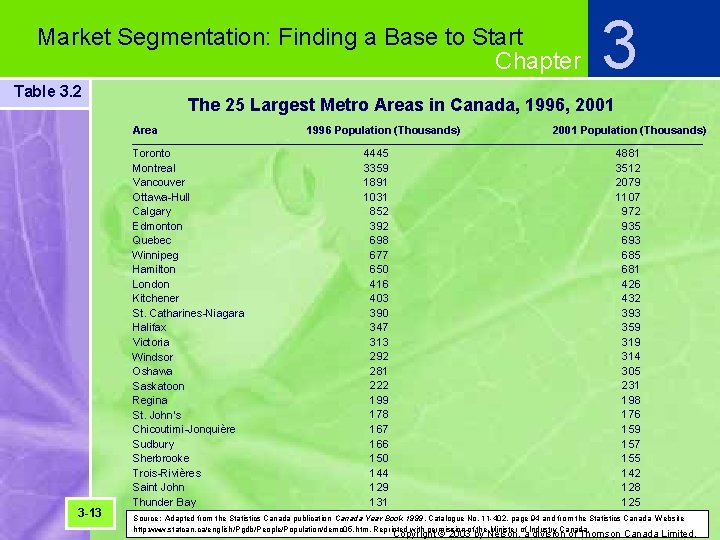
Market Segmentation: Finding a Base to Start Chapter Table 3. 2 The 25 Largest Metro Areas in Canada, 1996, 2001 Area 3 -13 3 Toronto Montreal Vancouver Ottawa-Hull Calgary Edmonton Quebec Winnipeg Hamilton London Kitchener St. Catharines-Niagara Halifax Victoria Windsor Oshawa Saskatoon Regina St. John’s Chicoutimi-Jonquière Sudbury Sherbrooke Trois-Rivières Saint John Thunder Bay 1996 Population (Thousands) 4445 3359 1891 1031 852 392 698 677 650 416 403 390 347 313 292 281 222 199 178 167 166 150 144 129 131 2001 Population (Thousands) 4881 3512 2079 1107 972 935 693 685 681 426 432 393 359 314 305 231 198 176 159 157 155 142 128 125 Source: Adapted from the Statistics Canada publication Canada Year Book 1999 , Catalogue No. 11 -402, page 94 and from the Statistics Canada Website http: www. statcan. ca/english/Pgdb/People/Population/demo 05. htm. Reprinted with permission of the Minister of Industry Canada. Copyright © 2003 by Nelson, a division of Thomson Canada Limited.
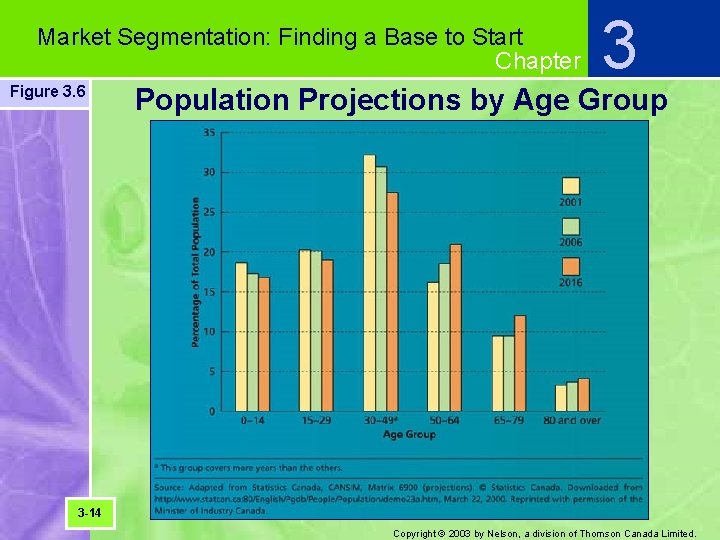
Market Segmentation: Finding a Base to Start Chapter Figure 3. 6 3 Population Projections by Age Group 3 -14 Copyright © 2003 by Nelson, a division of Thomson Canada Limited.
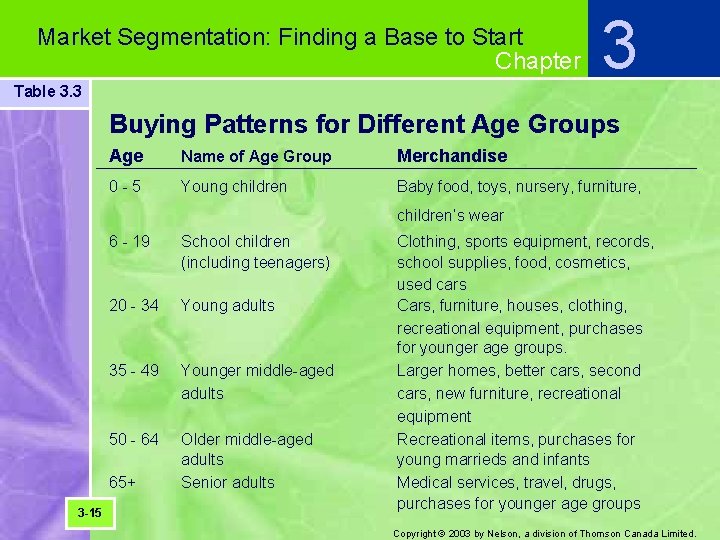
Market Segmentation: Finding a Base to Start Chapter 3 Table 3. 3 Buying Patterns for Different Age Groups Age Name of Age Group Merchandise 0 -5 Young children Baby food, toys, nursery, furniture, children’s wear 6 - 19 School children (including teenagers) 20 - 34 Young adults 35 - 49 Younger middle-aged adults 50 - 64 Older middle-aged adults Senior adults 65+ 3 -15 Clothing, sports equipment, records, school supplies, food, cosmetics, used cars Cars, furniture, houses, clothing, recreational equipment, purchases for younger age groups. Larger homes, better cars, second cars, new furniture, recreational equipment Recreational items, purchases for young marrieds and infants Medical services, travel, drugs, purchases for younger age groups Copyright © 2003 by Nelson, a division of Thomson Canada Limited.
Market Segmentation: Finding a Base to Start Chapter 3 Family Life Cycle • The process of family formation, development, and dissolution. 3 -16 Copyright © 2003 by Nelson, a division of Thomson Canada Limited.
Market Segmentation: Finding a Base to Start Chapter 3 SSWDs • Single, separated, widowed, or divorced people. 3 -17 Copyright © 2003 by Nelson, a division of Thomson Canada Limited.
Market Segmentation: Finding a Base to Start Chapter 3 Engel’s Laws As family income increases 1. a smaller percentage goes for food 2. the percentage spent on housing and household operations and clothing will remain constant, and 3. the percentage spent on other items will increase. 3 -18 Copyright © 2003 by Nelson, a division of Thomson Canada Limited.
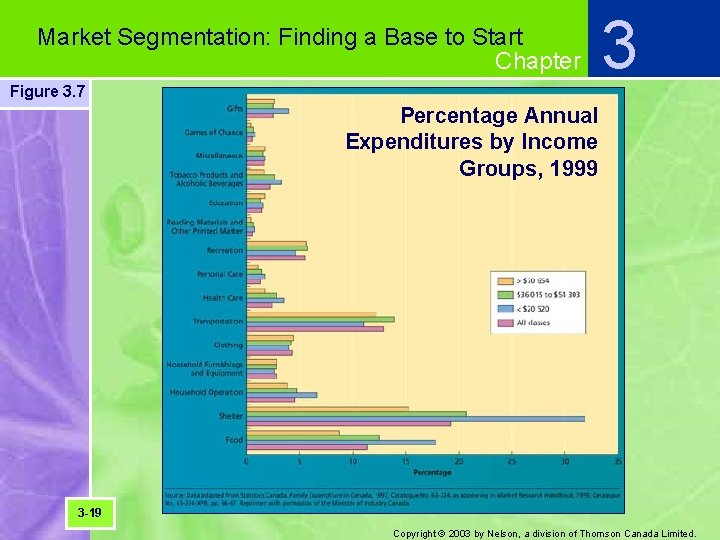
Market Segmentation: Finding a Base to Start Chapter 3 Figure 3. 7 Percentage Annual Expenditures by Income Groups, 1999 3 -19 Copyright © 2003 by Nelson, a division of Thomson Canada Limited.
Market Segmentation: Finding a Base to Start Chapter 3 Lifestyle • The mode of living 3 -20 Copyright © 2003 by Nelson, a division of Thomson Canada Limited.
Market Segmentation: Finding a Base to Start Chapter 3 Psychographics • The use of psychological attributes, lifestyles, attitudes, and demographics in determining the behavioural profiles of different consumers. 3 -21 Copyright © 2003 by Nelson, a division of Thomson Canada Limited.
Market Segmentation: Finding a Base to Start Chapter 3 AIO Statements • Statements about activities, interests, and opinions that are used in developing psychographic profiles. 3 -22 Copyright © 2003 by Nelson, a division of Thomson Canada Limited.
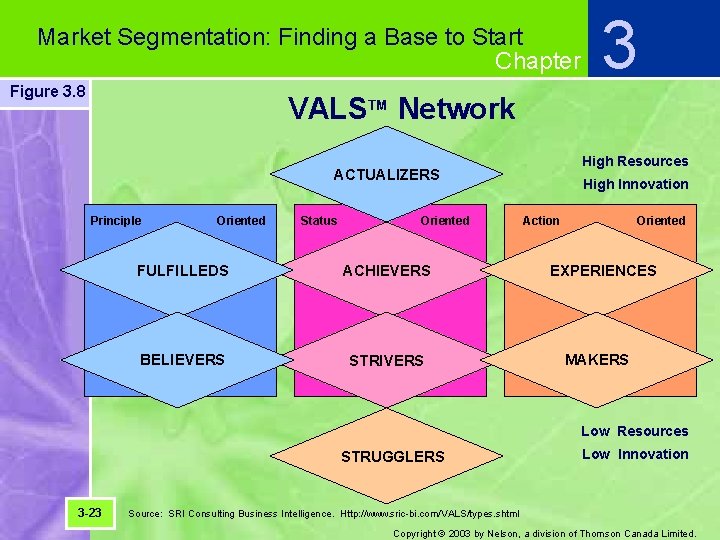
Market Segmentation: Finding a Base to Start Chapter Figure 3. 8 3 VALSTM Network High Resources ACTUALIZERS Principle Oriented Status Oriented FULFILLEDS ACHIEVERS BELIEVERS STRIVERS High Innovation Action Oriented EXPERIENCES MAKERS Low Resources STRUGGLERS 3 -23 Low Innovation Source: SRI Consulting Business Intelligence. Http: //www. sric-bi. com/VALS/types. shtml Copyright © 2003 by Nelson, a division of Thomson Canada Limited.
Market Segmentation: Finding a Base to Start Chapter 3 The Environics Segments • Elders • Boomers • Generation X 3 -24 Copyright © 2003 by Nelson, a division of Thomson Canada Limited.
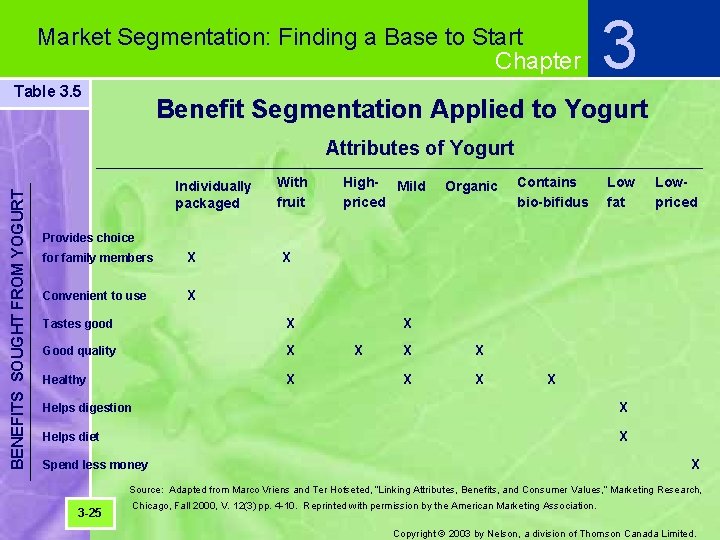
Market Segmentation: Finding a Base to Start Chapter Table 3. 5 3 Benefit Segmentation Applied to Yogurt BENEFITS SOUGHT FROM YOGURT Attributes of Yogurt Individually packaged With fruit High- Mild priced Organic Contains bio-bifidus Low fat Lowpriced Provides choice for family members X Convenient to use X X Tastes good X Good quality X Healthy X X X X Helps digestion X Helps diet X X Spend less money Source: Adapted from Marco Vriens and Ter Hofseted, “Linking Attributes, Benefits, and Consumer Values, ” Marketing Research, 3 -25 Chicago, Fall 2000, V. 12(3) pp. 4 -10. Reprinted with permission by the American Marketing Association. Copyright © 2003 by Nelson, a division of Thomson Canada Limited.
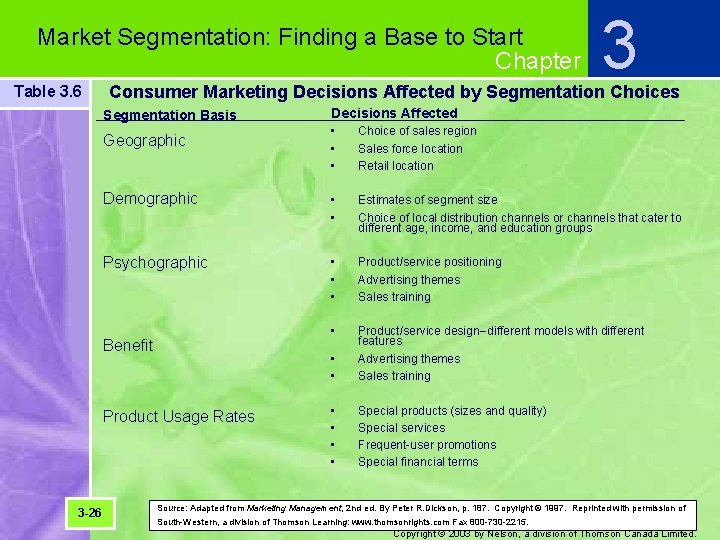
Market Segmentation: Finding a Base to Start Chapter Table 3. 6 Consumer Marketing Decisions Affected by Segmentation Choices Segmentation Basis Decisions Affected • • • Choice of sales region Sales force location Retail location Demographic • • Estimates of segment size Choice of local distribution channels or channels that cater to different age, income, and education groups Psychographic • • • Product/service positioning Advertising themes Sales training • • • Product/service design--different models with different features Advertising themes Sales training • • Special products (sizes and quality) Special services Frequent-user promotions Special financial terms Geographic Benefit Product Usage Rates 3 -26 3 Source: Adapted from Marketing Management, 2 nd ed. By Peter R. Dickson, p. 187. Copyright © 1997. Reprinted with permission of South-Western, a division of Thomson Learning: www. thomsonrights. com Fax 800 -730 -2215. Copyright © 2003 by Nelson, a division of Thomson Canada Limited.
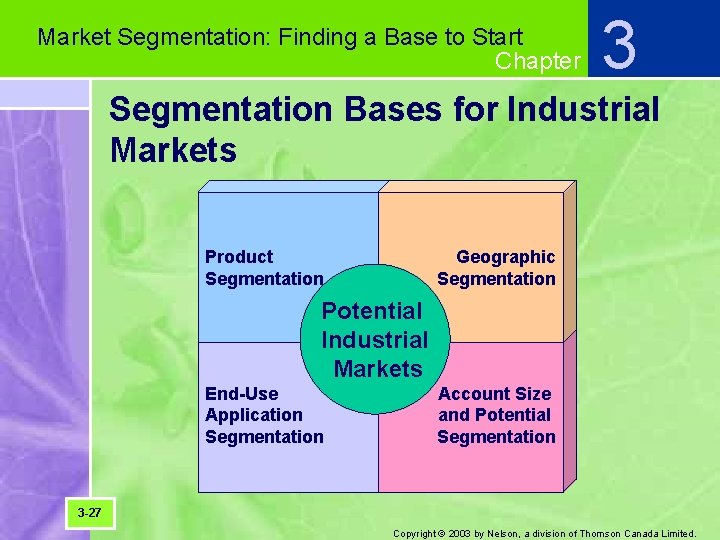
Market Segmentation: Finding a Base to Start Chapter 3 Segmentation Bases for Industrial Markets Product Segmentation Geographic Segmentation Potential Industrial Markets End-Use Application Segmentation Account Size and Potential Segmentation 3 -27 Copyright © 2003 by Nelson, a division of Thomson Canada Limited.
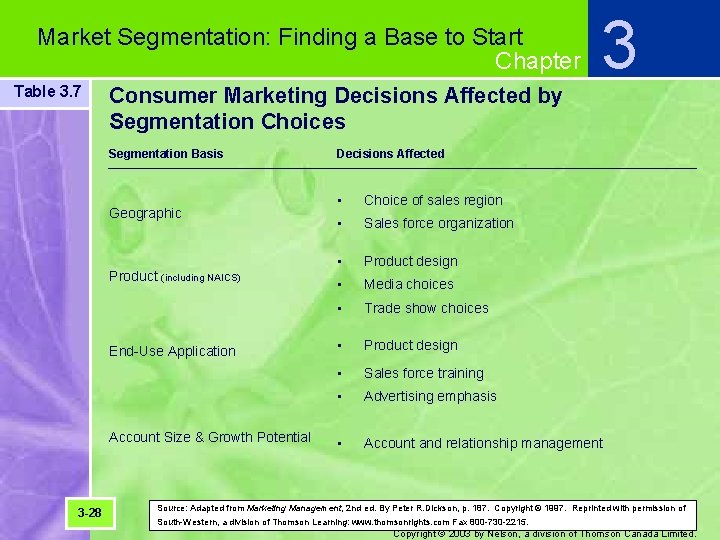
Market Segmentation: Finding a Base to Start Chapter Table 3. 7 Consumer Marketing Decisions Affected by Segmentation Choices Segmentation Basis Geographic Product (including NAICS) End-Use Application Account Size & Growth Potential 3 -28 3 Decisions Affected • Choice of sales region • Sales force organization • Product design • Media choices • Trade show choices • Product design • Sales force training • Advertising emphasis • Account and relationship management Source: Adapted from Marketing Management, 2 nd ed. By Peter R. Dickson, p. 187. Copyright © 1997. Reprinted with permission of South-Western, a division of Thomson Learning: www. thomsonrights. com Fax 800 -730 -2215. Copyright © 2003 by Nelson, a division of Thomson Canada Limited.
Market Segmentation: Finding a Base to Start Chapter 3 North American Classification System (NAICS) • A coding system used to categorize different types of business and products (formerly the Standard Industrial Classification, or SIC) 3 -29 Copyright © 2003 by Nelson, a division of Thomson Canada Limited.
- Slides: 30