
OECD Programme for International Student Assessment Maciej Jakubowski
OECD Programme for International Student Assessment Maciej Jakubowski 10 February 2011 PISA Learning trends 11 Programme for International Student Assessment Learning Trends Changes in student performance since 2000 Maciej Jakubowski Analyst, Indicators and Analysis Division, Directorate for Education, OECD
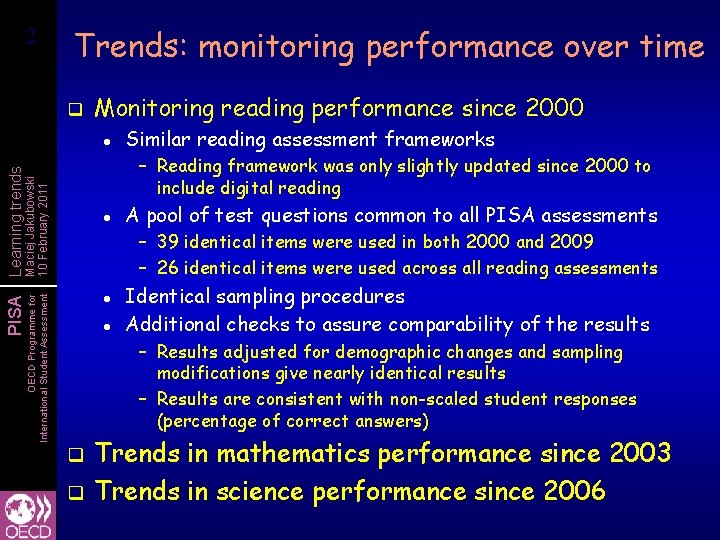
22 Trends: monitoring performance over time q Monitoring reading performance since 2000 Similar reading assessment frameworks – Reading framework was only slightly updated since 2000 to include digital reading Maciej Jakubowski 10 February 2011 PISA Learning trends l l A pool of test questions common to all PISA assessments – 39 identical items were used in both 2000 and 2009 – 26 identical items were used across all reading assessments OECD Programme for International Student Assessment l l Identical sampling procedures Additional checks to assure comparability of the results – Results adjusted for demographic changes and sampling modifications give nearly identical results – Results are consistent with non-scaled student responses (percentage of correct answers) q q Trends in mathematics performance since 2003 Trends in science performance since 2006
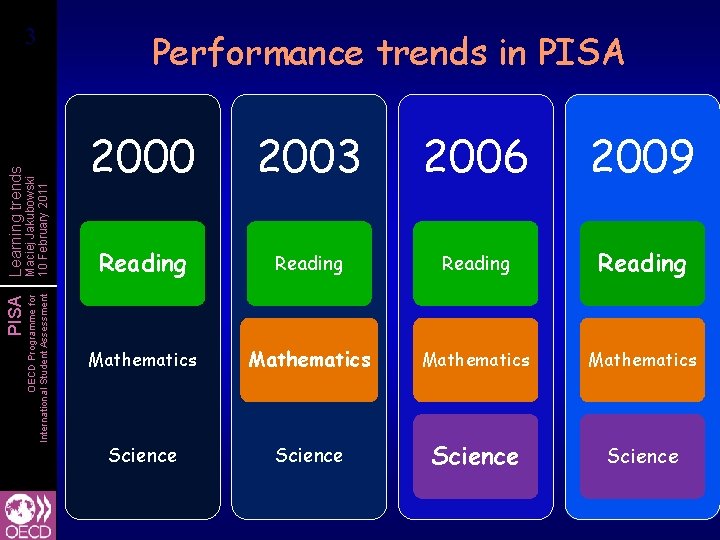
OECD Programme for International Student Assessment Maciej Jakubowski 10 February 2011 PISA Learning trends 33 Performance trends in PISA 2000 2003 2006 2009 Reading Mathematics Science
Maciej Jakubowski 10 February 2011 PISA Learning trends OECD Programme for International Student Assessment 44 How reading performance changed since 2000?
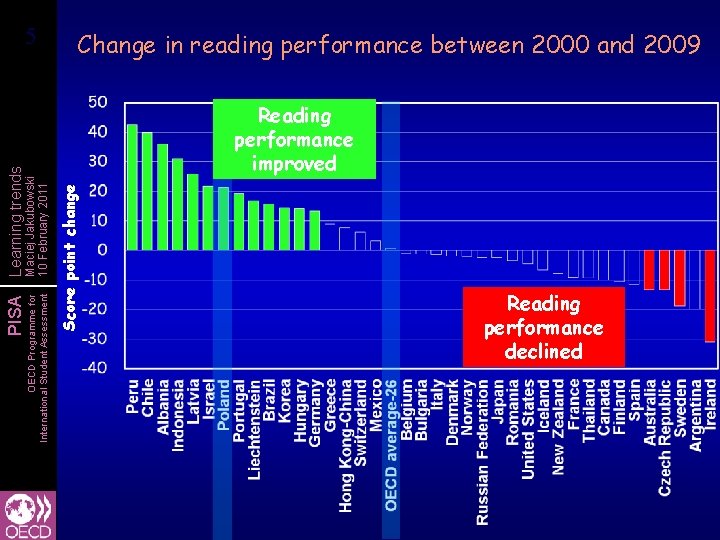
Score point change Maciej Jakubowski 10 February 2011 PISA Learning trends OECD Programme for International Student Assessment 55 Change in reading performance between 2000 and 2009 Reading performance improved Reading performance declined
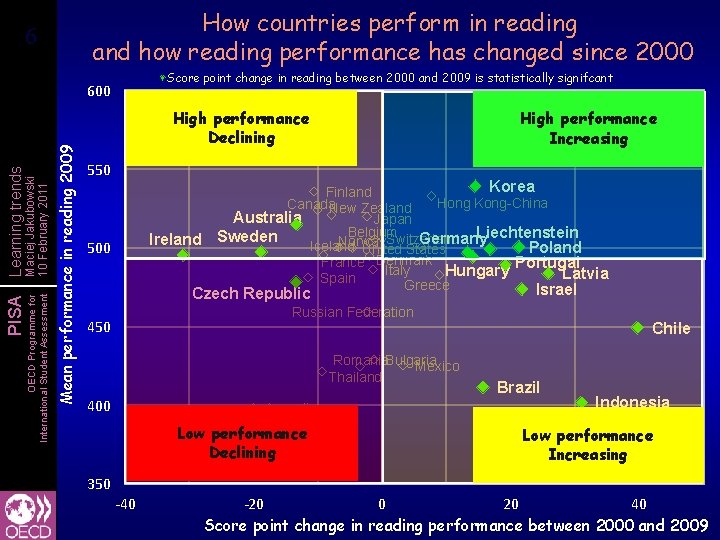
How countries perform in reading and how reading performance has changed since 2000 66 Score point change in reading between 2000 and 2009 is statistically signifcant Mean performance in reading 2009 OECD Programme for International Student Assessment Maciej Jakubowski 10 February 2011 PISA Learning trends 600 High performance Declining 550 Ireland 500 High performance Increasing Korea Finland Hong Kong-China Canada. New Zealand Australia Japan Belgium Liechtenstein Sweden Germany Norway Switzerland Iceland Poland United States France Denmark Portugal Italy Hungary Latvia Spain Greece Israel Czech Republic Russian Federation 450 Romania. Bulgaria Mexico Thailand 400 Argentina Low performance Declining Chile Brazil Indonesia Albania Low performance Peru Increasing 350 -40 -20 0 20 40 Score point change in reading performance between 2000 and 2009
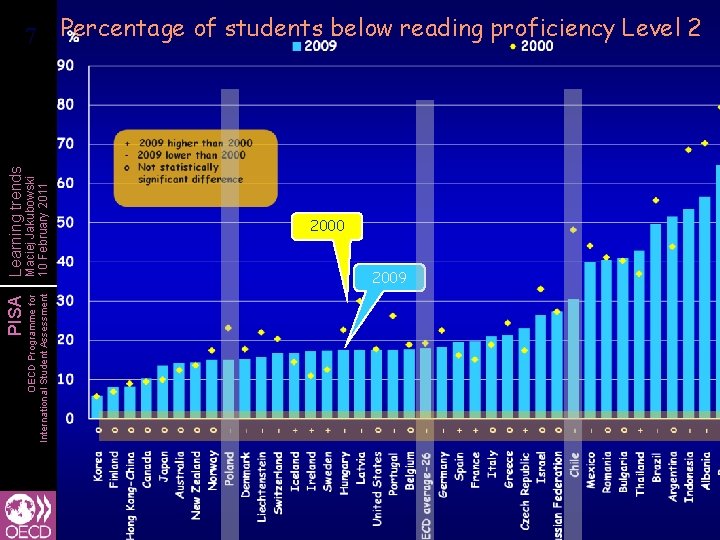
Maciej Jakubowski 10 February 2011 PISA Learning trends OECD Programme for International Student Assessment 77 Percentage of students below reading proficiency Level 2 2000 2009
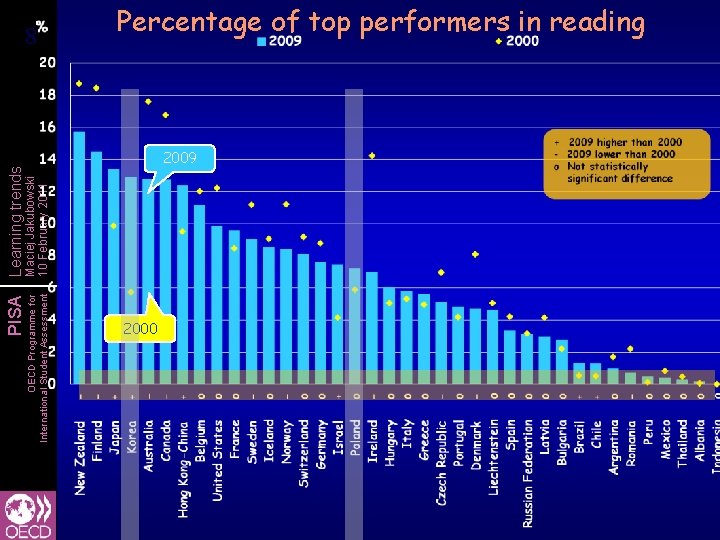
Maciej Jakubowski 10 February 2011 PISA Learning trends OECD Programme for International Student Assessment 88 Percentage of top performers in reading 2009 2000
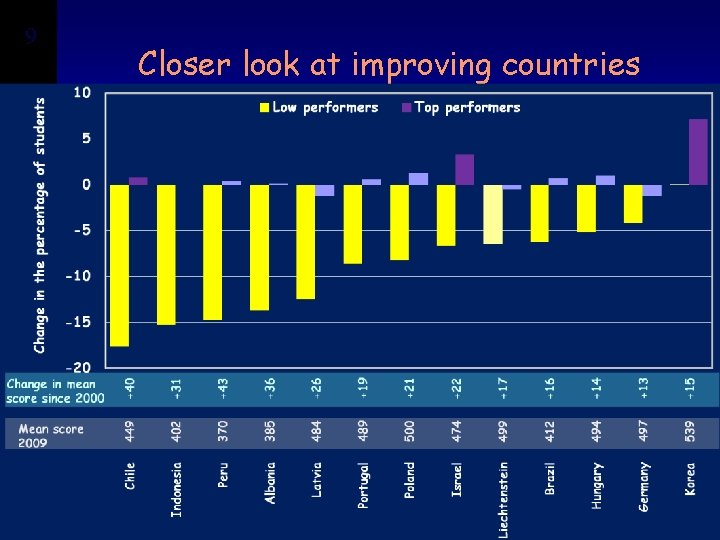
Maciej Jakubowski 10 February 2011 PISA Learning trends OECD Programme for International Student Assessment 99 Closer look at improving countries
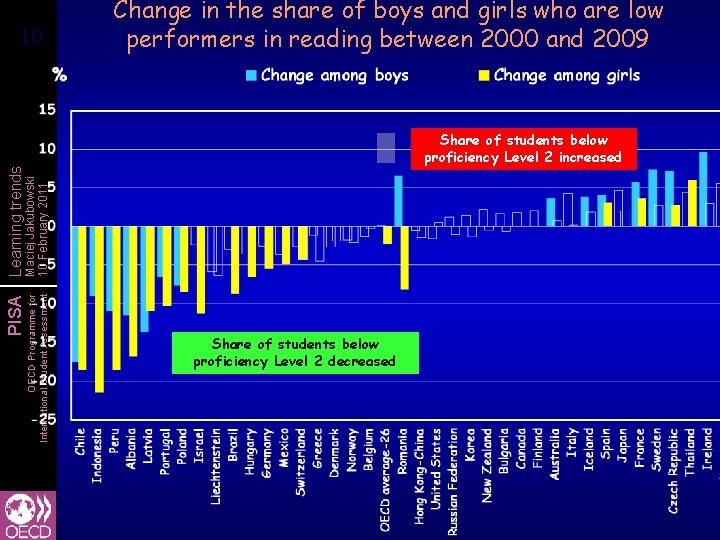
Share of students below proficiency Level 2 increased OECD Programme for International Student Assessment Maciej Jakubowski 10 February 2011 PISA Learning trends 10 10 Change in the share of boys and girls who are low performers in reading between 2000 and 2009 Share of students below proficiency Level 2 decreased
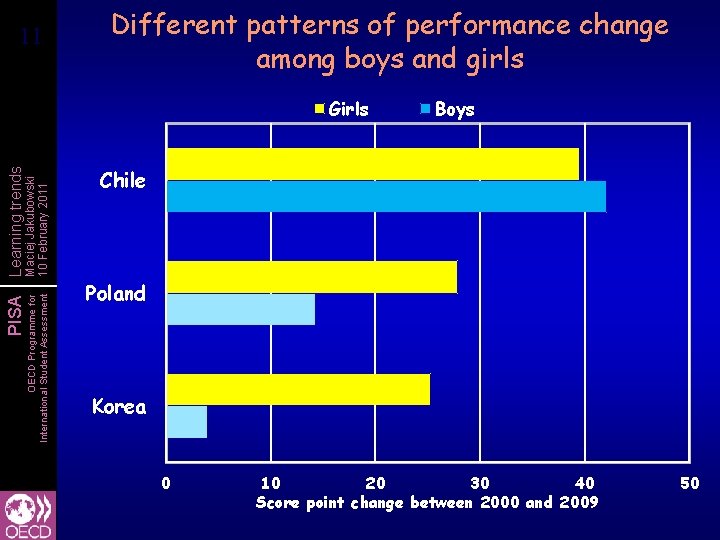
11 11 Different patterns of performance change among boys and girls OECD Programme for International Student Assessment Maciej Jakubowski 10 February 2011 PISA Learning trends Girls Boys Chile Poland Korea 0 10 20 30 40 Score point change between 2000 and 2009 50
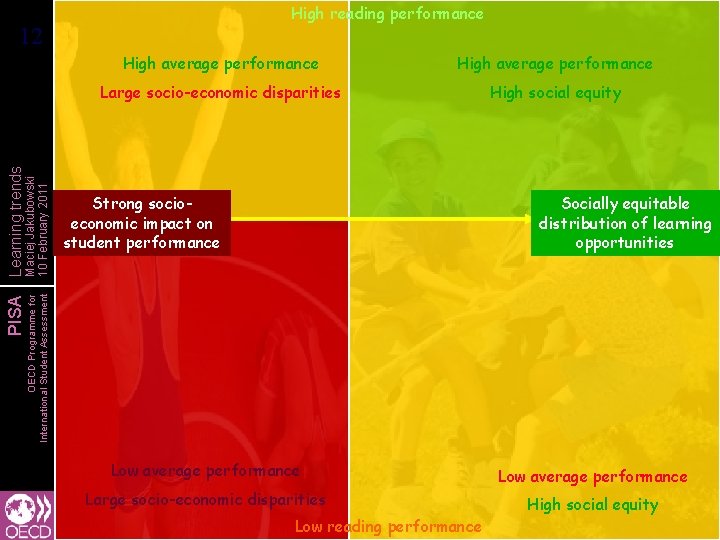
High reading performance High average performance Large socio-economic disparities High social equity Strong socioeconomic impact on student performance Socially equitable distribution of learning opportunities OECD Programme for International Student Assessment Maciej Jakubowski 10 February 2011 PISA Learning trends 12 12 Low average performance Large socio-economic disparities High social equity Low reading performance
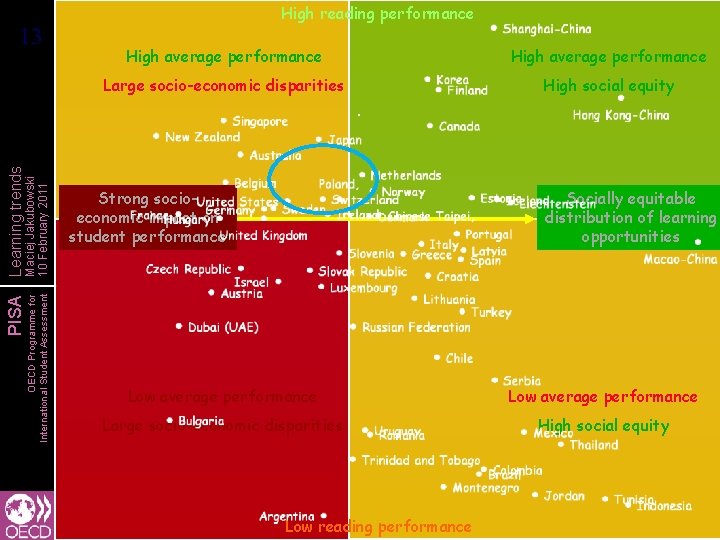
13 13 High reading performance High average performance Large socio-economic disparities High social equity OECD Programme for International Student Assessment Maciej Jakubowski 10 February 2011 PISA Learning trends . Strong socioeconomic impact on student performance Socially equitable distribution of learning opportunities Low average performance Large socio-economic disparities High social equity Low reading performance
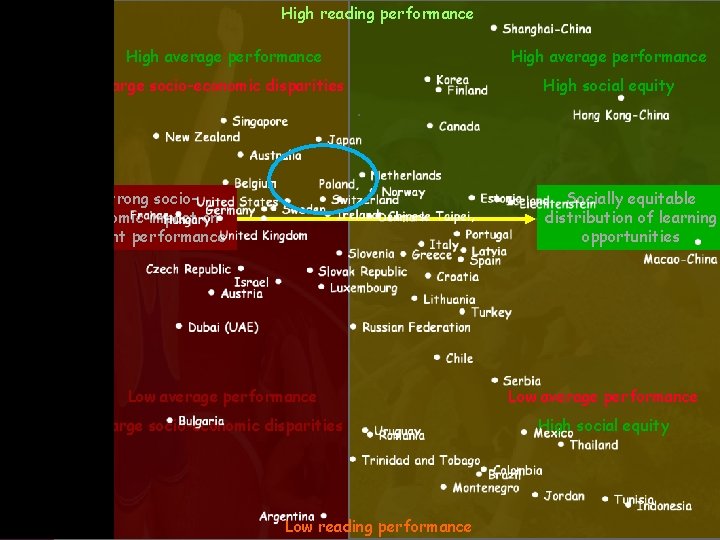
14 14 High reading performance High average performance Large socio-economic disparities High social equity OECD Programme for International Student Assessment Maciej Jakubowski 10 February 2011 PISA Learning trends . Strong socioeconomic impact on student performance Socially equitable distribution of learning opportunities Low average performance Large socio-economic disparities High social equity Low reading performance
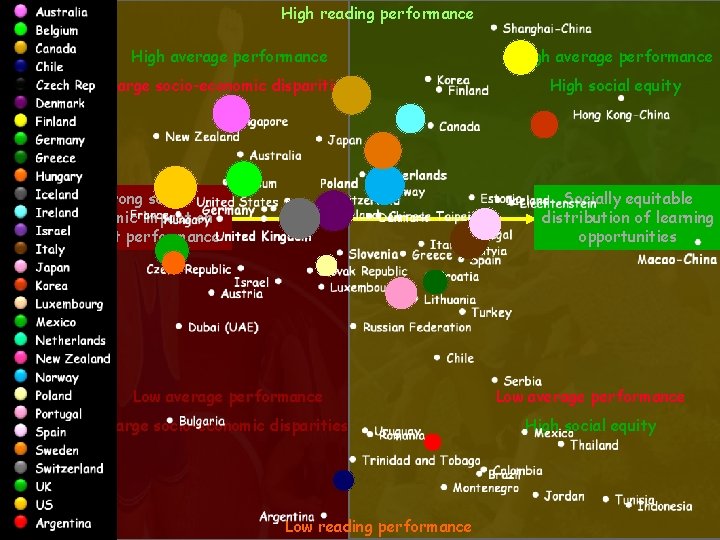
OECD Programme for International Student Assessment Maciej Jakubowski 10 February 2011 PISA Learning trends 15 15 High reading performance High average performance Large socio-economic disparities High social equity Strong socioeconomic impact on student performance Socially equitable distribution of learning opportunities Low average performance Large socio-economic disparities High social equity Low reading performance
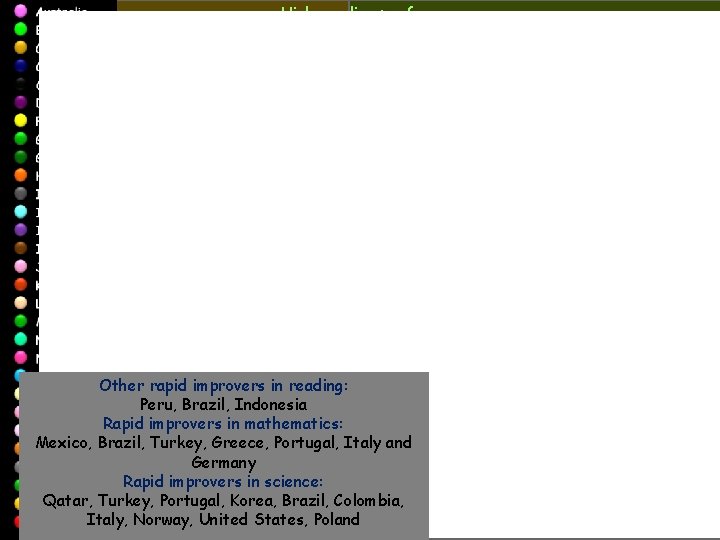
OECD Programme for International Student Assessment Maciej Jakubowski 10 February 2011 PISA Learning trends 16 16 High reading performance High average performance Large socio-economic disparities High social equity Strong socioeconomic impact on student performance Other rapid improvers in reading: Low average Peru, Brazil, performance Indonesia Rapid in mathematics: Largeimprovers socio-economic disparities Mexico, Brazil, Turkey, Greece, Portugal, Italy and Germany Rapid improvers in science: Qatar, Turkey, Portugal, Korea, Brazil, Colombia, Italy, Norway, United States, Low Poland reading performance Socially equitable distribution of learning opportunities Low average performance High social equity

Maciej Jakubowski 10 February 2011 PISA Learning trends OECD Programme for International Student Assessment 17 17 How mathematics performance changed since 2003?
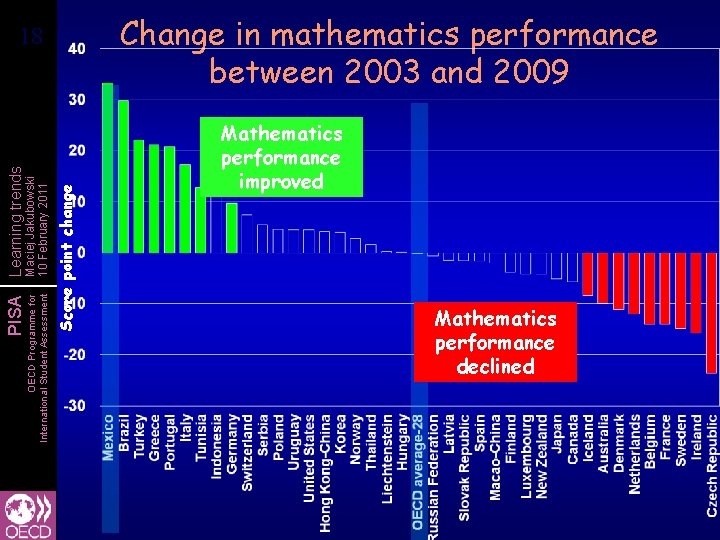
Score point change Maciej Jakubowski 10 February 2011 PISA Learning trends OECD Programme for International Student Assessment 18 18 Change in mathematics performance between 2003 and 2009 Mathematics performance improved Mathematics performance declined
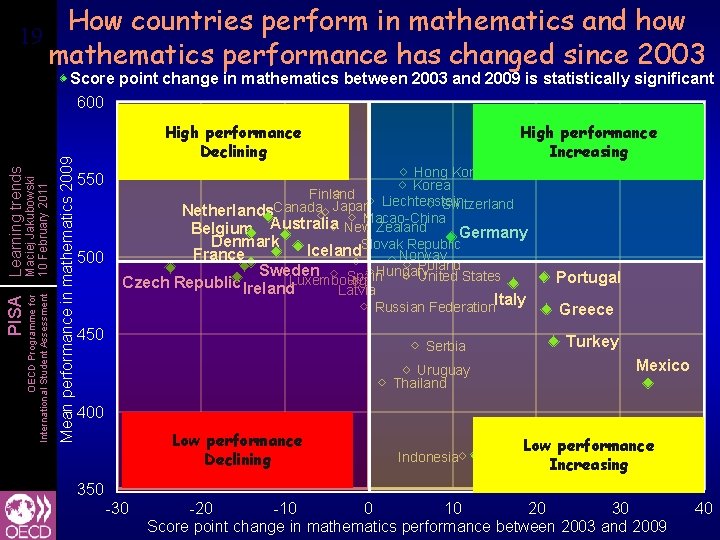
How countries perform in mathematics and how mathematics performance has changed since 2003 19 19 Mean performance in mathematics 2009 OECD Programme for International Student Assessment Maciej Jakubowski 10 February 2011 PISA Learning trends Score point change in mathematics between 2003 and 2009 is statistically significant 600 High performance Declining 550 500 High performance Increasing Hong Kong-China Korea Finland Switzerland Japan Liechtenstein Canada Netherlands Macao-China Belgium Australia New Zealand Germany Denmark Slovak Republic Iceland France Norway Poland Sweden Hungary Spain United States Czech Republic Ireland. Luxembourg Latvia Italy Russian Federation 450 Serbia Uruguay Thailand Portugal Greece Turkey Mexico 400 Low performance Declining Indonesia Brazil Low performance Tunisia Increasing 350 -30 -20 -10 0 10 20 30 Score point change in mathematics performance between 2003 and 2009 40
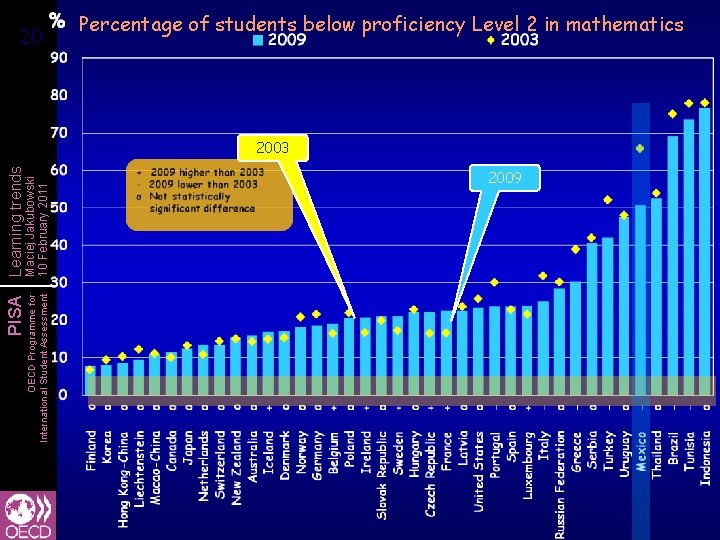
Maciej Jakubowski 10 February 2011 PISA Learning trends OECD Programme for International Student Assessment 20 20 Percentage of students below proficiency Level 2 in mathematics 2003 2009
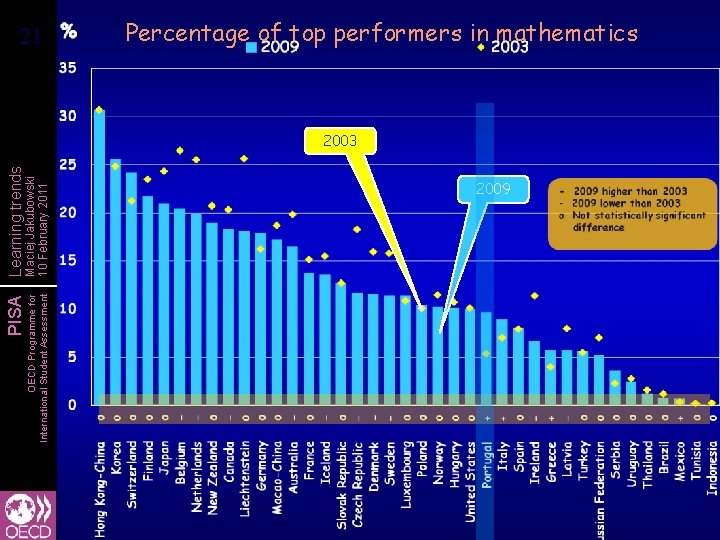
Maciej Jakubowski 10 February 2011 PISA Learning trends OECD Programme for International Student Assessment 21 21 Percentage of top performers in mathematics 2003 2009

Maciej Jakubowski 10 February 2011 PISA Learning trends OECD Programme for International Student Assessment 22 22 How science performance changed since 2006?
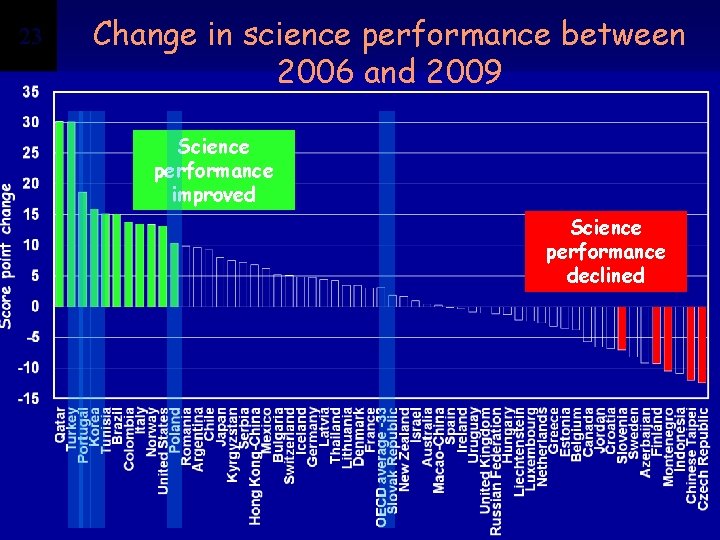
OECD Programme for International Student Assessment Maciej Jakubowski 10 February 2011 PISA Learning trends 23 23 Change in science performance between 2006 and 2009 Science performance improved Science performance declined
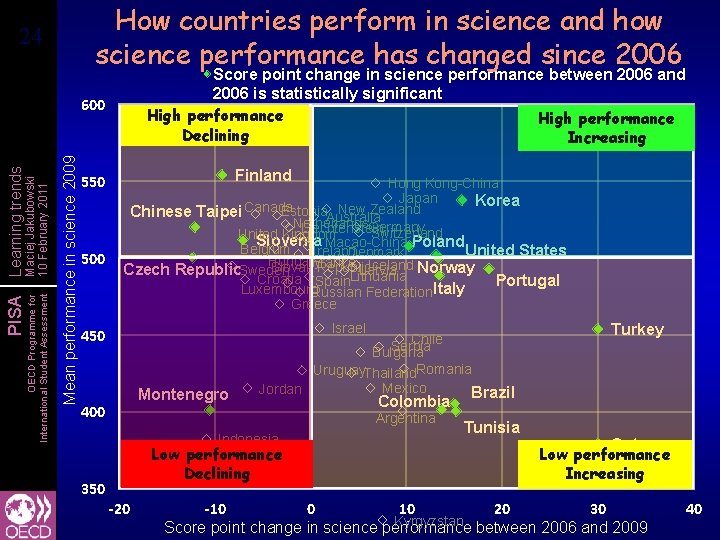
How countries perform in science and how science performance has changed since 2006 24 24 Score point change in science performance between 2006 and 2006 is statistically significant High performance Declining Increasing Mean performance in science 2009 OECD Programme for International Student Assessment Maciej Jakubowski 10 February 2011 PISA Learning trends 600 550 500 Finland Hong Kong-China Japan Korea Canada New Zealand Estonia. Australia Chinese Taipei Netherlands Germany Liechtenstein Switzerland United Kingdom Slovenia Macao-China Poland Belgium Ireland United States Denmark Hungary France Iceland Norway Slovak Republic Czech Republic. Sweden Latvia Lithuania Croatia Spain Portugal Luxembourg Russian Federation Italy Greece Israel 450 Montenegro 400 Chile Serbia Bulgaria Uruguay. Thailand. Romania Mexico Jordan Brazil Colombia Argentina Indonesia Azerbaijan Low performance Declining 350 -20 Turkey Tunisia Qatar Low performance Increasing -10 0 10 20 30 Kyrgyzstan Score point change in science performance between 2006 and 2009 40
Maciej Jakubowski 10 February 2011 PISA Learning trends OECD Programme for International Student Assessment Percentage of students below proficiency Level 2 in science 25 25 2006 2009
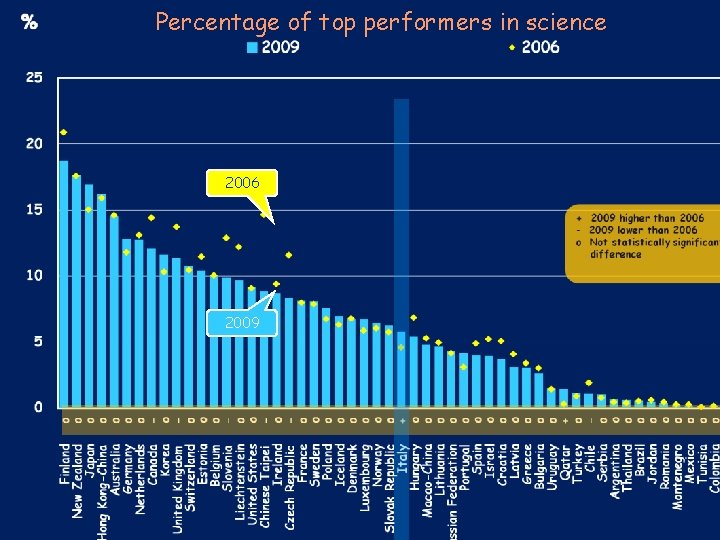
Maciej Jakubowski 10 February 2011 PISA Learning trends OECD Programme for International Student Assessment 26 26 Percentage of top performers in science 2006 2009
Maciej Jakubowski 10 February 2011 PISA Learning trends OECD Programme for International Student Assessment 27 27 Quality differences between schools
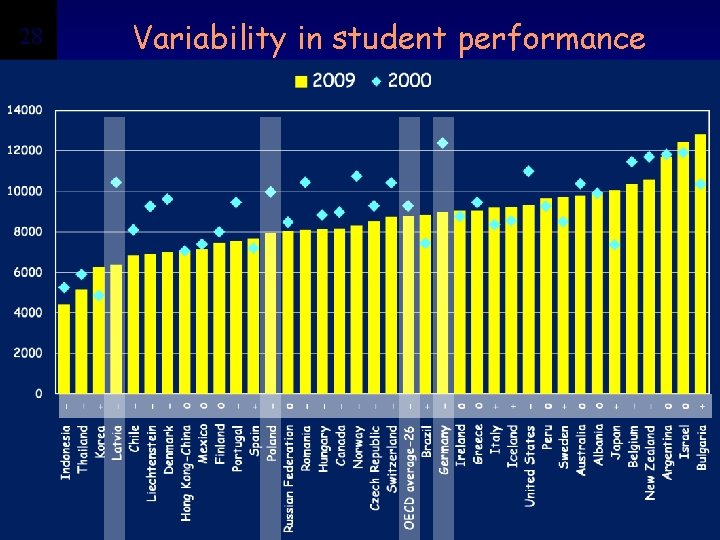
Maciej Jakubowski 10 February 2011 PISA Learning trends OECD Programme for International Student Assessment 28 28 Variability in student performance
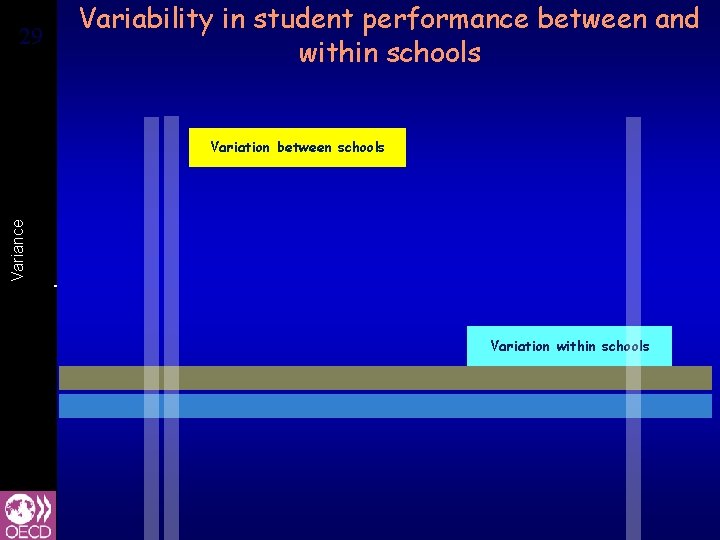
29 29 Variability in student performance between and within schools OECD Programme for International Student Assessment Maciej Jakubowski 10 February 2011 PISA Variance Learning trends Variation between schools Variation within schools

Maciej Jakubowski 10 February 2011 PISA Learning trends OECD Programme for International Student Assessment 30 30 Student engagement with school
Maciej Jakubowski 10 February 2011 PISA Learning trends OECD Programme for International Student Assessment 31 31 Students' views of teacher-student relations

OECD Programme for International Student Assessment Maciej Jakubowski 10 February 2011 PISA Learning trends 32 32 Students’ view of climate for learning The following things happen never, rarely or only in some lessons…

OECD Programme for International Student Assessment Maciej Jakubowski 10 February 2011 PISA Learning trends 33 33 More on trends in PISA: l Volume V, Learning Trends: Changes in student Performance since 2000 Thank you ! Find out more about PISA at… l OECD www. pisa. oecd. org l Email: Maciej. Jakubowski@OECD. org
- Slides: 33