OECD countries allocate about 9 of their GDP


OECD countries allocate about 9% of their GDP to health. This share varies from 16% in the United States to less than 6% in Mexico and Turkey % GDP 1. Public and private expenditures are current expenditures (excluding investments). 2. Current health expenditure. . 3. Health expenditure is for the insured population rather than resident population. Source: OECD Health Data 2009, OECD (http: //www. oecd. org/healthdata). 2

The number of physicians per capita has increased in all OECD countries since 1990, except in Italy 2007 (or latest year available) 1990 -2007 (or nearest year) 1. Ireland, the Netherlands, New Zealand Portugal provide the number of all physicians entitled to practise rather than only those practising. 2. Data for Spain include dentists and stomatologists. Source: OECD Health Data 2009, OECD (http: //www. oecd. org/healthdata).

Across OECD countries, health expenditure has grown by slightly more than 4% annually over the past ten years Annual average real growth in per capita health expenditure, 1997 -2007 Source: OECD Health Data 2009, OECD (http: //www. oecd. org/healthdata).

Distribution of health expenditure for the US population, by magnitude of expenditure, 1999 expenditure threshold (2004 US$) 1% 5% 10% 27% 50% $27, 914 $7, 995 55% $4, 115 69% $351 97% Source: Monheit 2003 and Berk and Monheit 2001

The well-known 20/80 distribution – actually the 5/50 or 10/70 problem - Germany 2011 How can we predict who these 5 or 10% are? % of population % of expenditure

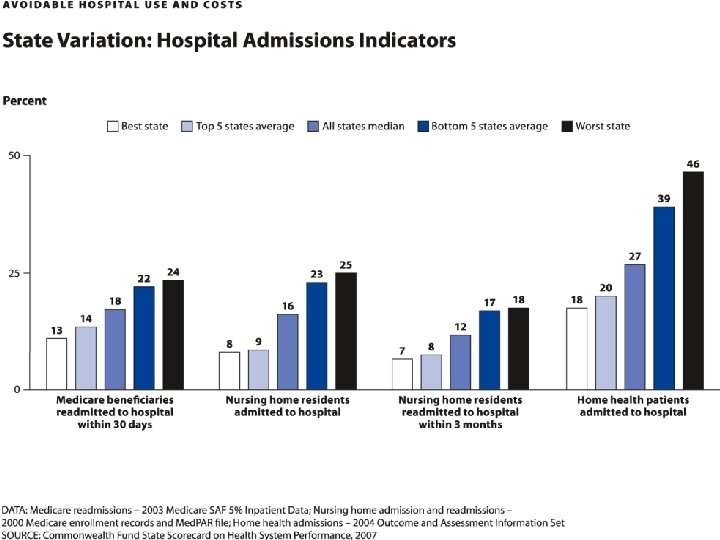
Treatment for chronic diseases is not optimal. Too many persons are admitted to hospitals for asthma … Asthma admission rates, population aged 15 and over, 2007 1. Does not fully exclude day cases. 2. Includes transfers from other hospital units, which marginally elevates rates. Source: OECD Health Care Quality Indicators Data 2009 (OECD).

… too many persons are admitted to hospitals for diabetes complications, highlighting the need to improve primary care Diabetes acute complications admission rates, population aged 15 and over, 2007 1. Does not fully exclude day cases. 2. Includes transfers from other hospital units, which marginally elevates rates. Source: OECD Health Care Quality Indicators Data 2009 (OECD).

In-Hospital Mortality After Admission for Acute Myocardial Infarction* per 100 Patients, 2009 Note: In-hospital case-fatality rates within 30 days of admission. Age-sex standardized rates. * 2008. ** 2007. Source: OECD Health Care Data 2012. 9 THE COMMONWEALTH FUND

Foreign Object Left in Body During Procedure per 100, 000 Hospital Discharges, 2009 Note: Age-sex-SDX standardized rates. * 2008. Source: OECD Health Care Data 2012. 10 THE COMMONWEALTH FUND

11 Post-Operative Sepsis per 100, 000 Hospital Discharges, 2009 Note: Age-sex-SDX standardized rates. * 2008. Source: OECD Health Care Data 2012. THE COMMONWEALTH FUND
 by Level of Co. Morbidity, British")
Expected Resource Use (Relative to Adult Population Average) by Level of Co. Morbidity, British Columbia, 1997 -98 Acute conditions only Chronic condition High impact chronic condition None 0. 1 Low 0. 4 Medium 1. 2 High 3. 3 Very High 9. 5 0. 2 0. 5 1. 3 3. 5 3. 6 9. 8 9. 9 Thus, it is co-morbidity, rather than presence or impact of chronic conditions, that generates resource use. Source: Broemeling et al. Chronic Conditions and Co-morbidity among Residents of British Columbia. Vancouver, BC: University of British Columbia, 2005.

Primary Care Strength and Premature Mortality in 18 OECD Countries 10000 PYLL Low PC Countries* 5000 High PC Countries* 0 1970 1980 Year 1990 2000 *Predicted PYLL (both genders) estimated by fixed effects, using pooled cross-sectional time series design. Analysis controlled for GDP, percent elderly, doctors/capita, average income (ppp), alcohol and tobacco use. R 2(within)=0. 77. Starfield 11/06 Source: Macinko et al, Health Serv Res 2003; 38: 831 -65. IC 3496 n
 with Changes in Survival and Spending,")
Average Number of Physicians per AMI Patient (Quartiles) with Changes in Survival and Spending, 1968 -2002 Spending rise Source: Skinner et al, Health Aff 2006; W 6: W 34 -W 47.

Practical uses – DARTS diabetic study… Mortality Post Myocardial Infarction 100 % alive 90 No Diabetes 80 Diabetes 70 60 50 40 0 1 2 3 4 Years Post MI Diabet Med 2002; 19, 448 -55

Some are very proud of their quality certificate: Foto: J. Szecsenyi, 2005

But does it really reflect reality? Foto: J. Szecsenyi, 2005
- Slides: 21