OCN 331 MARE 360 Goals Qualitative Quantitative Reading


")


 Trans Fats HDL,")


 Seafood Docosahexaenoic acid (DHA) Seafood Alpha-linolenic")


 Province")
 Small tuna, salmon,")
 large demersal fish (0. 4)")
 pelagic fish (9. 3) 6. 8 ciliates (2. 6) 2.")

 4. 65 small tuna,")


- Slides: 44
OCN 331 / MARE 360 • Goals: Qualitative & Quantitative • Reading Materials—On-Line • Lectures & Discussions – Rec read chapters & bring Pwr. Pt to class • UH-H Visits • Examinations/Grades
Hugo Grotius Mare Liberum 1609 • • • Whales Norwegian herring Japanese sardine Peruvian anchovy Can. N. Atlantic cod • • Technology Capital Investment Fisheries Information Politics Social Issues Tragedy of commons Population
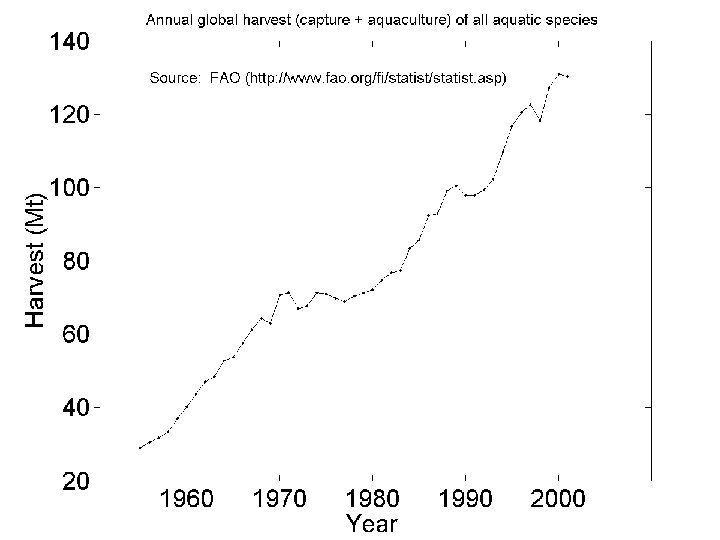
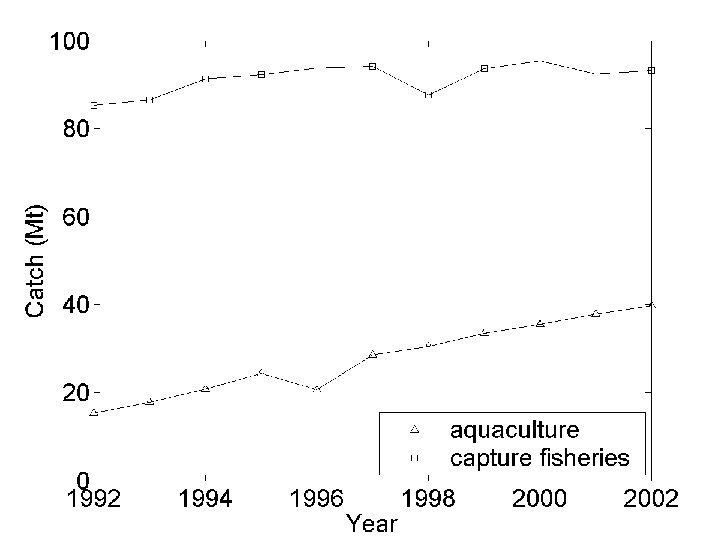
Total Global Fisheries Harvest ~160 Mt • • • Year 2002 2003 2004 2005 2006 CAP 94. 5 91. 8 96 95. 5 93. 1 AQ 52 55. 2 60 63. 3 66. 7 • Capture Fisheries are constant at ~90 -95 Mt • Aquaculture is steadily increasing
Table 1. 1 Disposition of the total aquatic catch for 2002 Use % of total catch by weight Human consumption 75. 8 Fresh 39. 7 Frozen 20. 0 Cured 7. 3 Canned 8. 7 Reduction 19. 0 miscellaneous 5. 3
Why Do We Care? • Calories • High Quality Protein • Essential Amino Acids • Essential Fatty Acids (w 3’s, w 6’s)
Health Benefits Associated with Fish Consumption and Levels of Supporting Evidence Disease or health condition Strong evidence of significant health benefits Coronary heart disease High blood pressure Irregular heart beat (arrhythmia) Diabetes Rheumatoid arthritis Promising preliminary results Asthma Bowel cancer Crohn’s disease Neural development 8
Seafood – Nutritional Benefits • • • High quality protein High in omega-3 fatty acids Low in saturated fat Contributes to a healthy heart Contributes to proper growth and development of children • Source of vitamins and minerals 9
Table 1. 2 Percentage of persons whose diets are calorie deficient and average caloric supplies as a percent of minimum requirements. Region % of population with caloriedeficient diets Average caloric supplies as % of minimum requirement Asia and Far East 84 -92 94 Middle East 66 -71 96 Africa 75 -84 90 Latin America 52 -57 104
Table 1. 3 Utilization efficiencies of protein from various food stuffs. Source: FAO (1970) Food Efficiency (%) Amino acids that limit utilization efficiency 1 poor adequate DAIRY eggs 94 trp, lys, met, cys cow’s milk 82 trp, lys cottage cheese 74 lys swiss cheese 72 lys
MEATS fish 83 lys turkey 73 lys pork 67 lys beef 67 lys chicken 64 lys lamb 64 lys
VEGETABLES corn 73 trp, lys asparagus 72 met, cys broccoli 60 met, cys cauliflower 60 met, cys trp, lys potato 60 met, cys trp kale 53 lys, met, cys green peas 51 met, cys lys
cereals and grains brown rice 68 lys wheat germ 67 trp oatmeal 66 lys wheat grain 59 lys rye 57 trp, thr trp polished rice 57 lys, thr trp millet 55 lys trp, met, cys pasta 48 lys, met, cys lys
legumes soybeans 60 met, cys, val lys, trp lima beans 50 met, cys trp, lys kidney beans 37 trp, met, cys lentils 30 trp, met, cys lys sunflower seeds 57 lys trp sesame seeds 52 lys trp, met, cys peanuts 43 lys, met, cys, thr Nuts and seeds
Seafood – Nutritional Benefits • • • High quality protein High in omega-3 fatty acids Low in saturated fat Contributes to a healthy heart Contributes to proper growth and development of children • Source of vitamins and minerals 16
High Quality Protein • Protein needed for growth and maintenance • Seafood contains all 9 essential amino acids • Protein is highly digestible • Fish contain 16 -27 grams of protein 17
Table 1. 4 World production of fats and oils and the -3 and -6 PFA content of those oils. Weight percent of total lipids Production (Mt y-1) -3 -6 fish 1. 02 13 -35 1 -4 Linseed 0. 96 26 -58 5 -23 Soybean 14. 57 2 -10 49 -52 Rape seeds 3. 54 1 -10 10 -22 Sunflower 5. 43 44 -68 Cottonseed 3. 29 50 Peanut 3. 49 13 -34 Olive 1. 37 4 -15 coconut 3. 28 1 -3 palm 4. 30 6 -12 butter 5. 10 3 lard 3. 80 4 -9 tallow 5. 87 1 -3 Source of oil
Fat Facts • • • Nutritional Importance Saturated Polyunsaturated fats (PUFA’s) Trans Fats HDL, LDL, Cholesterol Health Issues
O 9 1 HO 6 9 3 12 15 ω 1 18 α Alpha-Linolenic Acid O HO 6 1 5 8 11 α Arachidonic Acid 14 ω 1
Major Sources of Trans Fats for U. S. Adults • • Cakes, cookies etc. Animal Products Margarine Fried Potatoes Chips etc. Salad dressing Cereals Candy • • 40% 21% 17% 8% 5% 3% 1% 1%
Omega-3 Fatty Acids Three types: Eicosapentaenoic acid (EPA) Seafood Docosahexaenoic acid (DHA) Seafood Alpha-linolenic acid (ALA) Flaxseed, wheat germ, dark leafy greens 22
EPA & DHA Content of Fish • • • Cod Flounder Mackerel Pollock Salmon, farmed Shrimp Trout Tuna, bluefin Tuna, canned • • • 0. 13 0. 43 1. 57 0. 46 1. 83 0. 27 0. 80 1. 28 0. 73
ω3 Fatty Acids & Heart Health JJ - CA – JA males Fish Consumption 3 oz/d vs ~2 x/wk w 3 intake ~7 X • • • Similar TFA levels ω3: JJ = 2 X higher CAD: CA=JA >JJ IMT incr. as w 3 decr. CAC incr. as w 3 decr. • ω3: JJ = 2 X higher !
Proper Growth and Development of Children • Omega-3 s and pregnancy – During last trimester of pregnancy • Rapid synthesis of brain tissue • Omega-3 s and premature infants – Risk factor for preterm delivery and low birth weight • Omega-3 s and the newborn – DHA is influenced by the mother’s diet 25
ω3 Fatty Acids & Fetus Health • “Fish is Brainfood” • EPA & DHA (from week 20) • Important for Infants’ – Nerve, Visual, Immune system development – DHA Supplements Breast Milk & Formulas Important for Infants’ Intellect -IQ-fish consumption correlation
How the Oceans Make Fish • Primary Production Commercial Fish • 3 Types of Ocean Areas – Open Ocean – Coastal Areas – Upwelling Areas
Sea surface herbivores Winter mixed layer grazing phytoplankton carnivores Excretion, death, and sinking Permanent pycnocline dissolved nutrients Upwelling and turbulent diffusion Nutrients in detritus regeneration dissolved nutrients
Table 1. 5 Estimates of marine primary production from Martin et al. (1987) Province % of ocean Area (1012 m 2) Mean Global % of production primary (g. C m-2 y-1) (Pg C y-1) production Open ocean 90. 0 326 130 42. 38 82 Coastal zone 9. 9 36 250 9. 00 18 upwelling 0. 1 0. 36 420 0. 15 0. 4 total 100 362 142 51. 53 100
Trophic level 7 6 5 Large tuna, sharks, billfish (0. 51) Small tuna, salmon, squid (3. 39) Chaetognaths, micronekton (22. 6) Mesopelagic vertical migrators (45. 2) 113 4 226 Crustacean zooplankton (339) 3 2 1 Ciliates (1, 695) Flagellates (8, 476) Algal picoplankton and nanoplankton (42, 380)
natural mortality and fishing 16. 3 invertebrate carnivores (61) large demersal fish (0. 4) 8 16. 3 pelagic fish (32. 6) 102 2 demersal fish (10) 29 306 macrobenthos (49) crustacean zooplankton (408) 20 epifauna (4) 408 ciliates (240) 225 1, 800 bacteria (322) flagellates (1, 200) 6, 000 phytoplankton (9, 000) 1, 200 97 meiobenthos (19)
invertebrate carnivores (1. 4) pelagic fish (9. 3) 6. 8 ciliates (2. 6) 2. 3 crustacean zooplankton (9. 1) 42. 75 flagellates (12. 9) 64. 5 phytoplankton (150) 42. 75 natural mortality and fishing
Table 1. 6 Estimates of annual production of commercially useful fish based on the models in Figs. 1. 10 -1. 12. The ratio of fresh weight to carbon in the fish is assumed to be 10. Carbon (Mt) Fresh weight (Mt) 3. 9 39 Pelagic 32. 6 326 Demersal 10. 4 104 Upwelling 9. 3 93 Open ocean Coastal zone
0. 9 6. 21 large tuna, sharks, billfish (0. 7) 4. 65 small tuna, salmon, squid (4. 65) 31 31 chaetognaths, micronekton (31) mesopelagic vertical migrators (63) 157 DOC (32, 776) 470 313 crustacean zooplankton (470) 2, 351 11, 754 ciliates (2, 351) 11, 754 flagellates (11, 754) bacteria (16, 388) 42, 380 18, 163 algal picoplankton and nanoplankton (60, 543)
Open Ocean Area • • • Deep Low inputs Mostly Regen. Nutrs. Stable Temporally Nutrient Limited • Small Phytoplankton • Long Food Chains • Low Comm. Fish Yield
Coastal Areas • • Shallow Seasonal Inputs Seasonal Variability ~50% New Nutrients • Larger Phytoplankton • Shorter Food Chains • Benthic Food Chains • Gadoid fishes • High Comm. Fish Yield
Upwelling Areas • • Shallow Seasonal Inputs Seasonally Steady Mostly New Nutrients • Larger Phytoplankton • Short Food Chains • Clupeid fish • High Comm. Fish Yield