Observational Solar GammaRay Spectroscopy Gerry Share Wither Solar

Observational Solar Gamma-Ray Spectroscopy Gerry Share Wither Solar Gamma-Ray and Neutron Physics? GSFC October 30, 2009

Status of Research • Studies of the 2003 October 28 and 2005 January 20 flares with the new (October) RHESSI instrument response. • Flare-accelerated particle and ambient composition studies during the 1980’s using the SMM spectrometer.
.")
Updated nuclear-line cross sections relevant to solar gamma-ray studies (Murphy et al APJS 2009). Example of the spectra produced by the modified gamma-ray line production code for the interaction by protons and alpha particles following a power-law spectrum with index 4.

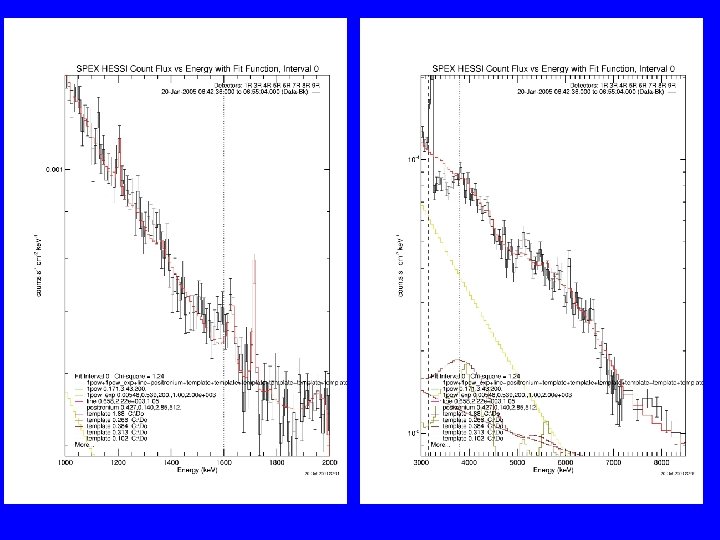
Application to SMM, Yohkoh, and RHESSI studies We fit flare spectra with pl + pl*exp (bremsstrahlung), 0. 5, 2. 2 Me. V, – 4 He lines, a solar Compton-scattered 2. 2 Me. V continuum, individual line template for p, interactions on Ne, for p, interactions on ambient composition (e. g. Asplund photospheric) , and a template for accelerated particle composition (coronal or SEP impulsive) on H and He. These nuclear line templates were calculated for the heliocentric angle of the flare and for various values of /p and ion spectral index (assuming the same index for all accelerated particles).
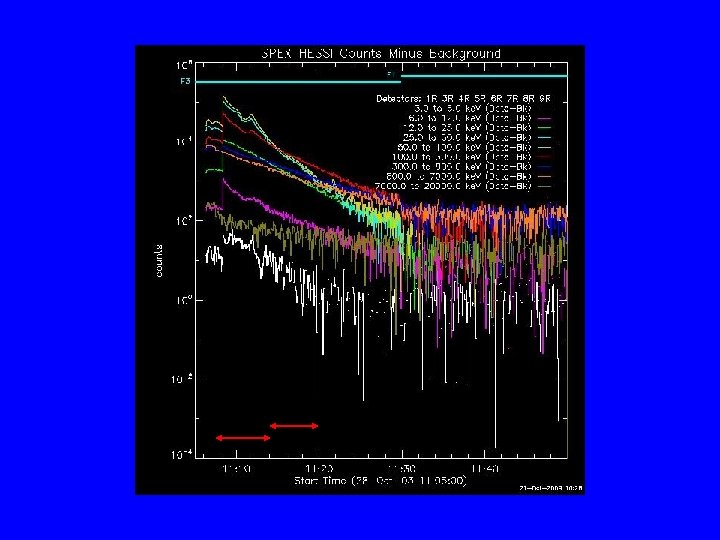

Best fit to the 2003 October 28 flare showing the total fit, bremsstrahlung, direct interaction (i. e. accelerated p and on a coronal composition), p and on neon, inverse interaction (coronal composition of heavy ions on H and He), -4 He, and 0. 511/2. 223 Me. V line components and Compton-scattered 2. 2 Me. V line, positronium continuum, and a pion-decay component.
,")
Fits to the 1989 October 19 flare showing the total fit, bremsstrahlung (dashed/dotted blue), direct interaction (i. e. accelerated p and on ambient elements; dotted red), p and a on neon (dot/dash red), inverse interaction (i. e. heavy ions on ambient elements; dashed red), -4 He, and 0. 511/2. 223 Me. V line components (dashed green) and Compton-scattered 2. 2 Me. V line and positronium continuum (dotted green).

chi 2 contour plots for spectral index and /p ratio. From Monte Carlo studies a d c 2 = 3. 8 has a 68% probability. Uses best fit coronal ambient abundances and coronal accelerated particles abundances. Upper plot: RHESSI 03 October 28 Lower plot: SMM 89 October 19, best fit pho-cor. Red (blue) curves show the indices and /p ratios consistent with photospheric He/O for Asplund 2004 (Grevesse 1998) abundances based on fits to the flux measured in the 4 He fusion lines (dotted curves show the 1 sigma statistical uncertainties). Green curves show the locus of points where the Ne/O ratio is 0. 15 (top) and 0. 20 (bottom).

05 January 20 Time History

Fit to the 05 January 20 Flare Electron bremsstrahlung Pion decay photons

Chi 2 contour map for the 2005 January 20 solar flare. Not sensitive to composition broad range of allowable indices and alpha/proton ratios.

1989 October 19 chi 2 contour plots for spectral index and /p ratio. From Monte Carlo studies a d c 2 = 3. 8 has a 68% probability. Upper plot: Map for fit using Asplund ambient abundances and coronal accelerated particles abundances. Lower plot: Map for fit where all the elemental abundances are free to vary (combined template for accelerated Ne, Mg, Si, Fe). Red (blue) curves show the indices and /p ratios consistent with photospheric He/O for Asplund 2004 (Grevesse 1998) abundances based on fits to the flux measured in the 4 He fusion lines (dotted curves show the 1 sigma statistical uncertainties). Green curves show the locus of points where the Ne/O ratio is 0. 15 (top) and 0. 20 (bottom).

Flare Compositions Ambient composition from individual line ratios ambient/acc. 03 Oct 28 cor/cor Mg/O Si/O Fe/O --- --- pho cor pho pho cor/rea (0. 09)+ pho/cor (0. 01) 89 Oct 19 pho/cor pho/pho (0. 3) pho/rea (0. 08) cor/cor (0. 01) 88 Dec 16 pho/cor pho/pho (1. 0) pho/rea (0. 2) cor/cor (<0. 005) 81 Apr 27 pho/rea pho pho cor/rea (0. 2) cor/cor (0. 1) + () relative probability that composition is pho/cor (0. 01) as good as best fit.

Additional properties of the ambient solar atmosphere and accelerated ions derived from flare gamma-ray spectra Flare Ne/O Heavy/p+ a/p ratio (ambient) (accelerated ------- Index accelerated) 2. 2 Scat/Line (ambient) 03 Oct 28 0. 24 ± 0. 04 3. 4 ± 0. 8 0. 12 -0. 45 3. 4 -4. 4 1. 92 ± 0. 26 89 Oct 19 0. 15 ± 0. 06 1. 8 ± 0. 6 0. 06– 0. 35 3. 6 -4. 2 1. 03 ± 0. 13 3. 4 -3. 8 0. 77 ± 0. 13 3. 6 -4. 2 limb flare (0. 14 -0. 30) + 88 Dec 16 0. 19 ± 0. 02 1. 8 ± 0. 4 0. 0– 0. 22 (0. 14 -0. 22) 81 Apr 27 0. 17 ± 0. 06 2. 0 ± 0. 12 0. 08 -0. 90 (0. 18 -0. 90) + Range in alpha/proton ratio if we require an Asplund photospheric abundance.
 compared with spectral index inferred")
SEP spectra observed by ACE (Mewaldt et al. 2006) compared with spectral index inferred from gamma-ray spectroscopy.

Blowup of fits to 03 October 28 flare

Chi 2 contour map for the 1988 December 16 solar flare

Chi 2 contour map for the 1981 April 27 solar flare
- Slides: 19