OBJECTORIENTED SYSTEMS ANALYSIS AND DESIGN OOSAD USING UNIFIED
 USING UNIFIED MODELLING LANGUAGE (UML) Book: Kenneth E.")
OBJECT-ORIENTED SYSTEMS ANALYSIS AND DESIGN (OOSAD) USING UNIFIED MODELLING LANGUAGE (UML) Book: Kenneth E. Kendall and Julie E. Kendall, System Analysis and Design Methods, 8 th Edition, Prentice Hall, 2010 (Chapter 10)

Contents: • • • • Object-Oriented Concepts Objects / Classes / Inheritance CRC Cards and Object Think The Unified Modeling Language (UML) Concepts and Diagrams Use Case Modelling Activity Diagram Sequence and Communication Diagrams Class Diagram Enhancing Sequence Diagrams Enhancing Class Diagram Statechart Diagrams Package and Other UML Artifacts Putting UML To Work The Important of Using UML For Modeling

Introduction • Object-oriented analysis and design can offer an approach that facilitates logical, rapid, and thorough methods for creating new systems responsive to a changing business landscape. • Object-oriented techniques work well in situations in which complicated information systems are undergoing continuous maintenance, adaptation, and redesign. • In this chapter, we introduce the unified modeling language (UML), the industry standard for modeling object-oriented systems. • The UML toolset includes diagrams that allow you to visualize the construction of an object-oriented system. • Each design iteration takes a successively more detailed look at the design of the system until the things and relationships in the system are clearly and precisely defined in UML documents. • UML is a powerful tool that can greatly improve the quality of your systems analysis and design, and thereby help create higher-quality information systems.

Object Oriented Concept • Object-oriented programming differs from traditional procedural programming by examining the objects that are part of a system. • Each object is a computer representation of some actual thing or event. • General descriptions of the key object-oriented concepts of objects, classes, and inheritance are presented in this section, with further details on other UML concepts introduced later in this chapter.
 Object 2) Classes 3) Inheritance")
Object Oriented Concept 1) Object 2) Classes 3) Inheritance
 Object • Objects are persons, places, or things that are relevant to the")
1) Object • Objects are persons, places, or things that are relevant to the system we are analyzing. • Object oriented systems describe entities as objects. • Typical objects may be customers, items, orders, and so on. • Objects may also be GUI displays or text areas on the display.

Object and Classes : • Objects are typically part of a group of similar items called classes. The desire to place items into classes is not new. • Describing the world as being made up of animals, vegetables, and minerals is an example of classification. • The scientific approach includes classes of animals (such as mammals), and then divides the classes into subclasses (such as egg-laying animals and pouched mammals). • Objects are represented by and grouped into classes that are optimal for reuse and maintainability. • A class defines the set of shared attributes and behaviors found in each object in the class. • For example, records for students in a course section have similar information stored for each student. • The students could be said to make up a class (no pun intended). • The values may be different for each student, but the type of information is the same. • Programmers must define the various classes in the program they are writing. • When the program runs, objects can be created from the established class. The term instantiate is used when an object is created from a class. • For example, a program could instantiate a student named Peter. Wellington as an object from the class labeled as student.
 Classes • Each class should have a name that differentiates it from all")
2) Classes • Each class should have a name that differentiates it from all other classes. • Class names are usually nouns or short phrases and begin with an uppercase letter. • In Figure 10. 1 the class is called Rental. Car. • In UML, a class is drawn as a rectangle. • The rectangle contains two other important features: a list of attributes and a series of methods. • These items describe a class, the unit of analysis that is a large part of what we call object-oriented analysis and design.

Figure 10. 1 : An example of a UML class. A class is depicted as a rectangle consisting of the class name, attributes, and methods.

Classes : • An attribute describes some property that is possessed by all objects of the class. • Notice that the Rental. Car class possesses the attributes of size, color, make, and model. • All cars possess these attributes, but each car will have different values for its attributes. • For example, a car can be blue, white, or some other color. Later on we will demonstrate that you can be more specific about the range of values for these properties. When specifying attributes, the first letter is usually lowercase.

Method : • A method is an action that can be requested from any object of the class. • Methods are the processes that a class knows to carry out. Methods are also called operations. • For the class of Rental. Car, rent. Out(), check. In(), and service() are examples of methods. • When specifying methods, the first letter is usually lowercase.
 • Another key concept of object-oriented systems is inheritance. Classes can")
3. Inheritance (Pewarisan) • Another key concept of object-oriented systems is inheritance. Classes can have children; that is, one class can be created out of another class. • In UML, the original—or parent—class is known as a base class. • The child class is called a derived class. • A derived class can be created in such a way that it will inherit all the attributes and behaviors of the base class. • A derived class, however, may have additional attributes and behaviors. • For example, there might be a Vehicle class for a car rental company that contains attributes such as size, color, and make.

• Inheritance reduces programming labor by using common objects easily. • The programmer only needs to declare that the Car class inherits from the Vehicle class, and then provide any additional details about new attributes or behaviors that are unique to a car. • All the attributes and behaviors of the Vehicle class are automatically and implicitly part of the Car class and require no additional programming. • This enables the analyst to define once but use many times, and is similar to data that is in the third normal form, defined only once in one database table. • The derived classes shown in Figure 10. 2 are Car or Truck. Here the attributes are preceded by minus signs and methods are preceded by plus signs.

Figure 10. 2: A class diagram showing inheritance. Car and Truck are specific examples of vehicles and inherit the characteristics of the more general class, Vehicle.
 Concepts and Diagram • The UML approach is well")
The Unified Modelling Language (UML) Concepts and Diagram • The UML approach is well worth investigating and understanding, due to its wide acceptance and usage. • UML provides a standardized set of tools to document the analysis and design of a software system. • The UML toolset includes diagrams that allow people to visualize the construction of an object-oriented system, similar to the way a set of blueprints allows people to visualize the construction of a building. • Whether you are working independently or with a large systems development team, the documentation that you create with UML provides an effective means of communication between the development team and the business team on a project.

• UML consists of things, relationships, and diagrams, as illustrated in Figure 10. 3. • The first components, or primary elements, of as object, but in UML they are called things. • Structural things are most common. Structural things are classes, interfaces, use cases, and many other elements that provide a way to create models. • Structural things allow the user to describe relationships. Behavioral things describe how things work. • Examples of behavioral things are interactions and state machines. Group things are used to define boundaries. • An example of a group thing is a package. • Finally, we have annotational things, so that we can add notes to the diagrams.

Figure 10. 3 : An overall view of UML and its components: Things, Relationships, and Diagrams.

• Relationships are the glue that holds the things together. • It is useful to think of relationships in two ways. • Structural relationships are used to tie things together in the structural diagrams. • Structural relationships include dependencies, aggregations, associations, and generalizations. • Structural relationships show inheritance, for example. • Behavioral relationships are used in the behavioral diagrams. • The four basic types of behavioral relationships are communicates, includes, extends, and generalizes.

• There are two main types of diagrams in UML: structural diagrams and behavioral diagrams. • Structural diagrams are used, for example, to describe the relationships between classes. • They include class diagrams, object diagrams, component diagrams, and deployment diagrams. • Behavioral diagrams, on the other hand, can be used to describe the interaction between people (called actors in UML) and the thing we refer to as a use case, or how the actors use the system. • Behavioral diagrams include use case diagrams, sequence diagrams, communication diagrams, statechart diagrams, and activity diagrams.

The six most commonly used UML diagrams are: 1. A use case diagram, describing how the system is used. Analysts start with a use case diagram. 2. A use case scenario (although technically it is not a diagram). This scenario is a verbal articulation of exceptions to the main behavior described by the primary use case. 3. An activity diagram, illustrating the overall flow of activities. Each use case may create one activity diagram. 4. Sequence diagrams, showing the sequence of activities and class relationships. Each use case may create one or more sequence diagrams. An alternative to a sequence diagram is a communication diagram, which contains the same information but emphasizes communication instead of timing. 5. Class diagrams, showing the classes and relationships. Sequence diagrams are used (along with CRC cards) to determine classes. An offshoot of a class diagram is a gen/spec diagram (which stands for generalization/specialization). 6. Statechart diagrams, showing the state transitions. Each class may create a statechart diagram, which is useful for determining class methods. How these diagrams relate to one another is illustrated in Figure 10. 5.

Figure 10. 5. An overall view of UML diagrams showing how each diagram leads to the development of other UML diagrams.

Use Case Modelling • UML is fundamentally based on an object-oriented analysis technique known as use case modeling. • A use case model shows a view of the system from the user perspective, thus describing what a system does without describing how the system does it. • UML can be used to analyze the use case model, and to derive system objects and their interactions with each other and with the users of the system. • Using UML techniques, you further analyze the objects and their interactions to derive object behavior, attributes, and relationships. • A use case provides developers with a view of what the users want. • It is free of technical or implementation details. • We can think of a use case as a sequence of transactions in a system. • The use case model is based on the interactions and relationships of individual use cases.

• A use case always describes three things: an actor that initiates an event; the event that triggers a use case; and the use case that performs the actions triggered by the event. • In a use case, an actor using the system initiates an event that begins a related series of interactions in the system. • Use cases are used to document a single transaction or event. • An event is an input to the system that happens at a specific time and place and causes the system to do something. • For more information about use case symbols and how to draw use case diagrams, see Chapter 2.
.")
Figure 10. 6. A use case example of student enrollment (daftar siswa).

• Figure 10. 6 is a use case example of student enrollment at a university. • Notice that only the most important functions are represented. • The Add Student use case does not indicate how to add students, the method of implementation. • Students could be added in person, using the Web, using a touch-tone telephone, or any combination of these methods. • The Add Student use case includes the Verify Identity (Pembuktian Identitas) use case to verify the identity of the student. • The Purchase Textbook use case extends the Enroll in Class (daftar kelas) use case, and may be part of a system to enroll students in an online course. • It may seem as if the Change Student Information use case is a minor system feature and should not be included on the use case diagram, but because this information changes frequently, administration has a keen interest in allowing students to change their own personal information. • The fact that the administrators deem (menganggap) this to be important not only justifies (benar), but calls for, the use case to be written up. • Students would not be allowed to change grade point average, outstanding fees, and other information. • This use case also includes the Verify Identity use case, and in this situation, it means having the student enter a user ID and password before gaining access to the system. • View Student Information allows students to view their personal information, as well as courses and grades.

• A use case scenario example is shown in Figure 10. 7. Some of the areas included are optional, and may not be used by all organizations. • The three main areas are: 1) A header area containing case identifiers and initiators. 2) Steps performed. 3) A footer area containing preconditions, assumptions, questions, and other information.

FIGURE 10. 7. A use case scenario is divided into three sections: identification and initiation, steps performed, and conditions, assumptions, and questions.

• In the first area the use case is identified by its name, Change Student Information; the actor is identified as a Student; and the Use Case and Triggering Event are described. • The second area contains a series of steps that are performed as long as no errors are encountered. • Finally, in the third area, all of the pre- and postconditions and assumptions are identified. • Some of these are obvious, such as the precondition that the student is on the correct Web page and the assumption that the student has a valid student ID and password. • Others are not so obvious, such as the out-standing issue regarding how many times the student is allowed to log on to the system. • Use case diagrams provide the basis for creating other types of diagrams, such as class diagrams and activity diagrams. • Use case scenarios are helpful in drawing sequence diagrams. • Both use case diagrams and use case scenarios are powerful tools to help us understand how a system works in general.

Activity Diagrams: • Creating Activity Diagrams • Repository Entries for an Activity Diagram

• Activity diagrams show the sequence of activities in a process, including sequential and parallel activities, and decisions that are made. • An activity diagram is usually created for one use case and may show the different possible scenarios. • The symbols on an activity diagram are illustrated in Figure 10. 8. • A rectangle with rounded ends represents an activity, either a manual one, such as signing a legal document, or an auto-mated one, such as a method or program.

FIGURE 10. 8. Specialized symbols are used to draw an activity diagram.

• An arrow represents an event. • Events represent things that happen at a certain time and place. • A diamond represents either a decision (also called a branch) or a merge. • Decisions have one arrow going into the diamond and several going out. • A guard condition, showing the conditionvalues, may be included. • Merges show several events combining to form one event. • A long, flat rectangle represents a synchronization bar. • These are used to show parallel activities, and may have one event going into the synchronization bar and several events going out of it, called a fork. • A synchronization in which several events merge into one event is called a join. • There are two symbols that show the start and end of the diagram. • The initial state is shown as a filled-in circle. • The final state is shown as a black circle surrounded by a white circle. • Rectangles surrounding other symbols, called swimlanes, indicate partitioning and are used to show which activities are done on which

• You can see an example of swimlanes in Figure 10. 9, which illustrates an activity diagram for the Change Student Information use case. • It starts with the student logging onto the system by filling out a Web form and clicking the Submit button. • The form is transmitted to the Web server, which then passes the data to the mainframe computer. • The mainframe accesses the STUDENT database and passes either a “Not Found” message or selected student data to the Web server.

Figure 10. 9. This activity diagram shows three swimlanes: Client Web Page, Web Server, and Mainframe.

• The diamond below the Get Student Record state indicates this decision. • If the student record has not been found, the Web server displays an error message on the Web page. • If the student record has been found, the Web server formats a new Web page containing the current student data in a Web form. • The student may cancel the change from either the Logon System or the Enter Changes states, and the activity halts. • If the student enters changes on the Web form and clicks the Submit button, the change data is transmitted to the server and a program starts running that validates the changes. • If there are errors, an error message is sent to the Web page. • If the data are valid, the student record is updated and a Change Student Journal Record is written. • After a valid update, a confirmation Web page is sent to the browser and the activity terminates.

Creating Activity Diagrams • Activity diagrams are created by asking what happens first, what happens second, and so on. • You must determine whether activities are done in sequence or in parallel. If physical data flow diagrams (as described in Chapter 7) have been created, they may be examined to determine the sequence of activities. • Look for places where decisions are made, and ask what happens for each of the decision outcomes. • Activity diagrams may be created by examining all the scenarios for a use case. • Each path through the various decisions included on the use case is a different scenario. • In the main path would be Logon System, Receive Web Form, Get Student Record, Display Current Student Data, Enter Changes, Validate Changes, Update Student Record, Create Change Student Journal Record, and Display Confirmation. • This isn’t the only scenario that comes from this use case. • Other scenariosmay occur. One possibility could be Logon System, Receive Web Form, Get Student Record, and Display Error Message. • Another scenario could be Logon System, Receive. Web Form, Get Student Record, Display. Current Student. Data, Enter. Changes, Validate. Changes, and. Display Error. Message.

• The swimlanes are useful to show the data must be transmitted or converted, such as from Web to server or from server to mainframe. • For example, the Change Student Record activity diagram has three swimlanes. • The swimlane on the left shows activities that occur on the client browser. • Web pages must be created for these activities. • The middle swimlane shows activities that happen on the server. • Events, such as Form Transmitted, represent data transmitted from the browser to the server, and there must be programs on the server to receive and process the client data. • The swimlane on the right represents the mainframe computer. • In large organizations it is typical for many Web applications to work with a mainframe computer. • Much of the data in large organizations exists on mainframe databases and there is an enormous number of mainframe programs in existence.

• When an event crosses the swimlane from the server to the mainframe computer, there must be a mechanism for transmitting the event data between the two platforms. • Servers use a different format to represent data (ASCII) than do mainframe computers (they use a format called EBCDIC). • Middleware must be present to take care of the conversion. • IBM computers often use an mqueue (for message queue). • The mqueue receives data from the server programs, places it in a holding area, and calls a mainframe program, usually written in a language called CICS. • This program retrieves or updates the data, and sends the results back to the mqueue. • In the example activity diagram shown, the decision below the Get Student Record state is made on the mainframe computer. • This means that the message queue receives either a “Not Found” message or the database record for the student. • If the mainframe simply placed the Record Status Received in the message queue and the decision was evaluated on the server, the server would have to call the mainframe again to obtain the valid data. • This would slow down the response to the person waiting at the browser.

• Swimlanes also help to divide up the tasks in a team. • Web designers would be needed for the Web pages displayed on the client browser. Other members would work with programming languages, such as Java, PHP, Ruby on Rails, PERL, or. NET, on the server. • Mainframe CICS programmers would write programs that would work with the message queue. • The analyst must ensure that the data that the various team members need is available and correctly defined. • Sometimes the data in the message queue is an XML document. If an outside organization is involved, the data also might be an XML document. • The activity diagram provides a map of a use case, and allows the analyst to experiment with moving portions of the design to different platforms and ask “What if? ” for a variety of decisions. • The use of unique symbols and swimlanes makes this diagram one that people want to use to communicate with others. • Activity diagrams may be used to construct test plans. • Each event must be tested to see whether the activity diagram goes to the next state. • Each decision must be tested to see whether

• Activity diagrams are not used for all use cases. Use the activity diagram when: 1) It helps to understand the activities of a use case. 2) The flow of control is complex. 3) There is a need to model workflow. 4) All scenarios need to be shown. • The analyst would not need an activity diagram when the use case is simple or there is a need to model the change of state. • Activity diagrams may also be used to model a lower-level method, showing

Repository Entries for an Activity Diagram • Each state and event may be further defined using a text description in a repository, which is a collection of text descriptions for the project. • Describe states with information about the state, such as the Web page name, elements on the Web page, and so on. • Describe events with the information that is required to communicate with the next state, such as the data from the Web form, the data that is put into a message queue,

SEQUENCE AND COMMUNICATION DIAGRAMS • Sequence Diagrams • Communication Diagrams

Sequence Diagrams • Sequence diagrams can illustrate a succession of interactions between classes or object instances over time. • Sequence diagrams are often used to illustrate the processing described in use case scenarios. • In practice, sequence diagrams are derived from use case analysis and are used in systems design to derive the interactions, relationships, and methods of the objects in the system. • Sequence diagrams are used to show the overall pattern of the activities or interactions in a use case. • Each use case scenario may create one sequence diagram, although sequence diagrams are not always created for minor scenarios. • The symbols used in sequence diagrams are shown in Figure 10. • Actors and classes or object instances are shown in boxes along the top of the diagram. • The leftmost object is the starting object and may be a person (for which a use case actor symbol is used), window, dialog box, or other user interface. • Some of the interactions are physical only, such as signing a contract. • The top rectangles use indicators in the name to indicate whether the rectangle represents an object, a class, or a class and object.
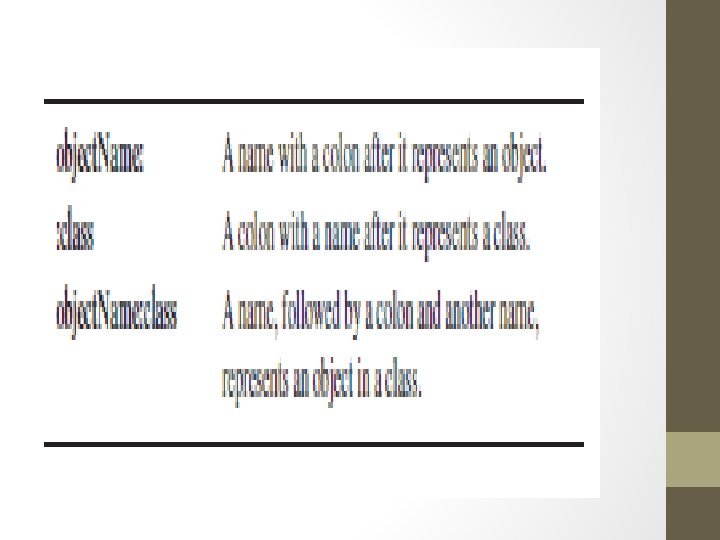

Figure 10. Specialized symbols used to draw a sequence diagram.

• A vertical line represents the lifeline for the class or object, which corresponds to the time from when it is created through when it is destroyed. • An X on the bottom of the lifeline represents when the object is destroyed. A lateral bar or vertical rectangle on the lifeline shows the focus of control when the object is busy doing things. • Horizontal arrows show messages or signals that are sent between the classes. • Messages belong to the receiving class. There are some variations in the message arrows. • Solid arrowheads represent synchronous calls, which are the most common. • These are used when the sending class waits for a response from the receiving class, and control is returned to the sending class when the class receiving the message finishes executing. • Half (or open) arrowheads represent asynchronous calls, or those that are sent without an expectation of returning to the sending class. • An examplewould be using a menu to run a program. A return is shown as an arrow, sometimes with a dashed line. • Messages are labeled using one of the following formats:

• Messages are labeled using one of the following formats: o The name of the message followed by empty parentheses: message. Name(). o The name of the message followed by parameters in parentheses: message. Name(parameter 1, parameter 2. . . ). o The message name followed by the parameter type, parameter name, and any default value for the parameter in parentheses: message. Name(parameter. Type: parameter. Name(defa ult. Value). Parameter types indicate the type of data, such as string, number, or date. o The message may be a stereotype, such as «Create» , indicating that a new object is created as a result of the message.

• Timing in the sequence diagram is displayed from top to bottom; the first interaction is drawn at the top of the diagram, and the interaction that occurs last is drawn at the bottom of the diagram. • The interaction arrows begin at the bar of the actor or object that initiates the interaction, and they end pointing at the bar of the actor or object that receives the interaction request. • The starting actor, class, or object is shown on the left. This may be the actor that initiates the activity or it may be a

• Figure 10. 11 is a simplified example of a sequence diagram for a use case that admits a student to a university. • On the left is the new. Student. User. Interface class that is used to obtain student information. • The initialize() message is sent to the Student class, which creates a new student record and returns the student number. • To simplify the diagram, the parameters that are sent to the Student class have been omitted, but would include the student name, address, and so on. • The next activity is to send a select. Dorm message to the Dorm class. • This message would include dorm selection information, such as a health dorm or other student requirements. The Dorm class returns the dorm name and room number. • The third activity is to send a select. Program message to the Program class, including the program name and other course of study information. • The program advisor name is returned to the new. Student. User. Interface class.

Figure 10. 11. A sequence diagram for student admission. Sequence diagrams emphasize the time ordering of messages. NB: dorm : asrama mahasiswa, advisor: penasehat hukum

• Sequence diagrams can be used to translate the use case scenario into a visual tool for systems analysis. • The initial sequence diagram used in systems analysis shows the actors and classes in the system and the interactions between them for a specific process. • You can use this version of the sequence diagram to verify processes with the business area experts who have assisted you in developing the system requirements. • A sequence diagram emphasizes the time ordering (sequence) of messages. • During the systems design phase, the sequence diagrams are refined to derive the methods and interactions between classes. • Messages from one class are used to identify class relationships. • The actors in the earlier sequence diagrams are translated to interfaces, and class interactions are translated to class methods. • Class methods used to create instances of other classes and to perform other internal system functions become apparent in the system design using sequence diagrams.

Communication Diagrams • Communication diagrams were introduced in UML 2. 0. • Their original name in UML 1. x was collaboration diagrams. • Communication diagrams describe the interactions of two or more things in the system that perform a behavior that is more than any one of the things can do alone. • For instance, a car can be broken down into several thousand individual parts. • The parts are put together to form the major subsystems of the vehicle: the engine, the transmission, the brake system, and so forth. • The individual parts of the car can be thought of as classes, because they have distinct attributes and functions. • The individual parts of the engine form a collaboration, because they “communicate” with each other to make the engine run when the driver steps on the accelerator.

• A communication diagram is made up of three parts: objects (also called participants), the communication links, and the messages that can be passed along those links. • Communication di agrams show the same information as a sequence diagram but may be more difficult to read. • In order to show time ordering, you must indicate a sequence number and describe the message. • A communication diagram emphasizes the organization of objects, whereas a sequence diagram emphasizes the time ordering of messages. • A communication diagram will show a path to

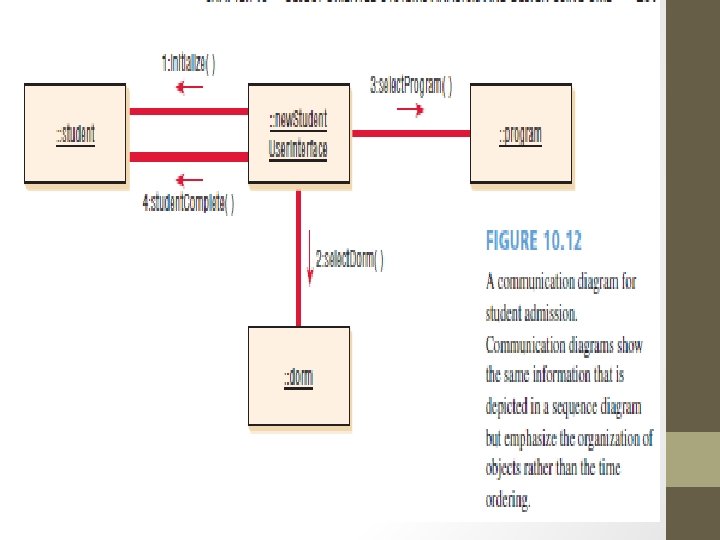
• Some UML modeling software, such as IBM’s Rational Rose, will automatically convert a sequence diagram to a communication diagram or a communication diagram to a sequence diagram with the click of a button. • A communication diagram for the student admission example is illustratedin Figure 10. 12. Each rectangle represents an object or a class. • Connecting lines show the classes that need to collaborate or work with each other. • The messages sent from one class to another are shown along connecting lines. • Messages are numbered to show the time sequence. Return values may also be included

CLASS DIAGRAM • Method Overloading • Types of Classes • Defining Messages and Methods

CLASS DIAGRAM • Object-oriented methodologies work to discover classes, attributes, methods, and relationships between classes. • Because programming occurs at the class level, defining classes is one of the most important object-oriented analysis tasks. • Class diagrams show the static features of the system and do not represent any particular processing. • A class diagram also shows the nature of the relationships between classes. • Classes are represented by a rectangle on a class diagram. • In the simplest format, the rectangle may include only the class name, but may also include the attributes and methods. • Attributes are what the class knows about characteristics of the objects, and methods (also called operations) are what the class knows about how to do things.

• Figure 10. 13 illustrates a class diagram for course offerings. • Notice that the name is centered at the top of the class, usually in boldface type. • The area directly below the name shows the attributes, and the bottom portion lists the methods. • The class diagram shows data storage requirements as well as processing requirements. • Later in the chapter we will discuss the meaning of the diamond symbols shown in this figure.

Figure 10. 13. A class diagram for course offerings. The filled-in diamonds show aggregation and the empty diamond shows a whole-part relationship.
 are usually designated as private, or only available")
• The attributes (or properties) are usually designated as private, or only available in the object. • This is represented on a class diagram by a minus sign in front of the attribute name. • Attributes may also be protected, indicated with a pound symbol (#). • These attributes are hidden from all classes except immediate subclasses. • Under rare circumstances, an attribute is public, meaning that it is visible to other objects outside its class. • Making attributes private means that the attributes are only available to outside objects through the

• A class diagram may show just the class name; or the class name and attributes; or the class name, attributes, and methods. • Showing only the class name is useful when the diagram is very complex and includes many classes. • If the diagram is simpler, attributes and methods may be included. • When attributes are included, there are three ways to show the attribute information. • The simplest is to include only the attribute name, which takes the least amount of space. • The type of data (such as string, double, integer, or date) may be included on the class diagram. • The most complete descriptions would include an equal sign () after the type of data followed by the initial value for the attribute. • Figure 10. 14 illustrates class attributes.

Figure 10. 14. An extended Student class that shows the type of data and, in some cases, its initial value or default value.

• If the attribute must take on one of a finite number of values, such as a student type with values of F for full-time, P for parttime, and N for nonmatriculating, these may be included in curly brackets separated by commas: student. Type: char{F, P, N}. • Information hiding means that objects’methods must be available to other classes, so methods are often public, meaning that they may be invoked from other classes. • On a class diagram, public messages (and any public attributes) are shown with a plus sign () in front of them. • Methods also have parentheses after them, indicating that data may be passed as parameters along with the message. • The message parameters, as well as the type of data, may be included on the class diagram. • There are two types of methods: standard and custom. Standard methods are basic things that all classes of objects know how to do, such as create a new object instance. • Custom methods are designed for a specific class.
 several")
Method Overloading • Method overloading refers to including the same method (or operation) several times in a class. • The method signature includes the method name and the parameters included with the method. • The same method may be defined more than once in a given class, as long as the parameters sent as part of the message are different; that is, there must be a different message signature. • There may be a different number of parameters, or the parameters might be a different type, such as a number in one method and a string in another method. • An example of method overloading may be found in the use of a plus sign in many programming languages. • If the attributes on either side of the plus sign are numbers, the two numbers are added. If the attributes are strings of characters, the strings are concatenated to form one long string. • In a bank deposit example, a deposit slip could contain just the amount of the deposit, in which case the bank would deposit the entire amount, or it could contain the deposit amount and the amount of cash to be returned. Both situations would use a deposit check method, but the parameters (one situation would also request the amount of cash to be returned) would be different.
 ENTITY CLASSES. 2) BOUNDARY, OR INTERFACE, CLASSES. 3) ABSTRACT CLASSES.")
TYPES OF CLASSES: 1) ENTITY CLASSES. 2) BOUNDARY, OR INTERFACE, CLASSES. 3) ABSTRACT CLASSES. 4) CONTROL CLASSES.
 ENTITY CLASSES • Entity classes represent real-world items, such as people, things, and")
1) ENTITY CLASSES • Entity classes represent real-world items, such as people, things, and so on. • Entity classes are the entities represented on an entityrelationship diagram. CASE tools such as Visible Analyst will allow you to create a UML entity class from an entity on an E-R diagram. • The analyst needs to determine which attributes to include in the classes. • Each object has many attributes, but the class should include only those that are used by the organization. • For example, when creating an entity class for a student at a college, you would need to know attributes that identify the student, such as home and campus address, as well as grade point average, total credits, and so on. • If you were keeping track of the same student for an online clothing store, you would have to know basic identifying
 BOUNDARY, OR INTERFACE, CLASSES • Boundary, or interface, classes provide a means for")
2) BOUNDARY, OR INTERFACE, CLASSES • Boundary, or interface, classes provide a means for users to work with the system. • There are two broad categories of interface classes: human and system. • A human interface may be a display, window, Web form, dialog box, menu, list box, or other display control. • It may also be a touch-tone telephone, bar code, or other way for users to interact with the system. Human interfaces should be prototyped (as described in Chapter 6), and often a storyboard is used to model the sequence of interactions. • System interfaces involve sending data to or receiving data from other systems. • This may include databases in the organization. • If data are sent to an external organization, they are often in the form of XML files or other well-published interfaces with clearly defined messages and protocols. • External interfaces are the least stable, because there is often little or no control over an external partner who may alter the format of the message or data. • XML helps to provide standardization, because an external partner may add new elements to The XMLdocument, but a corporation transforming the data
 ABSTRACT CLASSES • Abstract classes are classes that cannot be directly instantiated. •")
3) ABSTRACT CLASSES • Abstract classes are classes that cannot be directly instantiated. • Abstract classes are those that are linked to concrete classes in a generalization/specialization (gen/spec) relationship. • The name of an abstract class is usually denoted in italics.
 CONTROL CLASSES • Control, or active, classes are used to control the flow")
4) CONTROL CLASSES • Control, or active, classes are used to control the flow of activities, and they act as a coordinator when implementing classes. • To achieve classes that are reusable, a class diagram may include many small control classes. • Control classes are often derived during system design. • Often a new control class will be created just to make another class reusable. • An example would be the logon process. • There might be one control class that handles the logon user interface, containing the logic to check the user ID and password. • The problem that arises is that the logon control class is designed for a specific logon display. • By creating a logon control class that handles just the unique logon display, the data may be passed to a more general validation control class, which performs a check on user IDs and passwords received from many other control classes receiving messages from specific user interfaces. • This increases reusability and isolates the logon verification methods from the user interface handling methods. • The rules for creating sequence diagrams are that all interface classes must be connected to a control class. • Similarly, all entity classes must be connected to a control class. Interface classes, unlike the other two, are never connected directly to entity classes.

Defining Messages and Methods • Each message may be defined using a notation similar to that • • • described for the data dictionary (as shown in Chapter 8). The definition would include a list of the parameters passed with the message as well as the elements contained in the return message. The methods may have logic defined using structured English, a decision table, or a decision tree, as depicted in Chapter 9. The analyst can use the techniques of horizontal balancing with any class method. All the data returned from an entity class must be obtained either from the attributes stored in the entity class, from the parameters passed on the message sent to the class, or as a result of a calculation performed by the method of the class. The method logic and parameters must be examined to ensure that the method logic has all the information required to complete its work. Horizontal balancing is further described in Chapter 7.

ENHANCING SEQUENCE DIAGRAMS: • A Class Example for the Web • Presentation, Business, and Persistence Layers in Sequence Diagrams

ENHANCING SEQUENCE DIAGRAMS: • Once the class diagram is drawn, it may be desirable to go back to the sequence diagram and include special symbols for each of the different types of classes introduced in the last section. Sequence diagrams in particular can be overbearing if an analyst doesn’t have a systematic approach to drawing them. The following steps are a useful approach to enhancing a sequence diagram: 1) Include the actor from the use case diagram in the enhanced sequence diagram. This will be a stick figure from the use case diagram. There may be an additional actor on the right side of the diagram, such as a credit card company or bank. 2) Define or more interface classes for each actor. Each actor should have his or her own interface class. 3) Create prototype Web pages for all human interfaces. 4) Ensure each use case has one control class, although more may be created during the detailed design. Look for that control class and include it in the sequence diagram. 5) Examine the use case to see what entity classes are present. Include these on the diagram. 6) Realize that the sequence diagram may be modified again when doing detailed design, such as creating additional Web pages or control classes (one for each Web form submitted).

A Class Example for the Web • Classes may also be represented using special symbols for entity, boundary (or interface), and control classes. • These are called stereotypes, an extension to UML, which are special symbols that may be used during analysis, but are often used when performing object-oriented design. • They allow the analyst freedom to play with the design to optimize reusability. • The different types of classes are often used when working in the systems design phase. • Figure 10. 15 is an example illustrating a sequence diagram representing a student viewing his or her personal and course information. • In the diagram, : View Student User Interface is an example of an interface class; : Student, : Section, and : Course are examples of entity classes; and : View Student Interface Controller and : Calculate Grade Point Average are control classes.

Figure 10. 15. A sequence diagram for using two Web pages: one for student information, one for course information.

• The student is shown on the left as an actor, and he or she provides a user. Logon to the : View Student User Interface class. • This is a Web form that obtains the student’s user ID and password. • When the student clicks the Submit button, the Web form is passed to a : View Student Interface Controller. • This class is responsible for the coordination of sending messages and receiving returned information from all the other classes. • The : View Student Interface Controller sends a get. Student( ) message to the : Student class, which reads a database table and proceeds to

• The student. Web. Page is returned to the : View Student User Interface, which displays the information in the Web browser. • At the bottom of the page is a next. Button that the student clicks to view courses. When the user clicks this button, it sends a Web form to the : View Student Interface Controller. • This form contains the student. Number(), sent along with the student. Web. Page, and is used to send a message to the : Section class to obtain the section grade. • If the student. Number() was not automatically sent, it would mean that the student would have to enter his or her student. Number() again, which would not be a satisfactory user interface because it involves redundant keying. Notice that the : Student class is not involved, and that the focus of control (the vertical bar that is connected to the : Student class) ends before the second set of activities (the horizontal arrows pointing to the right) begins.
 message")
• The : View Student Interface Controller class sends a get. Section() message to the : Section class, which returns a section. Grade. • The : Section class also sends a calculate. GPA() message to the : Calculate Grade Point Average class, which sends a message back to the : Course class. • The : Course class returns the credits, which enables the : Calculate Grade Point Average class to determine the GPA and return it to the : View Student Interface Controller.

• The : View Student Interface Controller would repeat sending messages to the : Section class until all sections for the student have been included. • At this time, the : View Student Interface Controller would send the course. Web. Page to the : View Student User Interface class, which would display the information in the browser. • Using the user interface, control, and entity classes also allows the analyst to explore and play with the design. • The design mentioned previously would display all the student personal information on one page and the course information on a second page. • The analyst may modify the design so that the student personal information and the course information appear on one Web page. • These two possible scenarios would be reviewed with users to determine the best option.

One of the difficulties for the analyst is to determine how to include the student. Number after clicking the Next button, because the : Student class is no longer available. There are three ways to store and retransmit data from a Web page: 1) Include the information in the URL displaying in the address or location area of the browser. In this case, the location line might read something like the following: http: //www. cpu. edu/studentinq. html? student. Number 12345 Everything after the question mark is data that may be used by the class methods. This means of storing data is easy to implement and is often used in search engines. There are several drawbacks to using this method, and the analyst must use due caution. The first concern is privacy—anyone can read the Web address. If the application involves medical information, credit card numbers, and so on, this is not a good choice. Most browsers will also display previous Web address data in subsequent sessions if the user enters the first few characters, and the information may be compromised, leading to identity theft. A second disadvantage is that the data are usually lost after the user closes the browser.
 Store the information in a cookie, a small file stored on the client")
2) Store the information in a cookie, a small file stored on the client (browser) computer. Cookies are the only way to store data that have persistence, existing beyond the current browser session. This enables the Web page to display a message such as “Welcome back, Robin. If you are not Robin, click here. ” Cookies usually store primary key account numbers, but not credit card numbers or other private information. Cookies are limited to 20 per domain (such as www. cpu. edu) and each cookie must be 4, 000 characters or less. The analyst must work with other business units to determine who needs to use cookies, and there must be some central control over the names used in the cookies. If the organization needs to have more than 20 cookies, a common solution is to create different domain names used by the organization, such as support. cpu. edu or instruction. cpu. edu.
 Web form fields. These fields usually contain data that are sent by the")
3) Web form fields. These fields usually contain data that are sent by the server, are invisible, and do not occupy any space on the Web page. In the view student information example, the : View Student Interface Controller class added a hidden field containing the student. Number to the student. Web. Page form along with the next. Button. When the student clicks the next. Button, the student. Number is sent to the server and the : View Student Interface Controller knows which student to obtain course and grade information for. The data in hidden forms is not saved from one browser session to another, so privacy is maintained.

Presentation, Business, and Persistence Layers in Sequence Diagrams • In the previous example, we showed all of the classes in the same diagram. When it comes to writing code for systems, it has been useful to look at sequence diagrams as having three distinct layers as follows: 1) The presentation layer, which represents what the user sees. This layer contains the interface or boundary classes. 2) The business layer, which contains the unique rules for this application. This layer contains the control classes. 3) The persistence or data access layer, which describes obtaining and storing data. This layer contains the entity classes

• Ideally program code would be written separately for each of these layers. • With the introduction of Ajax, the lines became blurred. • Ajax, an acronym for asynchronous Java. Script and XML, is a collection of techniques that allows Web applications to retrieve information from the server without altering the display of the current page. • This turns out to be an advantage because the entire Web page does not need to be reloaded when it gets additional data from the server. • Before Ajax was created a user visiting a. Web site would answer some questions by entering data on a. Web-based form, then wait until a new page loaded. • This was necessary because the code to validate, get the data, then answer the user resided on the server. • With the advent of Ajax, the Web page is updated rapidly because much of the validation and other control logic is now included in the browser Java. Script code or on the client side. • This means that business rules are included in both the
 Diagrams")
ENHANCING CLASS DIAGRAMS 1. Relationships 2. Generalization/Spe cialization (Gen/Spec) Diagrams

ENHANCING CLASS DIAGRAMS • The class symbols also may be used on class and communication diagrams. Figure 10. 16 illustrates • the class diagram for a student viewing personal and course information on Web pages. • Each class has attributes and methods (which are not shown on diagrams using
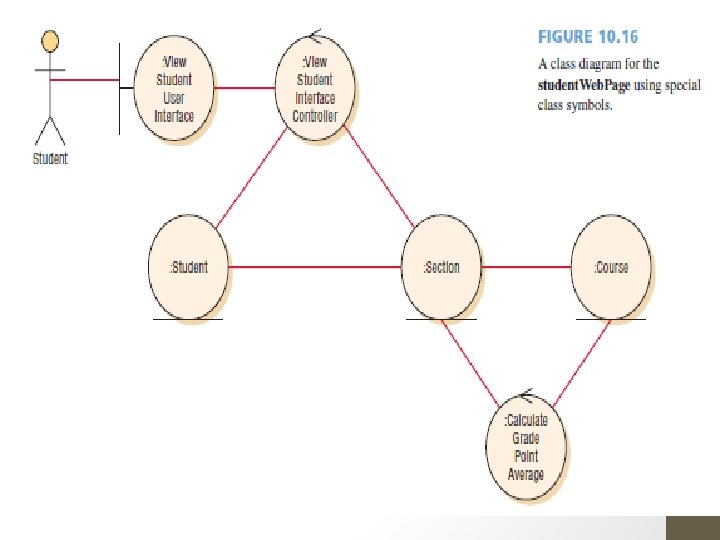

• If the class is a user interface type of class, the attributes are the controls (or fields) on the screen or form. • The methods would be those that work with the screen, such as submit or reset. • They might also be Java. Script for a Web page, because the code works directly with the Web page. • If the class is a control class, the attributes would be those needed to implement the class, such as variables used just in the control class. • The methods would be those used to perform calculations, make decisions, and send messages to other classes.

• If the class is an entity class, the attributes represent those stored for the entity and the methods working directly with the entity, such as creating a new instance, modifying, deleting, obtaining, or printing. • Web sites may use a combination of many different classes to accomplish user objectives. • For example, a Web site may use Java. Script to prevalidate data, then pass data to the server control classes, which perform thorough validation, including obtaining data. • The server control classes may in turn send Java. Script back to the Web page to do some formatting.

1. Relationships • Another way to enhance class diagrams is to show relationships. Relationships are connections between classes, similar to those found on an entity-relationship diagram. • These are shown as lines connecting classes on a class diagram. • There are two categories of relationships: associations and whole/part relationships.
ASSOCIATIONS 2)WHOLE/PART RELATIONSHIPS")
1. Relationships: 1)ASSOCIATIONS 2)WHOLE/PART RELATIONSHIPS
 Association • The simplest type of relationship is an association, or a structural")
1) Association • The simplest type of relationship is an association, or a structural connection between classes or objects. • Associations are shown as a simple line on a class diagram. • The end points of the line are labeled with a symbol indicating the multiplicity, which is the same as cardinality on an entity-relationship diagram. • A zero represents none, a one represents one and only one, and an asterisk represents many. • The notation 0. . 1 represents from zero to one, and the notation 1. . * represents from one to many.

Gambar Asosiasi objek/Kelas dan Notasi Multiplicity

FIGURE 10. 17 Types of associations that may occur in class diagrams.
 mempunyai satu dan hanya satu")
Penjelasan Figure 10. 17: • Mahasiswa Lulusan (Graduate Student) mempunyai satu dan hanya satu Thesis. • Thesis dipunyai satu dan hanya satu Mahasiswa Lulusan (Graduate Student). • Mahasiswa (Student) daftar paling sedikit satu matakuliah (Course) sampai beberapa matakuliah. • Matakuliah (Course) didaftar satu dan hanya satu Mahasiswa(Student). • Mahasiswa(Student) dapat tidak menempati Ruang Asrama (Dorm Room) sampai beberapa kali. • Ruang Asrama (Dorm Room) ditempati satu dan hanya satu Mahasiswa(Student). • Mahasiswa(Student) dapat tidak berpartisipasi dalam Kegiatan Sukarela (Volunteer Activity) sampai beberapa kali.

• Class diagrams do not restrict the lower limit for an association. • For example, an association might be 5. . *, indicating that a minimum of five must be present. The same is true for upper limits. • For example, the number of courses a student is currently enrolled in may be 1. . 10, representing from 1 to 10 courses. It can also include a range of values separated by commas, such as 2, 3, 4. • In the UML model, associations are usually labeled with a descriptive name.

• Association classes are those that are used to break up a many-to-many association between classes. • These are similar to associative entities on an entity-relationship diagram. • Student and Course have a many-tomany relationship, which is resolved by adding an association class called Section between the classes of Student and Course. • Figure 10. 18 illustrates an association class called Section, shown with a dotted

• An object in a class may have a relationship to other objects in the same class, called a reflexive association. • An example would be a task having a precedent task, or an employee supervising another employee. • This is shown as an association line connecting the class to itself, with labels indicating the role names, such as task and precedent task.

FIGURE 10. 18. An example of an associative class in which a particular section defines the relationship between a student and a course.
 WHOLE/PART RELATIONSHIPS • Whole/part relationships are when one class represents the whole object")
2) WHOLE/PART RELATIONSHIPS • Whole/part relationships are when one class represents the whole object and other classes represent parts. • The whole acts as a container for the parts. • These relationships are shown on a class diagram by a line with a diamond on one end. • The diamond is connected to the object that is the whole. • Whole/part relationships (as well as aggregation, discussed later) are shown in

FIGURE 10. 19. An example of whole/part and aggregation relationships.
 WHOLE/PART RELATIONSHIPS • A whole/part relationship may be an entity object that has")
2) WHOLE/PART RELATIONSHIPS • A whole/part relationship may be an entity object that has distinct parts, such as a computer system that includes the computer, printer, display, and so on, or an automobile that has an engine, brake system, transmission, and so on. • Whole/part relationships may also be used to describe a user interface, in which one GUI screen contains a series of objects such as lists, boxes, or radio buttons, or perhaps a header, body, and footer area. • Whole/part relationships have three categories: aggregation, collection, and composition.
 WHOLE/PART RELATIONSHIPS a)Aggregation b)Collection c)Composition")
2) WHOLE/PART RELATIONSHIPS a)Aggregation b)Collection c)Composition
 Aggregation • An aggregation is often described as a “has a” relationship. •")
a) Aggregation • An aggregation is often described as a “has a” relationship. • Aggregation provides a means of showing that the whole object is composed of the sum of its parts (other objects). • In the student enrollment example, the department has a course and the course is for a department. • This is a weaker relationship, because a department may be changed or removed and the course may still exist. • A computer package may not be available any longer, but the printers and other components still exist. • The diamond at the end of the relationship line is not
 Collection • A collection consists of a whole and its members. • This")
b) Collection • A collection consists of a whole and its members. • This may be a voting district with voters or a library with books. • The voters or books may change, but the whole retains its identity.
Composition • Composition, a whole/part relationship in which the whole has a responsibility for")
c)Composition • Composition, a whole/part relationship in which the whole has a responsibility for the part, is a stronger relationship, and is usually shown with a filled-in diamond. • Keywords for composition are one class “always contains” another class. If the whole is deleted, all parts are deleted. • An example would be an insurance policy with riders. • If the policy is canceled, the insurance riders are also canceled. • In a database, the referential integrity would be set to delete cascading child records. • In a university there is a composition relationship between a course and an assignment as well as between a course and an exam. • If the course is deleted, assignments and exams are deleted as well.
 Diagrams • A generalization/specialization (gen/spec) diagram may be considered to be")
2. Generalization/Specialization (Gen/Spec) Diagrams • A generalization/specialization (gen/spec) diagram may be considered to be an enhanced class diagram. • Sometimes it is necessary to separate out the generalizations from the specific instances. • As we mentioned at the beginning of this chapter, a koala bear is part of a class of marsupials, • which is part of a class of animals. Sometimes we need to distinguish whether a koala bear is an • animal or a koala bear is a type of animal. Furthermore, a koala bear can be a stuffed toy animal. • So we often need to clarify these subtleties.
 Diagrams a) b) c) d) e) f) g) h) GENERALIZATION INHERITANCE")
2. Generalization/Specialization (Gen/Spec) Diagrams a) b) c) d) e) f) g) h) GENERALIZATION INHERITANCE POLYMORPHISM ABSTRACT CLASSES IDENTIFYING ABSTRACT CLASSES FINDING CLASSES DETERMINING CLASS METHODS MESSAGES
 GENERALIZATION • A generalization describes a relationship between a general kind of thing")
a) GENERALIZATION • A generalization describes a relationship between a general kind of thing and a more specific kind of thing. • This type of relationship is often described as an “is a” relationship. • For example, a car is a vehicle and a truck is a vehicle. • In this case, vehicle is the general thing, whereas car and truck are the more specific things. • Generalization relationships are used for modeling class inheritance and specialization. • A general class is sometimes called a superclass,
 INHERITANCE • Several classes may have the same attributes and/or methods. • When")
b) INHERITANCE • Several classes may have the same attributes and/or methods. • When this occurs, a general class is created containing the common attributes and methods. • The specialized class inherits or receives the attributes and methods of the general class. In addition, the specialized class has attributes and methods that are unique and only defined in the specialized class. • Creating generalized classes and allowing the specialized class to inherit the attributes and methods helps to foster reuse, because the code is used many times. It also helps to maintain existing program code. • This allows the analyst to define attributes and methods once but use them many times, in each inherited class. • One of the special features of the object-oriented approach is the creation and maintenance of large class libraries that are available in multiple languages. • So, for instance, a programmer using Java, . NET, or C# will have access to a huge number of classes that have already been developed.
 POLYMORPHISM • Polymorphism (meaning many forms), or method overriding (not the same as")
c) POLYMORPHISM • Polymorphism (meaning many forms), or method overriding (not the same as method overloading), is the capability of an object-oriented program to have several versions of the same method with the same name within a superclass/subclass relationship. • The subclass inherits a parent method but may add to it or modify it. The subclass may change the type of data, or change how the method works. • For example, there might be a customer who receives an additional volume discount, and the method for calculating an order total is modified. • The subclass method is said to override the superclass method. • When attributes or methods are defined more than once, the most specific one (the lowest in the class hierarchy) is used. • The compiled program walks up the chain of classes, looking for methods.
 ABSTRACT CLASSES • Abstract classes are general classes and are used when gen/spec")
d) ABSTRACT CLASSES • Abstract classes are general classes and are used when gen/spec is included in the design. • The general class becomes the abstract class. The abstract class has no direct objects or class instances, and is only used in conjunction with specialized classes. • Abstract classes usually have attributes and may have a few methods. • Figure 10. 20 is an example of a gen/spec class diagram. The arrow points to the general class, or superclass. • Often the lines connecting two or more subclasses to a superclass are joined using one arrow pointing to the superclass, but these could be shown as separate arrows as well. • Notice that the top level is Person, representing any person. • The attributes describe qualities that all people at a university have. • The methods allow the class to change the name and the

FIGURE 10. 20 A gen/spec diagram is a refined form of a class diagram.

• Student and Employee are subclasses, because they have different attributes and methods. • An employee does not have a grade point average and a student does not have a salary. This is a simple version, and does not include employees that are students and students that work for the university. • If these were added, they would be subclasses of the Employee and Student classes. • Employee has two subclasses, Faculty and Administrator, because there are different attributes and methods for each of these specialized classes. • Subclasses have special verbs to define them. These are often run-on words, using isa for “is a, ” isakinda for “is a kind of, ” and canbea for “can be a. ” There is no distinction between “is a” and “is an; ” they both use isa.
 IDENTIFYING ABSTRACT CLASSES • You may be able to identify abstract classes by")
e) IDENTIFYING ABSTRACT CLASSES • You may be able to identify abstract classes by looking to see if a number of classes or database tables have the same elements, or if a number of classes have the same methods. • You can create a general class by pulling out the common attributes and methods, or you might create a specialized class for the unique attributes and methods. • Using a banking example, such as a withdrawal, a payment on a loan, or a check written, will all have the same method—they subtract money from the customer balance.
 FINDING CLASSES • There a number of ways to determine classes. They may")
f) FINDING CLASSES • There a number of ways to determine classes. They may be discovered during interviewing or JAD sessions (described in Chapter 4), during facilitated team sessions, or from brainstorming sessions. • Analyzing documents and memos may also reveal classes. One of the easiest ways is to use the CRC method described previously in this chapter. • The analyst should also examine use cases, looking for nouns. Each noun may lead to a candidate, or potential, class. • They are called candidate classes because some of the nouns may be attributes of a class. • Each class should exist for a distinct object that has a clear definition. Ask what the class knows, the attributes; and what the class knows how to do, the methods. • Identify class relationships and the multiplicity for each end of the relationship. • If the relationship is many-to-many, create an intersection or associative class, similar to the associative entity in an entity-relationship diagram.
 DETERMINING CLASS METHODS • The analyst must determine class attributes and methods. •")
g) DETERMINING CLASS METHODS • The analyst must determine class attributes and methods. • Attributes are easy to identify, but the methods that work with the attributes may be more difficult. Some of the methods are standard, and are always associated with a class, such as new(), or the «create» method, which is an extension to UML created by a person or organization, called a stereotype. • The « » symbols are not simply pairs of greater than and less than symbols, but are called guillemots or chevrons. • Another useful way to determine methods is to examine a CRUD matrix (see Chapter 7). • Figure 10. 21 illustrates a CRUD matrix for course offerings. Each letter requires a different method. • If there is a C for create, add a new() method. If there is a U for update, add an update() or change() method. If there is a D for delete, add a delete() or remove() method. • If there is an R for read, add methods for finding, viewing, or printing. • In the example shown, the textbook class would need a create method to add a textbook, and a read method to initiate a course inquiry, change a textbook, or find a textbook. • If a textbook was replaced, an update method would be needed, and if a textbook was removed, a delete method would be required.

FIGURE 10. 21. A CRUD matrix can be used to help determine what methods are needed. This CRUD matrix is used to determine the methods and operations for course offerings.
 MESSAGE • In order to accomplish useful work, most classes need to communicate")
h) MESSAGE • In order to accomplish useful work, most classes need to communicate with one another. • Information can be sent by an object in one class to an object in another class using a message, similar to a call in a traditional programming language. • A message also acts as a command, telling the receiving class to do something. A message consists of the name of the method in the receiving class, as well as the attributes (parameters or arguments) that are passed with the method name. • The receiving class must have a method corresponding to the message name. • Since messages are sent from one class to another, they may be thought of as an output or an input. • The first class must supply the parameters included with the message and the second class uses the parameters. If a physical child data flow diagram exists for the problem domain, it may help to discover methods.

STATECHART DIAGRAMS • The statechart, or state transition, diagram is another way to determine class methods. • It is used to examine the different states that an object may have. • A statechart diagram is created for a single class. Typically objects are created, go through changes, and are deleted or removed. • Objects exist in these various states, which are the conditions of an object at a specific time. • An object’s attribute values define the state that the object is in, and sometimes there is an attribute, such as Order Status (pending, picking, packaged, shipped, received, and so on) that indicates the state. A state has a name with each word capitalized. • The name should be unique and meaningful to the users. • A state also has entry and exit actions, the things the object must do every time it enters or leaves a given state.

• An event is something that happens at a specific time and place. Events cause a change of the object state, and it is said that a transition “fires. ” • States separate events, such as an order that is waiting to be filled, and events separate states, such as an Order Received event or an Order Complete event. • An event causes the transition, and happens when a guard condition has been met. A guard condition is something that evaluates to either true or false, and may be as simple as “Click to confirm order. ” • It also may be a condition that occurs in a method, such as an item that is out of stock. • Guard conditions are shown in square brackets next to the event label. • There also deferred events, or events that are held until an object changes to a state that can accept them. • A user keying something in when a word processor is

Events fall categories: into three different • Signals or asynchronous messages, which occur when the calling program does not wait for a returning message, such as a feature run from a menu. • Synchronous messages, which are calls to functions or subroutines. The calling object stops and waits for control to be returned to it, along with an optional message. • Temporal events, which occur at a predetermined time. These usually do not involve an actor or any external event.

• Material objects have persistence; that is, they exist for a long period of time. • Airplane flights, concerts, and sporting events have shorter persistence (they may have states that transition in a shorter time). • Some objects, called transient objects, do not survive the end of a session. • These include main memory, Web URL (or location) data, Web pages, CICS displays, and so on. • The only way to save transient objects is to store information about them, such as storing Web data in a cookie.

• Each time an object changes state, some of the attributes change their values. • Furthermore, each time an object’s attributes change, there must be a method to change the attributes. • Each of the methods would need a display or. Web form to add or change the attributes. • These become the interface objects. • The display or. Web form would often have more controls (or fields) on them than just the attributes that change. • They would usually have primary keys, identifying information (such as a name or address), and other attributes that are needed for a good user interface. • The exception is a temporal event, which may use database tables or a queue containing the information.

STATECHART DIAGRAMS • A State Transition Example

A State Transition Example • Consider a student enrolling at a university and the various states that he or she would go through. • Three of the states are listed below in detail:

• The other states are Program Student, Current Student, Continuing Student, and Graduated Student. • Each state would have an event, methods, attributes changed, and a user interface associated with it. • This series of states can be used to determine the attributes and methods that make up part of the class. • The states and events that trigger the changes may be represented on a statechart diagram (or a state transition diagram). • The statechart diagram for Student is illustrated in Figure 10. 22. • States are represented by rectangles, and events or activities are the arrows that link the states and cause one state to change to another state. • Transition events are named in the past tense, because they have already occurred to create the transition.

FIGURE 10. 22. A statechart diagram showing how a student progresses from a potential student to a graduated student.
 A")
Statechart diagrams are not created for all classes. They are created when: 1) A class has a complex life cycle. 2) An instance of a class may update its attributes in a number of ways through the life cycle. 3) A class has an operational life cycle. 4) Two classes depend on each other. 5) The object’s current behavior depends on what happened previously.

• When you examine a statechart diagram, use the opportunity to look for errors and exceptions. • Inspect the diagram to see whether events are happening at the wrong time. • Also check that all events and states have been represented. • Statechart diagrams have only two problems to avoid. • Check to see that a state does not have all transitions going into the state or all transitions coming out of the state. • Each state should have at least one transition in and out of it.

PACKAGES AND OTHER UML ARTIFACTS • Packages are containers for other UML things, such as use cases or classes. • Packages can show system partitioning, indicating which classes or use cases are grouped into a subsystem, called logical packages. • They may also be component packages, which contain physical system components, or use case packages, containing a group of use cases. • Packages use a folder symbol with the package name either in the folder tab or centered in the folder. • Packaging can occur during systems analysis, or later when the system is being designed. • Packages may also have relationships, similar to class diagrams, which may include associations and inheritance.

• Figure 10. 23 is an example of a use case package diagram. It shows that four use cases, Add Student, Enroll in Class, Transfer Credits, and View Student Information, are part of the Student package. • There are three use cases, Add Faculty, View Faculty Information, and Assign Faculty to Course, that are part of the Faculty package. • As you continue constructing diagrams, you will want to make use of component diagrams, deployment diagrams, and annotational things. • These permit different perspectives on the work being accomplished.

FIGURE 10. 23. Use cases can be grouped into packages

• The component diagram is similar to a class diagram, but is more of a bird’s-eye view of the system architecture. • The component diagram shows the components of the system, such as a class file, a package, shared libraries, a database, and so on, and how they are related to each other. • The individual components in a component diagram are considered in more detail within other UML diagrams, such as class diagrams and use case diagrams. • The deployment diagram illustrates the physical implementation of the system, including the hardware, the relationships between the hardware, and the system on which it is deployed. • The deployment diagram may show servers, workstations, printers, and so on.

• Annotational things give developers more information about the system. • These consist of notes that can be attached to anything in UML: objects, behaviors, relationships, diagrams, or anything that requires detailed descriptions, assumptions, or any information relevant to the design and functionality of the system. • The success of UML relies on the complete and accurate documentation of your system model to provide as much information as possible to the development team. • Notes provide a source of common knowledge and understanding about your system to help put your developers on the same page. • Notes are shown as a paper symbol with a bent corner and a line connecting them to the area that needs elaboration.

PUTTING UML TO WORK • UML provides a useful toolset for systems analysis and design. • As with any product created with the help of tools, the value of UML deliverables in a project depends on the expertise with which the systems analyst wields the tools. • The analyst will initially use the UML toolset to break down the system requirements into a use case model and an object model. • The use case model describes the use cases and actors. • The object model describes the objects and object associations, and the responsibilities,

1. Define the use case model • Find the actors in the problem domain by reviewing the system requirements and interviewing some business experts. • Identify the major events initiated by the actors, and develop a set of primary use cases at a very high level that describe the events from the perspective of each actor. • Develop the use case diagrams to provide understanding of how the actors relate to the use cases that will define the system. • Refine the primary use cases to develop a detailed description of system functionality for each primary use case. Provide additional details by developing the use case scenarios that document the alternate flows of the primary use cases. • Review the use case scenarios with the business area

2. Continue UML diagramming to model the system during the systems analysis phase. • Derive activity diagrams from use case diagrams. • Develop sequence and communication diagrams from use case scenarios. • Review the sequence diagrams with the business area experts to verify processes and interactions. • Make modifications as necessary until the business area experts agree that the sequence diagrams are complete and accurate. • This additional review of the graphical sequence diagrams often provides the business area experts an opportunity to rethink and refine processes in more atomic detail than the review of the use case scenarios.

3. Develop diagrams the class • Look for nouns in use cases and list them. They are potential objects. Once you identify the objects, look for similarities and differences in the objects due to the objects’ states or behavior, and then create classes. • Define the major relationships between the classes. Look for “has a” and “is a” relationships between classes. • Examine use case and sequence diagrams in order to determine classes. • Beginning with the use cases that are the most important to the system design, create class diagrams that show the classes and relationships that exist in the use cases. • One class diagram may represent the classes and relationships described in several related use cases.

4. Draw statechart diagrams • Develop statechart diagrams for certain class diagrams to provide further analysis of the system at this point. Use statechart diagrams to aid in understanding complex processes that cannot be fully derived by the sequence diagrams. • Determine methods by examining statechart diagrams. Derive state (data) class attributes from use cases, business area experts, and class methods. Indicate whether the methods and attributes of the class are public (accessible externally) or private (internal to the class). The statechart diagrams are extremely useful in

5. Begin systems design by refining UML diagrams and using them to derive classes and their attributes and methods. • Review all existing UML diagrams for the system. Write class specifications for each class that include the class attributes, methods, and their descriptions. Review sequence diagrams to identify other class methods. • Develop methods specifications that detail the input and output requirements for the method, along with a detailed description of the internal processing of the method. • Create another set of sequence diagrams (if necessary) to reflect the actual class methods and interactions with each other and the system interfaces. • Create class diagrams using the specialized class symbols for boundary or interface class, entity class, and control class. • Analyze the class diagrams to derive the system components; that is, functionally and logically related classes that will be compiled and deployed together as a. DLL, a. COM object, a Java Bean, a package, and so forth. • Develop deployment diagrams to indicate how your system

6. Document your system design in detail. This step is critical. The more complete the information you provide the development team through documentation and UML diagrams, the faster the development and the more solid the final production system.

THE IMPORTANCE OF USING UML FOR MODELING • UML is a powerful tool that can greatly improve the quality of your systems analysis and design, and it is hoped that the improved practices will translate into higher-quality systems. • By using UML iteratively in analysis and design, you can achieve a greater understanding between the business team and the IT team regarding the system requirements and the processes that need to occur in the system to meet those requirements. • The first iteration of analysis should be at a very high level to identify the overall system objectives and validate the requirements through use case analysis. Identifying the actors and defining the initial use case model are part of this first iteration. Subsequent iterations of analysis further refine the system requirements through the development of use case scenarios, class diagrams, sequence diagrams, statechart diagrams, and so on. • Each iteration takes a successively more detailed look at the design of the system until the things and relationships in the system are clearly and precisely defined in UML documents.

• When your analysis and design are complete, you should have an accurate and detailed set of specifications for the classes, scenarios, activities, and sequencing in the system. • In general, you can relate thoroughness of the analysis and design of a system to the amount of time required to develop the system and the resultant quality of the delivered product. • Often overlooked in the development of a new system is that the further a project progresses, the costlier the changes are to the business requirements of a system. • Changing the design of a system using a CASE tool, or even on paper, during the analysis and design phases of a project is easier, faster, and much less expensive than doing so during the development phase of the project. • Unfortunately, some employers are shortsighted, believing that only when a programmer or analyst is coding is that employee actually working. • Some employers erroneously assume that programmer productivity can be judged solely by the amount of code produced, without recognizing that diagramming ultimately saves time and money that might otherwise be wasted if a project is prototyped without proper

• An analogy to building a house is very apt in this situation. • Although you hire a builder to build a house, you do not want to live in a structure built without planning, one in which rooms and features are randomly added without regard to function or cost. • You want a builder to build your agreed-upon design from blueprints containing specifications that have been carefully reviewed by everyone concerned. As a member of an analyst team so accurately observed, “Putting a project on paper before coding will wind up costing less in the long run. • It’s much cheaper to erase a diagram than it is to change coding. ” • When business requirements change during the analysis phase, you may have to redraw some UML diagrams. • If the business requirements change during the development phase, however, a substantial amount of time and expense may be required to redesign, recode, and retest the system. • By confirming your analysis and design on paper (especially through the use of UML diagrams) with users who are business area experts, you help to ensure that correct business requirements will be met when the system is completed.
- Slides: 144