
OBJECTIVES q We will identify and analyze the
OBJECTIVES q We will identify and analyze the legal, health, and economic consequences associated with alcohol use. q. We will analyze statistical data and utilize critical thinking to evaluate the nature of impaired driving crash problems. q I will be able to identify the long and short term rewards and consequences of drinking alcohol, drug use, riding with a drunk driver, and driving after using alcohol or drugs. q I will be able to analyze statistical data from 2007 & 2013 and utilize critical thinking to evaluate and discuss why the alcohol related crashes in Virginia has increased or decreased.
Bell Ringer 1/13/2015 1. Grab your yellow book and the two sheets of paper (Signs & Markings; Interchanges & numbering) located in the front of the classroom. 2. Please work individually on this assignment for the next 10 -15 minutes. 3. Once you are done please get out something quite to do.
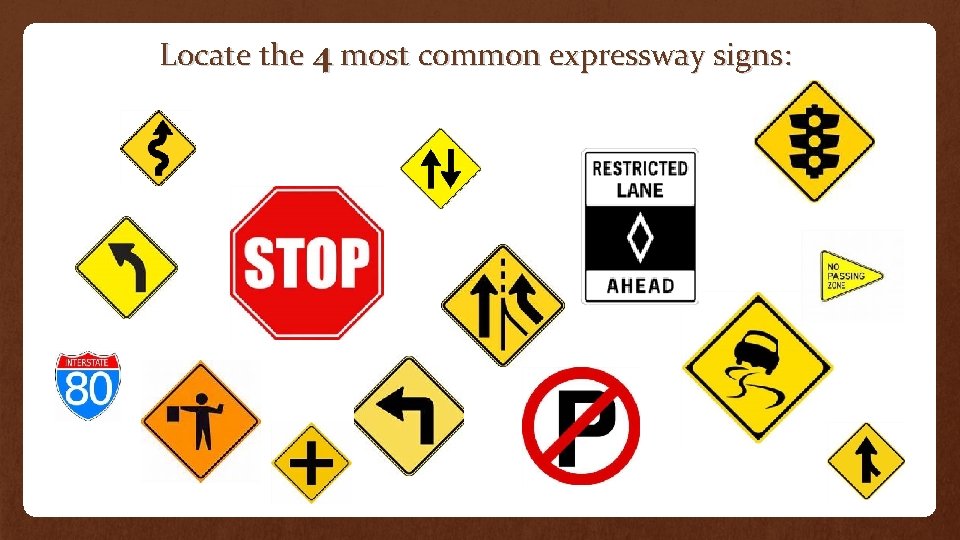
Locate the 4 most common expressway signs:
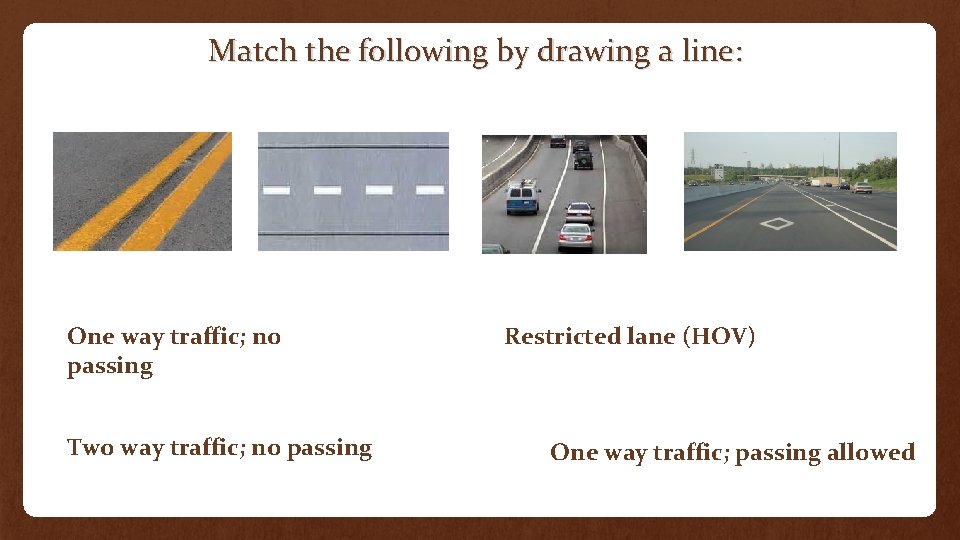
Match the following by drawing a line: One way traffic; no passing Two way traffic; no passing Restricted lane (HOV) One way traffic; passing allowed
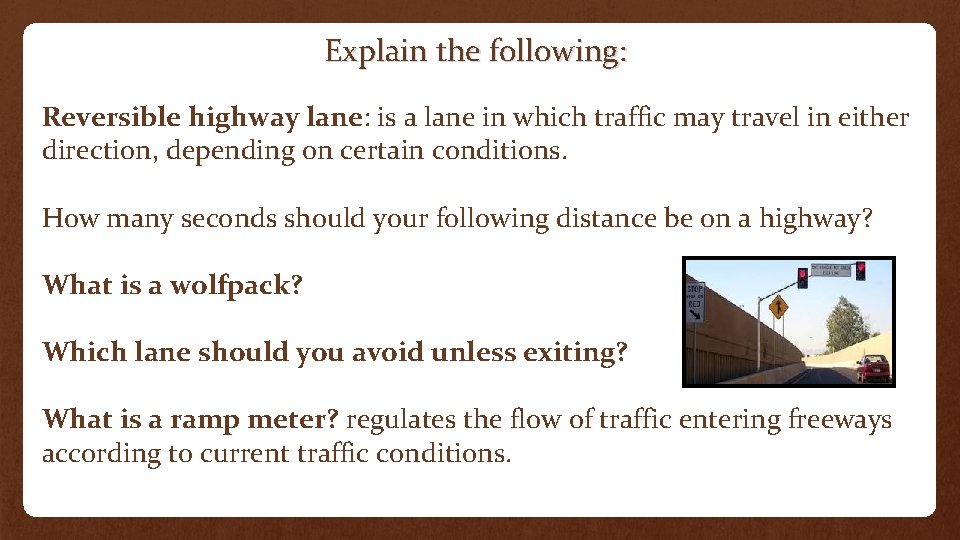
Explain the following: Reversible highway lane: is a lane in which traffic may travel in either direction, depending on certain conditions. How many seconds should your following distance be on a highway? What is a wolfpack? Which lane should you avoid unless exiting? What is a ramp meter? regulates the flow of traffic entering freeways according to current traffic conditions.
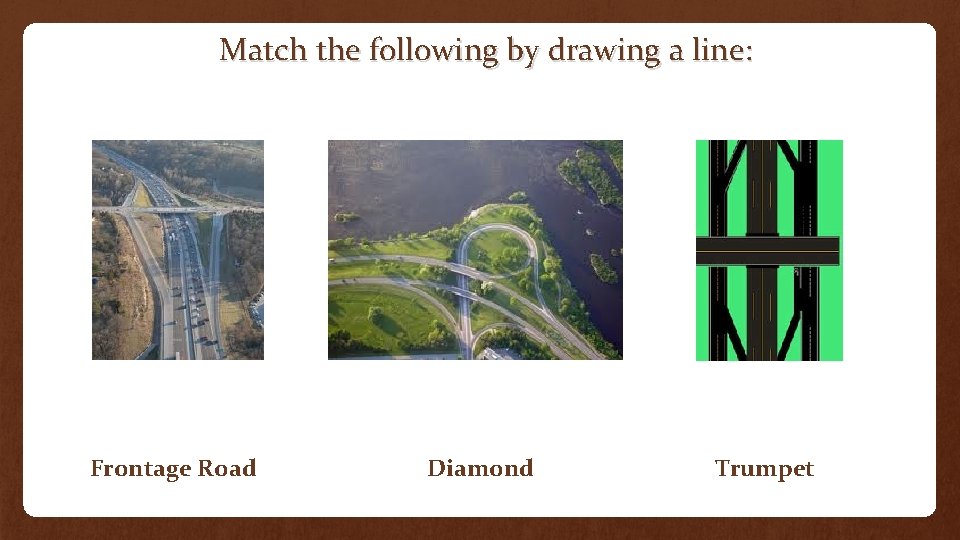
Match the following by drawing a line: Frontage Road Diamond Trumpet
Circle the correct answer: Even Expressway Numbers (I-64, I-66) go: a. West to East/East to West b. North to South/South to North Odd Expressway Numbers (I-81, I-95) go : a. West to East/East to West b. North to South/South to North 3 digit numbers designate an alternate route 495 is a route that goes ______ the city (I-495) 395 is a route that goes ______ the city (I-395)
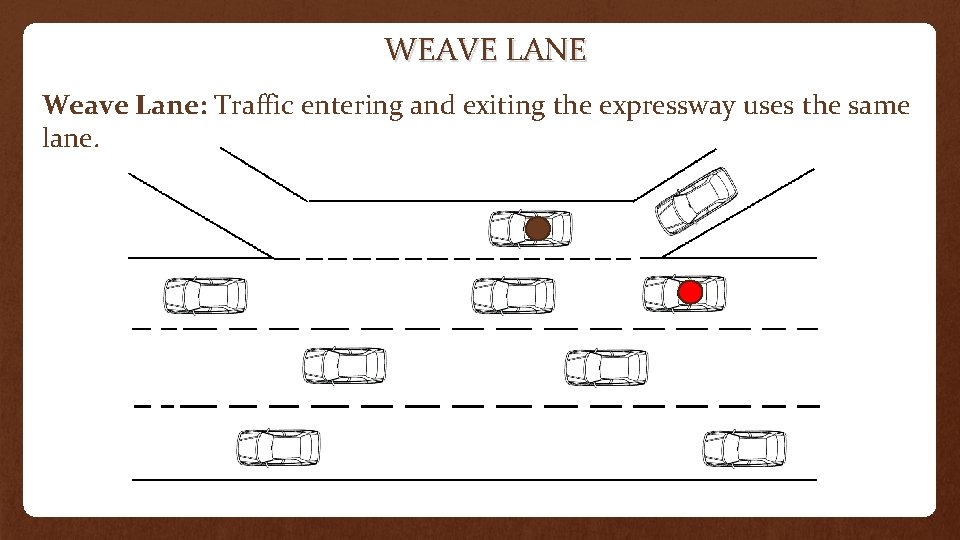
WEAVE LANE Weave Lane: Traffic entering and exiting the expressway uses the same lane.
“I killed a man” https: //www. youtube. com/watch? v=Eeo. IFWLbofk On the back of your worksheet write at least 4 to 5 complete sentences answering the questions below: • What's your opinion on drunk driving? • Do you feel that this clip changed or enhanced your opinion on drunk driving? • Do you feel that he should get a reduced sentence for making this video? Why or why not?
Module 7 TOPIC 1 ~ INTRODUCTION TO ALCOHOL ~
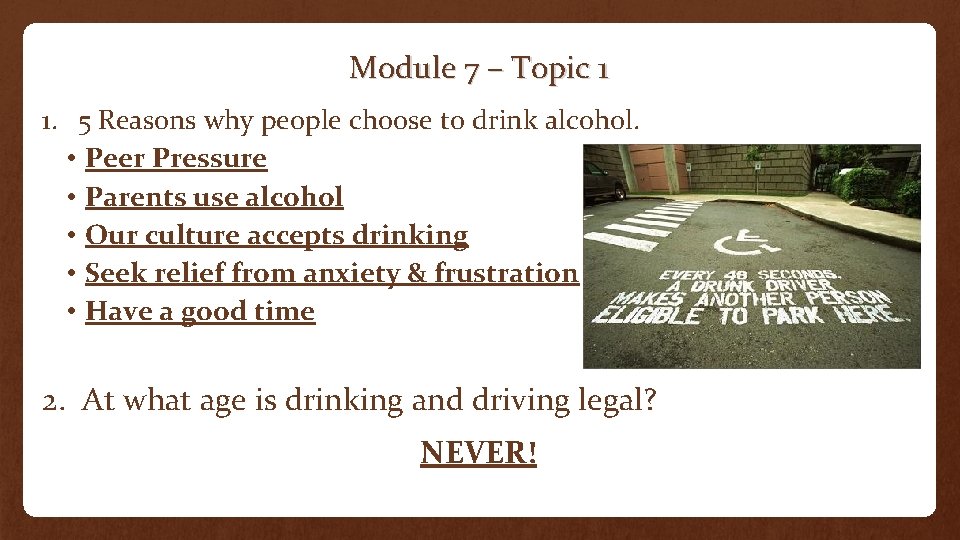
Module 7 – Topic 1 1. 5 Reasons why people choose to drink alcohol. • Peer Pressure • Parents use alcohol • Our culture accepts drinking • Seek relief from anxiety & frustration • Have a good time 2. At what age is drinking and driving legal? NEVER!
Module 7 – Topic 1 CLASS DISCUSSION 1. Get in a groups of 3 2. Your group will be assigned to a short/long term rewards or short/long term consequences for the following categories: • • Drinking Alcohol Drug Use Riding with a Drinking Driver Driving after using alcohol or drugs
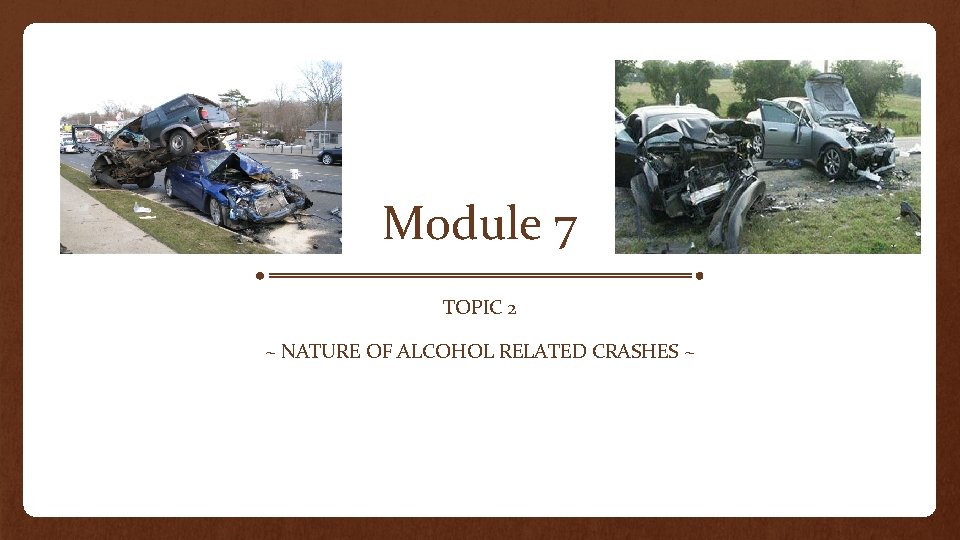
Module 7 TOPIC 2 ~ NATURE OF ALCOHOL RELATED CRASHES ~
Module 7 – Topic 2 1. Why are statistics for drug-related motor vehicle crashes often unavailable? Because of the lack of comprehensive and uniform testing and standardized impairment levels. 2. Fill in your chart. In order to find the numbers, follow the steps below: Step 1: Google Step 2: Type in the following: Virginia dmv crash facts Step 3: Click on the first link Step 4: Click on the 2013 PDF file
Module 7 – Topic 2 3. Why do you feel 1% of licensed drivers younger than 21 years old are more likely to get into a alcohol related car crash? Inexperienced driving and drinking
OBJECTIVES q We will identify and analyze the legal, health, and economic consequences associated with alcohol use. q. We will analyze statistical data and utilize critical thinking to evaluate the nature of impaired driving crash problems. q I will be able to identify the long and short term rewards and consequences of drinking alcohol, drug use, riding with a drunk driver, and driving after using alcohol or drugs. q I will be able to analyze statistical data from 2007 & 2013 and utilize critical thinking to evaluate and discuss why the alcohol related crashes in Virginia has increased or decreased.
- Slides: 16