Objectives for this Lesson Learn how scientists use

Objectives for this Lesson: § Learn how scientists use scientific methods § Understand how to use and read graphs

Vocabulary for this Lesson § § § § § Scientific Methods Hypothesis Controlled Experiment Data Independent Variable Dependent Variable Constant Control Group Experimental Group

The methods biologists use • The common steps that scientists use to gather information and answer questions are collectively known as scientific methods. § A scientific method is a planned, organized approach to solving a problem.

Steps of the Scientific Method 1. 2. 3. 4. 5. 6. 7. Identify the Problem. Research the Problem. Form a Hypothesis. Perform the Experiment. Collect Data. Draw Conclusions. Repeat.

Identify the Problem • Scientific methods usually begin with scientists identifying a problem to solve by observing the world around them. What you want to know or explain? Use observations you have made to write a question that addresses the problem or topics you want to investigate.

Research the Problem Scientists usually find all of the information that they can about a problem before attempting to do an experiment. Many times this includes reading about previous experiments on the problem identified.

Form a Hypothesis • A hypothesis is an explanation for a question or a problem that can be formally tested. • Hypothesizing is one of the methods most frequently used by scientists. • A hypothesis is not a random guess but is sometimes defined as an educated guess. What you think will happen? Predict the answer in your question or the outcome of the experiment.

Perform the Experiment • Eventually, the scientist may test a hypothesis by conducting an experiment. • The results of the experiment will help the scientist draw a conclusion about whether or not the hypothesis is correct. How will you test your hypothesis? Develop a procedure for a reliable experiment and address safety rules.

What is a controlled experiment? • Some experiments involve at least two groups: the control group and the experimental group. • The control is the group in which all conditions are kept the same. It is used as a comparison against the other groups. • The experimental group(s) is/are the test group, in which all conditions are kept the same except for the single condition being tested.

Designing an experiment • In a controlled experiment, only one condition is changed at a time. • The condition in an experiment that is changed is the independent variable, because it is the only variable that affects the outcome of the experiment. The independent variable is manipulated by the experimenter.

Designing an experiment • While changing the independent variable, the scientist observes or measures a secondition that results from the change. • This condition is the dependent variable, because any changes in it depend on changes made to the independent variable. The dependent variable is the factor that is measured or observed.

Other Variables All variables besides the independent variable must be kept the same in all groups in the experiment. These variables are called constants. Without constants the experimenter would not know which factor caused the change in the dependent variable.

Designing an experiment • Controlled experiments are most often used in laboratory settings. • However, not all investigations are controlled. • An investigation such as this, which has no control, is the type most often used in field work.

Collect Data • Information obtained from investigations is called data. • Often, data are in numerical form.

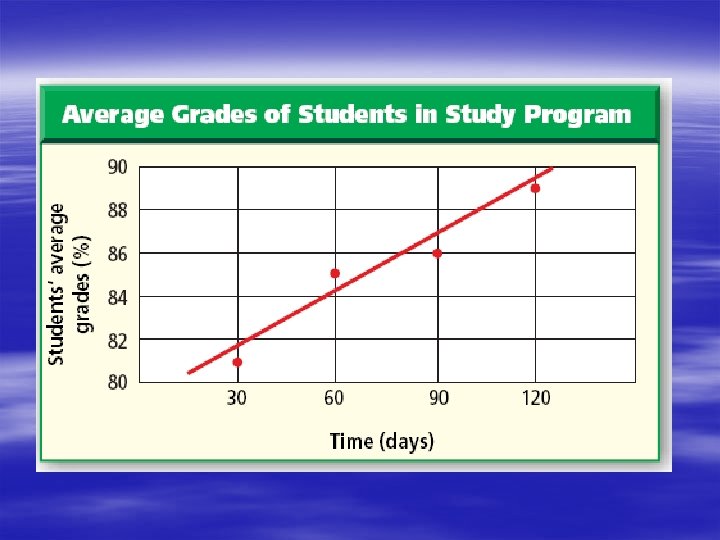
Quantitative information Number of paramecia surviving Paramecium Survival Rates Temperature § Graphs and tables communicate large amounts of data in a form that is easy to understand.

Graphs help the Scientist to Analyze the Data § Include a title. § Label x and y axis with a title and scale. (Draw a line out from the graph for each number on your scale. ) § Color multiple lines and bars. § Keep scale consistent. § Make your graph as large as possible. § Include a key.

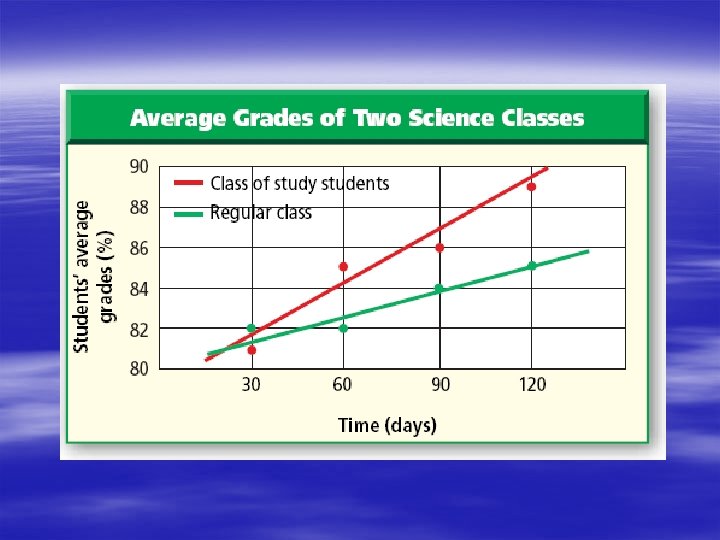
Line graph: § Shows continuous changing relationships between 2 variables § - x-axis is independent variable § - y-axis is the dependent variable § (Find the largest number for each axis to get started. Depending on your data you may or may not start your scale with zero. )

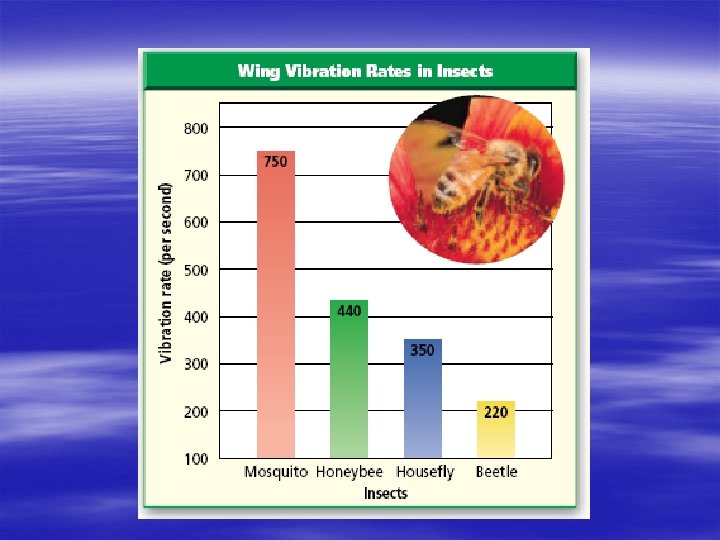
Bar Graph: § Shows comparison among discrete data in separate categories. This data does not continuously change.

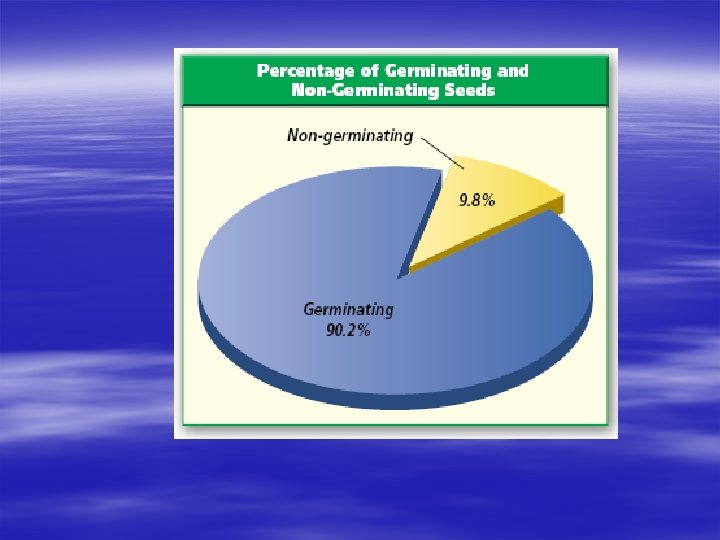
Circle Graph: § Shows sections that represent parts of the whole. § To determine the size of a sample in the graph divide the number or amount of that sample by the number or amount of the whole. Multiply by 360 and round to a whole number. § Title should be % of _______.

Draw Conclusions After careful review of the results, the scientist must come to a conclusion: • Ask yourself is the data reliable? Does your data and observations from the experiment support your hypothesis? Do you need to modify the experiment?

Repeat Verifying results • Is your data inaccurate or the experiment flawed? • Was the hypothesis supported by the data? • Are more data needed? • Do you need to modify the experiment? • When a hypothesis is supported by data from additional investigations, it is considered valid and is generally accepted by the scientific community.

Theories and laws • In science, a hypothesis that is supported by many separate observations and investigations, usually over a long period of time, becomes a theory. • A theory is an explanation of a natural phenomenon that is supported by a large body of scientific evidence obtained from many different investigations and observations.

Reporting results • Results and conclusions of investigations are reported in scientific journals, where they are available for examination by other scientists. • After results of an investigation have been published, other scientists can try to verify the results by repeating the procedure. • The knowledge obtained when scientists answer one question often generates other questions or proves useful in solving other problems.

Question 1 What is the difference between a hypothesis and an observation?

A hypothesis is an explanation for a question or problem and can be formally tested. An observation is something that has been noticed, often generating questions that lead to the formation of a hypothesis.

Question 2 A scientist conducts an experiment to test the effect of light on plant growth. In each experiment, three plants of the same variety are each given 10 m. L of water. One plant is exposed to full sunlight for 8 hours, one is exposed to full sunlight for 4 hours, and one plant is kept in a dark room. Plant height is measured after two weeks. What is the independent variable in this experiment?

Question 2 What is the independent variable in this experiment? A. soil volume B. amount of sunlight C. plant height D. amount of water

The answer is B. The independent variable is the condition that is changed. In this case, the amount of sunlight is changed for each plant. Plant heights are measured results of the experiment, so plant height is the dependent variable.

Question 3 Which of the following is the group in an experiment in which all conditions are kept the same? A. standard B. independent variable C. experimental D. control

The answer is D. Conditions are kept the same in the control group. The experimental group is the test group.
- Slides: 34