Objectives After completing this lesson you should be
Objectives After completing this lesson, you should be able to do the following: • Use the EXPLAIN PLAN command to show a statement is processed • Use the DBMS_XPLAN package • • • 6 -1 Use the Automatic Workload Repository Query the V$SQL_PLAN performance view Use the SQL*Plus AUTOTRACE setting to show SQL statement execution plans and statistics
What Is an Execution Plan? An execution plan is a set of steps that are performed by the optimizer in executing a SQL statement and performing an operation. 6 -2
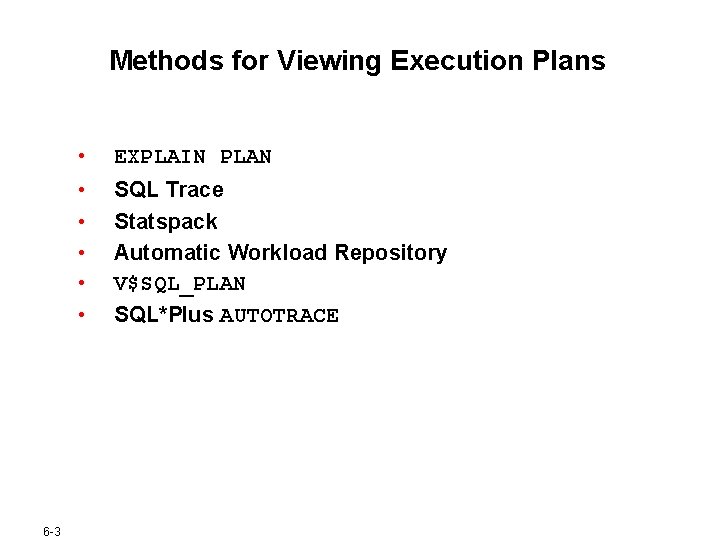
Methods for Viewing Execution Plans • • • 6 -3 EXPLAIN PLAN SQL Trace Statspack Automatic Workload Repository V$SQL_PLAN SQL*Plus AUTOTRACE
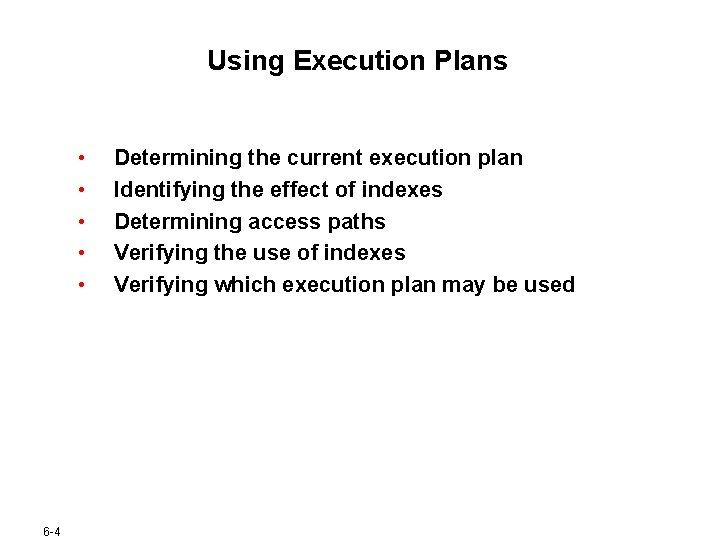
Using Execution Plans • • • 6 -4 Determining the current execution plan Identifying the effect of indexes Determining access paths Verifying the use of indexes Verifying which execution plan may be used
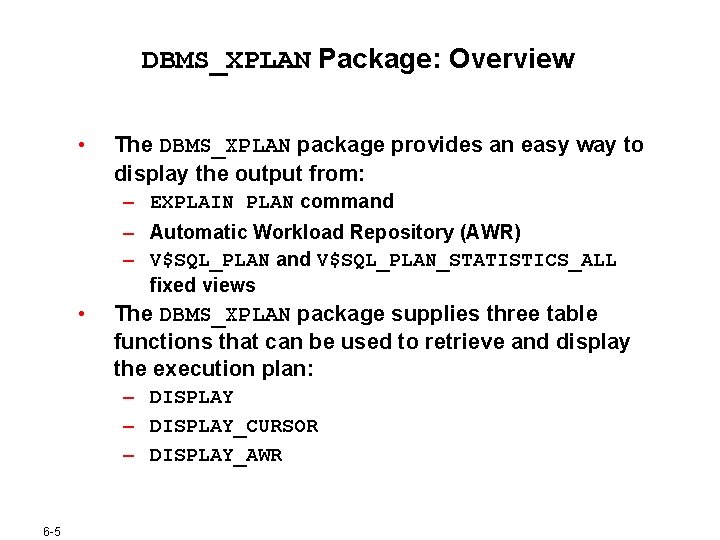
DBMS_XPLAN Package: Overview • The DBMS_XPLAN package provides an easy way to display the output from: – EXPLAIN PLAN command – Automatic Workload Repository (AWR) – V$SQL_PLAN and V$SQL_PLAN_STATISTICS_ALL fixed views • The DBMS_XPLAN package supplies three table functions that can be used to retrieve and display the execution plan: – DISPLAY_CURSOR – DISPLAY_AWR 6 -5
EXPLAIN PLAN Command • • • 6 -6 Generates an optimizer execution plan Stores the plan in the PLAN table Does not execute the statement itself
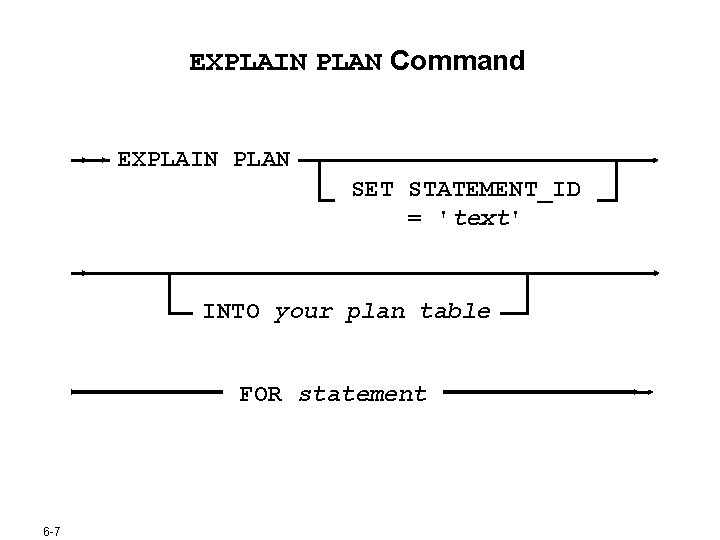
EXPLAIN PLAN Command EXPLAIN PLAN SET STATEMENT_ID = 'text' INTO your plan table FOR statement 6 -7
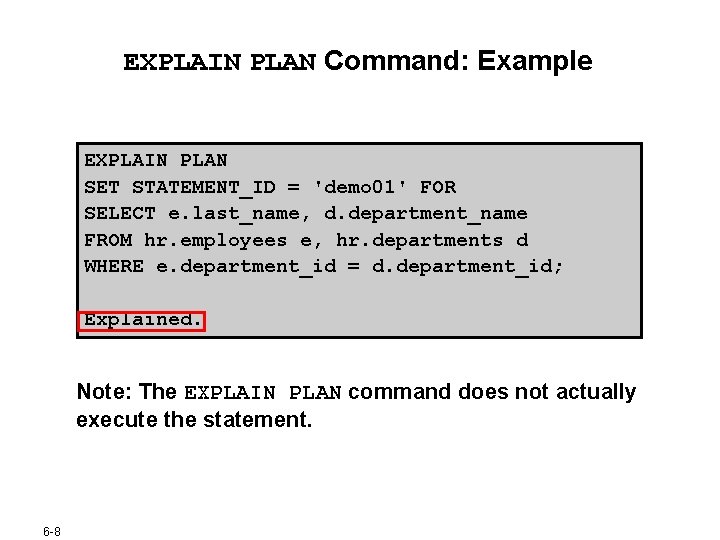
EXPLAIN PLAN Command: Example EXPLAIN PLAN SET STATEMENT_ID = 'demo 01' FOR SELECT e. last_name, d. department_name FROM hr. employees e, hr. departments d WHERE e. department_id = d. department_id; Explained. Note: The EXPLAIN PLAN command does not actually execute the statement. 6 -8
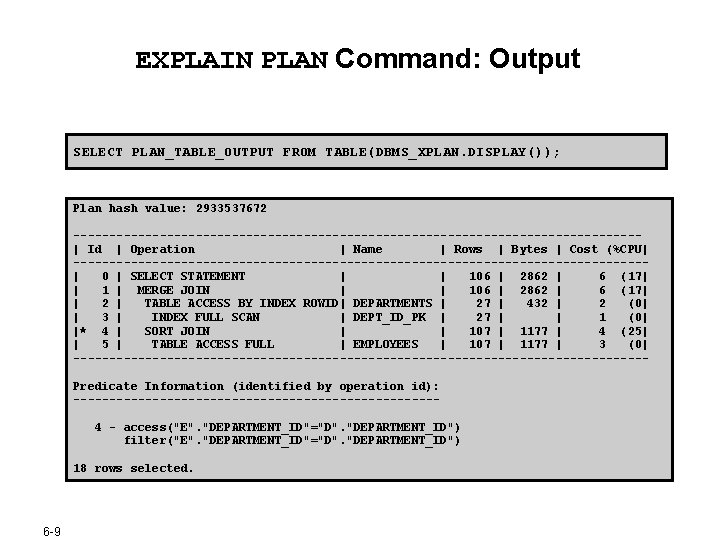
EXPLAIN PLAN Command: Output SELECT PLAN_TABLE_OUTPUT FROM TABLE(DBMS_XPLAN. DISPLAY()); Plan hash value: 2933537672 ---------------------------------------| Id | Operation | Name | Rows | Bytes | Cost (%CPU| ----------------------------------------| 0 | SELECT STATEMENT | | 106 | 2862 | 6 (17| | 1 | MERGE JOIN | | 106 | 2862 | 6 (17| | 2 | TABLE ACCESS BY INDEX ROWID| DEPARTMENTS | 27 | 432 | 2 (0| | 3 | INDEX FULL SCAN | DEPT_ID_PK | 27 | | 1 (0| |* 4 | SORT JOIN | | 107 | 1177 | 4 (25| | 5 | TABLE ACCESS FULL | EMPLOYEES | 107 | 1177 | 3 (0| ----------------------------------------Predicate Information (identified by operation id): -------------------------4 - access("E". "DEPARTMENT_ID"="D". "DEPARTMENT_ID") filter("E". "DEPARTMENT_ID"="D". "DEPARTMENT_ID") 18 rows selected. 6 -9
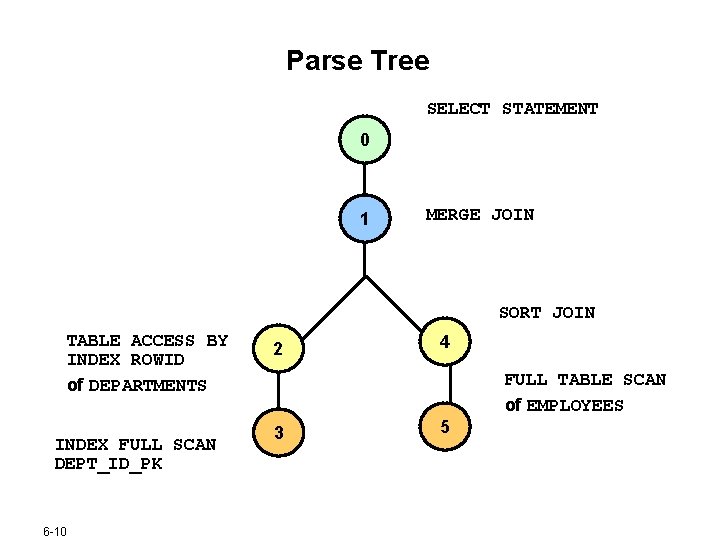
Parse Tree SELECT STATEMENT 0 1 MERGE JOIN SORT JOIN TABLE ACCESS BY INDEX ROWID of DEPARTMENTS INDEX FULL SCAN DEPT_ID_PK 6 -10 2 4 FULL TABLE SCAN of EMPLOYEES 3 5

Using the V$SQL_PLAN View • • V$SQL_PLAN provides a way of examining the execution plan for cursors that were recently executed. Information in V$SQL_PLAN is very similar to the output of an EXPLAIN PLAN statement: – EXPLAIN PLAN shows a theoretical plan that can be used if this statement were to be executed. – V$SQL_PLAN contains the actual plan used. 6 -11
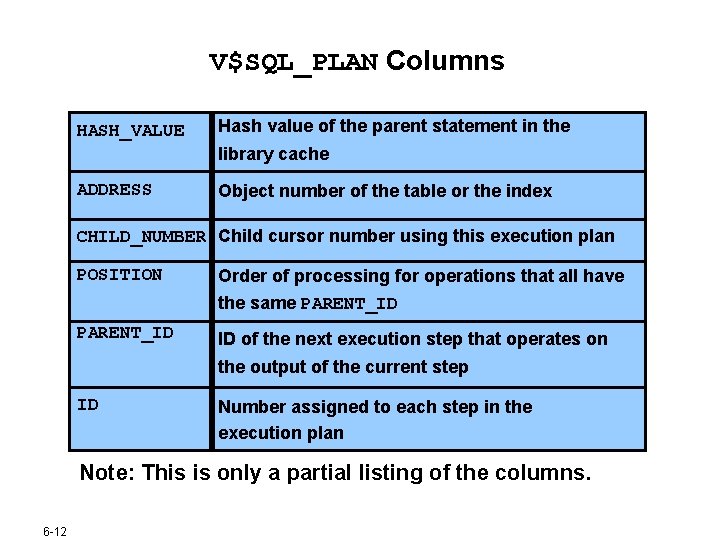
V$SQL_PLAN Columns HASH_VALUE Hash value of the parent statement in the library cache ADDRESS Object number of the table or the index CHILD_NUMBER Child cursor number using this execution plan POSITION Order of processing for operations that all have the same PARENT_ID ID of the next execution step that operates on the output of the current step ID Number assigned to each step in the execution plan Note: This is only a partial listing of the columns. 6 -12
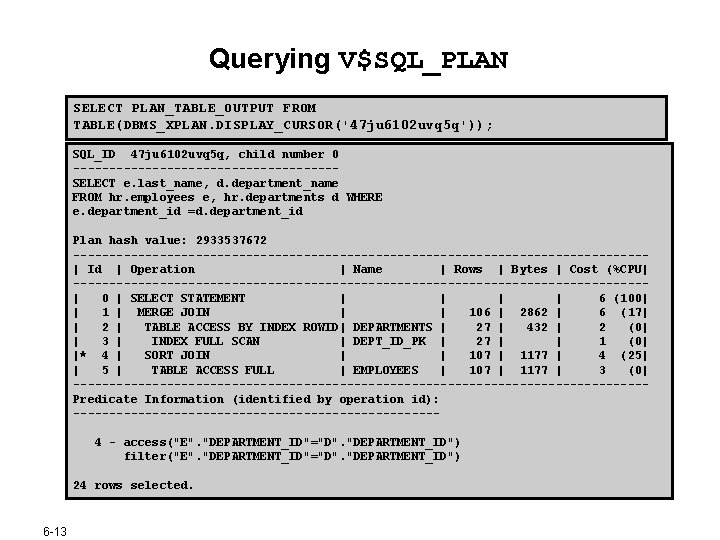
Querying V$SQL_PLAN SELECT PLAN_TABLE_OUTPUT FROM TABLE(DBMS_XPLAN. DISPLAY_CURSOR('47 ju 6102 uvq 5 q')); SQL_ID 47 ju 6102 uvq 5 q, child number 0 ------------------SELECT e. last_name, d. department_name FROM hr. employees e, hr. departments d WHERE e. department_id =d. department_id Plan hash value: 2933537672 ----------------------------------------| Id | Operation | Name | Rows | Bytes | Cost (%CPU| ----------------------------------------| 0 | SELECT STATEMENT | | 6 (100| | 1 | MERGE JOIN | | 106 | 2862 | 6 (17| | 2 | TABLE ACCESS BY INDEX ROWID| DEPARTMENTS | 27 | 432 | 2 (0| | 3 | INDEX FULL SCAN | DEPT_ID_PK | 27 | | 1 (0| |* 4 | SORT JOIN | | 107 | 1177 | 4 (25| | 5 | TABLE ACCESS FULL | EMPLOYEES | 107 | 1177 | 3 (0| ----------------------------------------Predicate Information (identified by operation id): -------------------------4 - access("E". "DEPARTMENT_ID"="D". "DEPARTMENT_ID") filter("E". "DEPARTMENT_ID"="D". "DEPARTMENT_ID") 24 rows selected. 6 -13

V$SQL_PLAN_STATISTICS View • • 6 -14 V$SQL_PLAN_STATISTICS provides actual execution statistics. V$SQL_PLAN_STATISTICS_ALL enables side-by-side comparisons of the optimizer estimates.
Automatic Workload Repository • • Collects, processes, and maintains performance statistics for problem-detection and self-tuning purposes Statistics include: – – • 6 -15 Object statistics Time-model statistics Some system and session statistics Active Session History (ASH) statistics Automatically generates snapshots of the performance data
Managing AWR with PL/SQL • • • 6 -16 Creating snapshots Dropping snapshots Managing snapshot settings
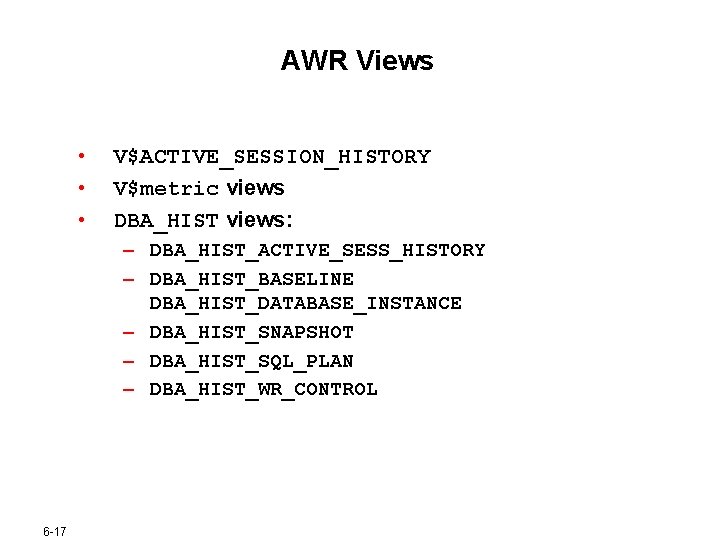
AWR Views • • • V$ACTIVE_SESSION_HISTORY V$metric views DBA_HIST views: – DBA_HIST_ACTIVE_SESS_HISTORY – DBA_HIST_BASELINE DBA_HIST_DATABASE_INSTANCE – DBA_HIST_SNAPSHOT – DBA_HIST_SQL_PLAN – DBA_HIST_WR_CONTROL 6 -17
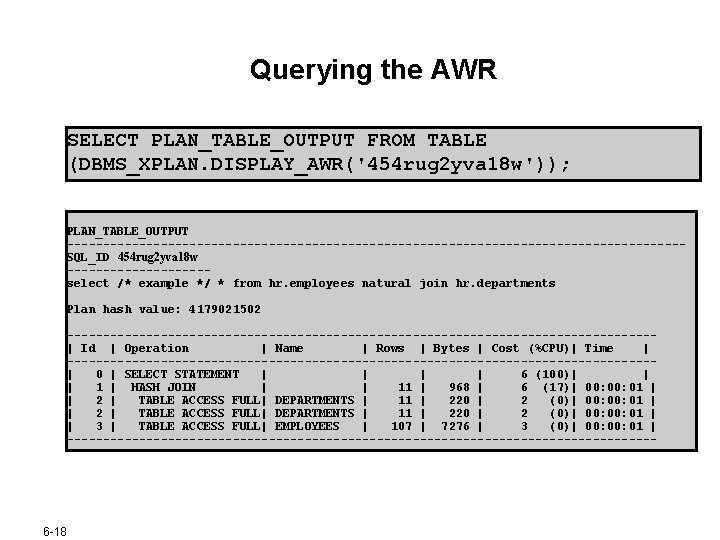
Querying the AWR SELECT PLAN_TABLE_OUTPUT FROM TABLE (DBMS_XPLAN. DISPLAY_AWR('454 rug 2 yva 18 w')); PLAN_TABLE_OUTPUT -------------------------------------------SQL_ID 454 rug 2 yva 18 w ----------select /* example */ * from hr. employees natural join hr. departments Plan hash value: 4179021502 -----------------------------------------| Id | Operation | Name | Rows | Bytes | Cost (%CPU)| Time | -----------------------------------------| 0 | SELECT STATEMENT | | 6 (100)| | | 1 | HASH JOIN | | 11 | 968 | 6 (17)| 00: 00: 01 | | 2 | TABLE ACCESS FULL| DEPARTMENTS | 11 | 220 | 2 (0)| 00: 01 | | 3 | TABLE ACCESS FULL| EMPLOYEES | 107 | 7276 | 3 (0)| 00: 01 | ----------------------------------------- 6 -18
![SQL*Plus AUTOTRACE OFF SET AUTOTRACE ON TRACE[ONLY] EXPLAIN STATISTICS SHOW AUTOTRACE 6 -19 SQL*Plus AUTOTRACE OFF SET AUTOTRACE ON TRACE[ONLY] EXPLAIN STATISTICS SHOW AUTOTRACE 6 -19](http://slidetodoc.com/presentation_image_h/021b5afe1ac9a9651f7d39ed264bc0e8/image-19.jpg)
SQL*Plus AUTOTRACE OFF SET AUTOTRACE ON TRACE[ONLY] EXPLAIN STATISTICS SHOW AUTOTRACE 6 -19
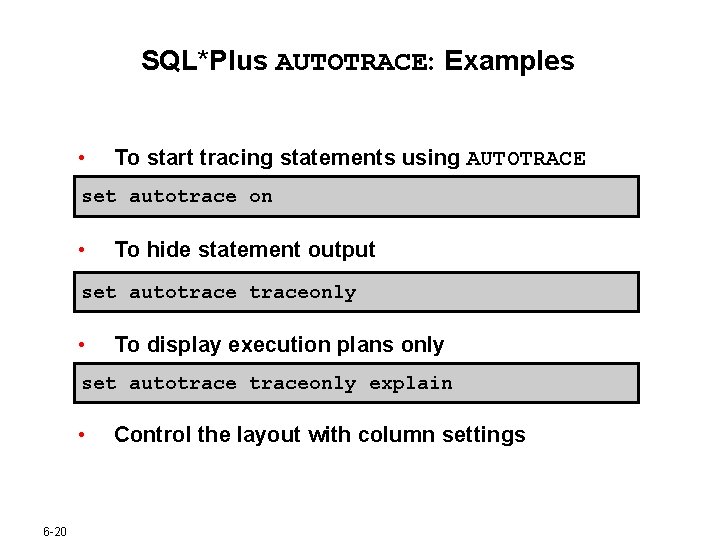
SQL*Plus AUTOTRACE: Examples • To start tracing statements using AUTOTRACE set autotrace on • To hide statement output set autotraceonly • To display execution plans only set autotraceonly explain • 6 -20 Control the layout with column settings
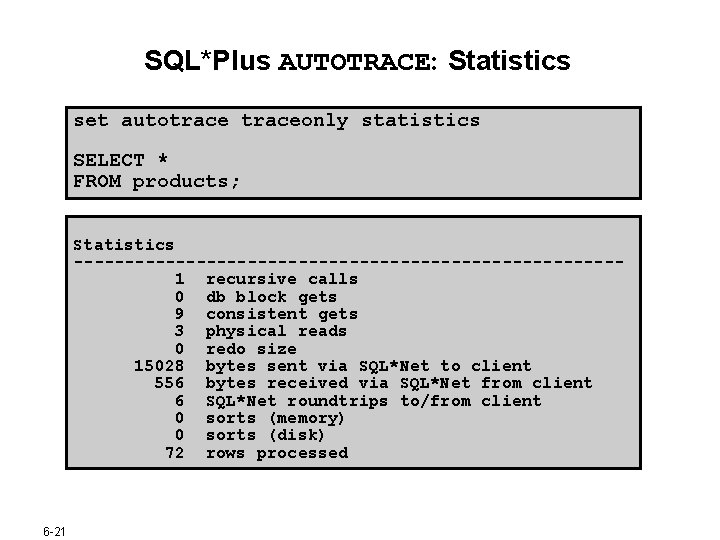
SQL*Plus AUTOTRACE: Statistics set autotraceonly statistics SELECT * FROM products; Statistics ---------------------------1 recursive calls 0 db block gets 9 consistent gets 3 physical reads 0 redo size 15028 bytes sent via SQL*Net to client 556 bytes received via SQL*Net from client 6 SQL*Net roundtrips to/from client 0 sorts (memory) 0 sorts (disk) 72 rows processed 6 -21
Summary In this lesson, you should have learned how to: • Use EXPLAIN PLAN to view execution plans • Query V$SQL_PLAN to see the execution plan for cursors that were recently executed • Use the Automatic Workload Repository • Use SQL*Plus AUTOTRACE to run statements and display execution plans and statistics 6 -22
- Slides: 22