Objectives 1 What is a reaction rate and

Objectives: 1. What is a reaction rate and how is it measured? 2. Does stoichiometry matter?

What is Kinetics? Kinetics is the study of the rate at which a reaction proceeds What is a “rate”? How fast can you drive? Miles per hour is a great example of a rate! ∆ distance = 70 mph = rate of travel ∆ time

Average rate vs instantaneous rate

Reactant X Reaction Rates Reactant X Product Y The speed of a reaction is monitored the same Product Y way that rate of travel is monitored in your car! Reactant X ∆ concentration = ∆ M = mol ∆t L • time ∆ time X Our first example: X Y X Product Y

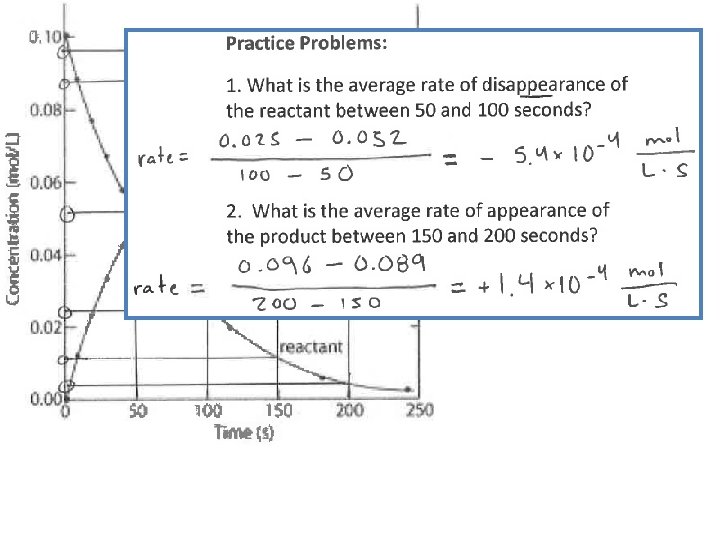
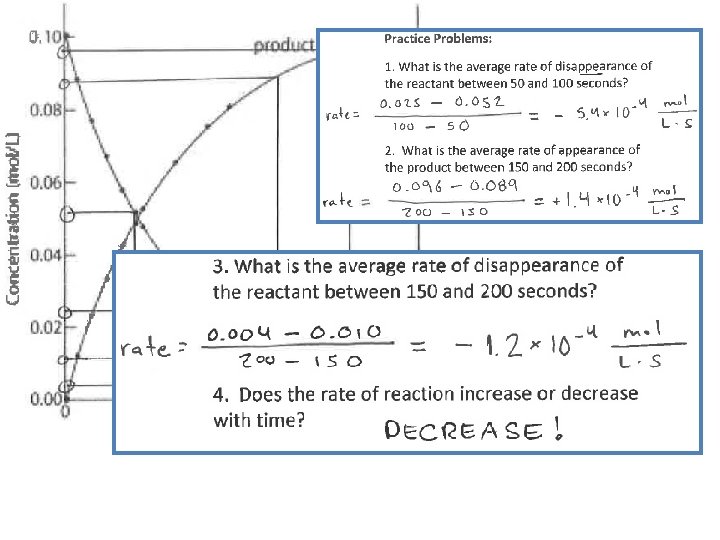
Reactant Concentration vs. Time Disappearance of reactant X For the equation: X Y What is the average “rate of disappearance” between 5 and 10 min?

Reactant Concentration vs. Time Disappearance of reactant X For the equation: X Y Instantaneous rates are normally used in chemistry.

Reactant Concentration vs. Time Disappearance of reactant X For the equation: X Y What is the rate of reaction at t = 10 minutes?

Reactant Concentration vs. Time Appearance of product Y For the equation: X Y Find the average “rate of appearance” of Y during the time interval of 10 – 15 minutes.

Reactant Concentration vs. Time Appearance of product Y For the equation: X Y Instantaneous rates would be found the same way (slope of tan line)

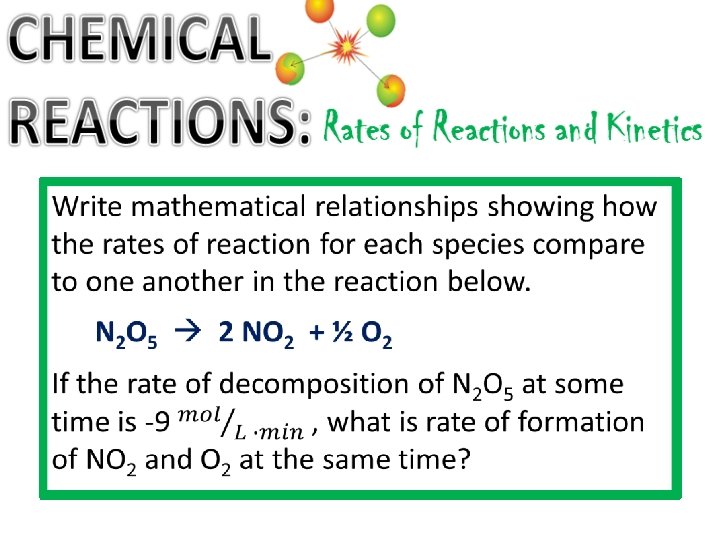
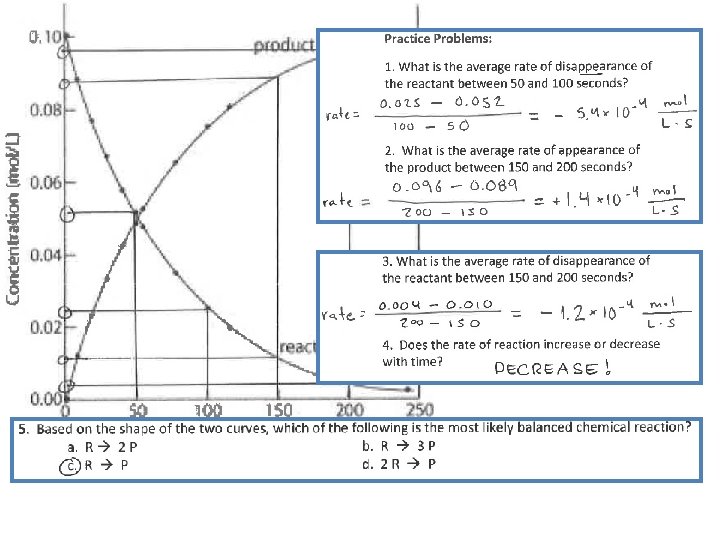
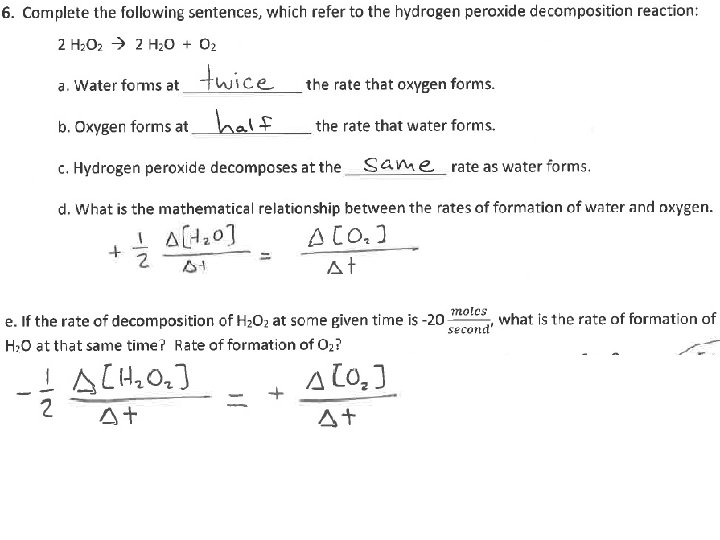
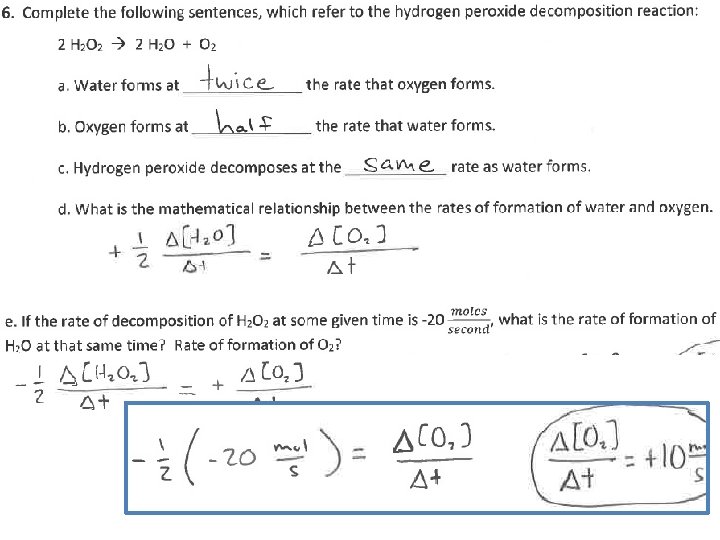
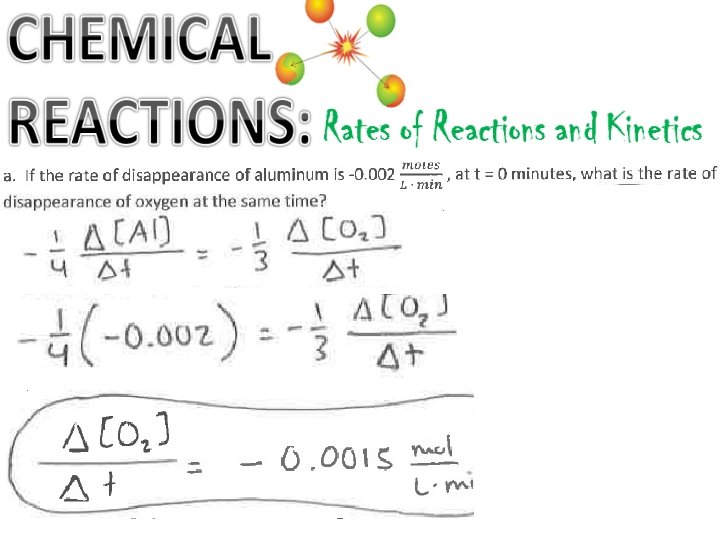
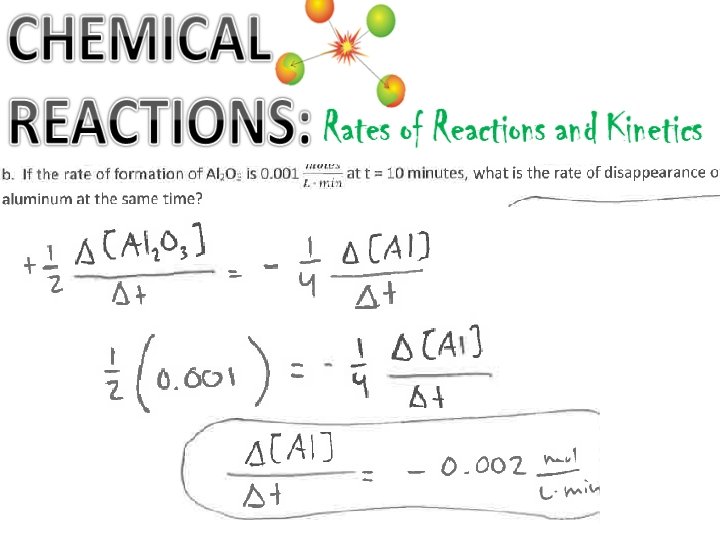
Relative Rates within a chemical reaction CH 4 + 2 O 2 CO 2 + 2 H 2 O Stoichiometric coefficients can be used to compare the rates of disappearance of reactants to the rates of formation of products

Relative Rates within a chemical reaction CH 4 + 2 O 2 CO 2 + 2 H 2 O Conceptual statements: O 2 gas reacts at twice the rate of CH 4 H 2 O forms at twice the rate of CO 2 forms at the same rate that CH 4 reacts H 2 O forms at the same rate that O 2 reacts

Relative Rates within a chemical reaction CH 4 + 2 O 2 CO 2 + 2 H 2 O Mathematical relationships: General expression of reaction rates:

All Screwed Up A Chemical Reaction Rates Game
 • Record data")
General Instructions • Play in your lab groups (3 -4 people) • Record data on worksheet, but produce graphs using chromebooks • Each round should be run a minimum of two times, so that everyone gets a chance to play. When producing graphs, use the average of the “elapsed time” measurements from each trial. • Answer the data analysis questions individually and in complete sentences electronically. • Return all nuts and bolts to original container when done
- Slides: 22