Objective s The graphical representation showing the variation

Objective s The graphical representation showing the variation of Gibbs energy with increase of temperature for the formation of the oxides( oxidation of metal to their oxide) is known as Ellingham Diagram. This provides a sound basis for considering the choice of reducing agent in the reduction of oxides.

Such diagrams help us in predicting the feasibility of thermal reduction of an ore. The criterion of feasibility is that at a given temperature, Gibbs energy of the reaction must be negative. ΔG =ΔH - TΔS
 Ellingham diagram normally consists of plots of Δf. G 0 vs")
Salient features (a) Ellingham diagram normally consists of plots of Δf. G 0 vs T formation of oxides of elements i. e. , for the reaction, 2 x. M(s) + O 2(g) → 2 Mx. O(s) In this reaction, the gaseous amount (hence molecular randomness) is decreasing from left to right due to the consumption of gases leading to a –ve value of ΔS which changes the sign of the second term in equation (ΔG =ΔH - TΔS). Subsequently ΔG shifts towards higher side. The result is +ve slope in the curve for most of the reactions shown above formation of Mx. O(s).
 Each plot is a straight line except when some change in phase (s→liq")
(b) Each plot is a straight line except when some change in phase (s→liq or liq→g) takes place. The temperature at which such change occurs, is indicated by an increase in the slope on +ve side. (c) There is a point in a curve below which ΔG is negative (So Mx. O is stable). Above this point, Mx. O will decompose on its own.
 In an Ellingham diagram, the plots of ΔGo for oxidation of common metals")
(d) In an Ellingham diagram, the plots of ΔGo for oxidation of common metals and some reducing agents are given. The values of Δf Go, etc. (for formation of oxides) at different temperatures are depicted which make the interpretation easy. (e) Similar diagrams are also constructed for sulfides and halides and it becomes clear why reductions of Mx. S is difficult. There, the Δf G 0 of Mx. S is not compensated.
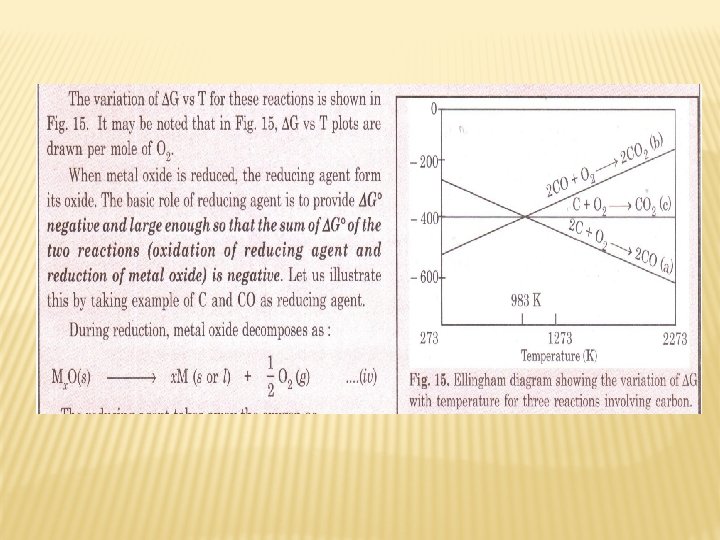
 vs T plots (schematic) formation of some oxides (Ellingham diagram)")
Gibbs energy (ΔGV) vs T plots (schematic) formation of some oxides (Ellingham diagram)

Limitations of Ellingham Diagram • The graph simply indicates whether a reaction is possible or not. This is so because it is based only on thermodynamic concepts. It does not say about the kinetics of the reduction process.

Application

Choice of reducing agents

Question No. 01

Solution : -

Question No. 02
 vs T plots (schematic) formation of some oxides (Ellingham diagram)")
Gibbs energy (ΔGV) vs T plots (schematic) formation of some oxides (Ellingham diagram)

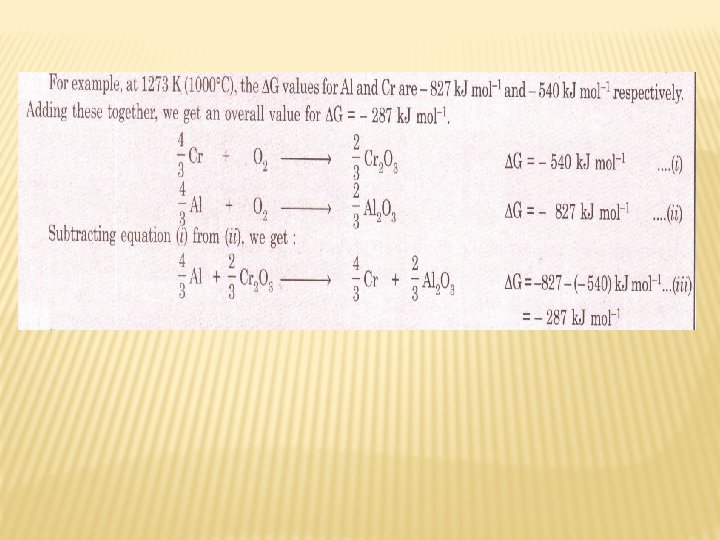
q Suggest a condition under which magnesium could reduce alumina. The two equations are: (a)4/3 Al + O 2 → 2/3 Al 2 O 3 (b)2 Mg +O 2 → 2 Mg. O At the point of intersection of the Al 2 O 3 and Mg. O curves the ΔG 0 becomes ZERO for the reaction: 2/3 Al 2 O 3 +2 Mg → 2 Mg. O +4/3 Al Below that point magnesium can reduce alumina.
- Slides: 17