Objective 416 SWBAT model harmonic motion using graphs

Objective 4/16 SWBAT model harmonic motion using graphs.

Unit 7: Vibrations, Waves & Sound Chapter 18: Harmonic Motion n 18. 1 Harmonic Motion n 18. 2 Graphs of Harmonic Motion n 18. 3 Properties of Oscillators

Graphs of harmonic motion n. A graph is a good way to show harmonic motion because you can quickly recognize cycles. n Graphs of linear motion do not show cycles.
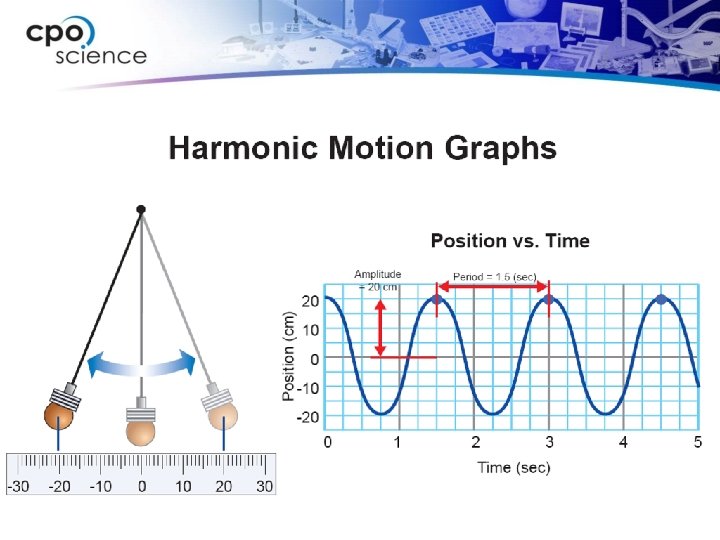

Determining period from a graph n To find the period from a graph, start by identifying one complete cycle. n The cycle must begin and end in the same place in the pattern. n Subtract the beginning time from the ending time.

Determining amplitude from a graph n On a graph of harmonic motion, the amplitude is half the distance between the highest and lowest points on the graph. n The amplitude is 20 cm.

Phase n The phase tells you exactly where an oscillator is in its cycle. n Circular motion is a kind of harmonic motion because rotation is a pattern of repeating cycles. n Because circular motion always has cycles of 360 degrees, we use degrees to measure phase.

Pendulums in phase n The concept of phase is most important when comparing two or more oscillators. n We say these pendulums are in phase because their cycles are aligned.

Pendulums out of phase by 90 o n Both pendulums have the same cycle, but they’re not in the same place at the same time. n The first pendulum is always a little bit ahead in n The pendulums are out of phase by 90 degrees.

Pendulums out of phase by 180 o n. If two oscillators that are 180 degrees out of phase are one-half cycle apart. n. This means that when pendulum 1 is all the way to the left, pendulum 2 is all the way to the right.

18. 2 Practice: Harmonic Motion Graphs Key Question: How do we make graphs of harmonic motion? Objectives: Construct graphs of harmonic motion. n Interpret graphs of harmonic motion to determine phase, amplitude, and period. n Use the concept of phase to describe the relationship between two examples of harmonic motion. n
- Slides: 11