Obesity Prevention Education and Body Mass Index BMI
 Training for School Nurses UPDATED JAN")
Obesity Prevention Education and Body Mass Index (BMI) Training for School Nurses UPDATED JAN 2020

Arkansas Department of Health is approved as a provider of nursing continuing professional development by the Midwest Multistate Division, and accredited approver by the American Nurses Credentialing Center’s Commission on Accreditation.

The planning committee & faculty attest that no relevant financial, professional or personal conflict of interest exists, nor was sponsorship of commercial support obtained, in the preparation or presentation of this educational activity.

Objectives OBJECTIVES Define obesity and relate current trends in Arkansas and in the US. Discuss risk factors for childhood obesity. Explain health consequences of obesity. Review history and pertinent legislation related to BMI in Arkansas Demonstrate the process for appropriate height and weight measurement for children. List resources available for schools and school nurses to combat childhood obesity.

Objectives & Learning Outcomes LEARNING OUTCOMES Participants will verbalize chronic diseases related to obesity. Participants will demonstrate the approved technique for height and weight measurement in school-age children according to Arkansas Center for Health Improvement.

Obesity Trends Definition, Data, and Insight into the Current Epidemic

Definition of Obesity is a complex disease involving an excessive amount of body fat in relation to height, when compared to some standard weight. Not just a cosmetic concern, but a medical problem that increases the risk of other diseases and health problems, such as heart disease, diabetes, high blood pressure and certain cancers. Many people have difficulty avoiding obesity for several different reasons and can be due to a combination of inherited factors, combined with the environment and personal diet and exercise choices.

Obesity and Overweight in Children Obesity in children and youth refers to age and gender- specific BMI that is equal to or greater than the 95 th percentile of the CDC BMI charts Overweight/at risk for obesity in children and youth refers to a BMI that is between the 85 th – 94 th percentile (IOM, 2007)

In the Past Three Decades… Number of overweight: • 6 -11 year olds tripled • Adolescents tripled • Overweight adults tripled

The Epidemic of Obesity affects 18. 5% of all children and adolescents 13. 7 million children and adolescents More than 1/3 (39. 8%) of adults are obese. About 93. 3 million US adults. www. cdc. gov

Obesity in the United States http: //www. cdc. gov/obesity/data/trends. html

Over Time. .

Most Recent Map

Statewide Results of Arkansas BMI Assessment 2018 -2019

Results of Grade and Gender

Over the Last Seven Years

Results by Grade since 2003

Conclusion from the Year 16 Assessment “The fact that more than 39% of Arkansas public school students are classified as either overweight or obese highlights the need for continued efforts to address child health and wellness. In October 2015, Gov. Asa Hutchinson launched the Healthy Active Arkansas initiative. With partners from the public and private sectors and a statewide network of local champions, Healthy Active Arkansas is a framework of nine priority areas designed to achieve a single, overarching goal: to increase the percentage of adults, adolescents, and children who are at a healthy weight. Priority areas include: physical and built environment; nutritional standards in government, institutions, and the private sector; nutritional standards in schools — early childhood through college; physical education and activity in schools — early childhood through college; healthy worksites; access to healthy foods; sugar-sweetened beverage reduction; breastfeeding; and a marketing program. Each area has two, five, and 10 -year strategies with related action steps and partners to help in implementing the plan. ”

Why is This Important? AWARENESS CREATES: Grant funding opportunities Resources and referrals for our students Promotion of new policies (Recess Pilot) that increase access to healthy foods and physical activity Understanding the health of the Whole Child

e k a t n I r a Sug Video games Poor Self Es teem d o o F t s Fa d o o F h it w rd a w e R Marketing to Kids Risk Factors for Obesity Saf ety Con cer ns Genes Depression Poor Education

Energy Imbalance Diet High-calorie Inactivity foods High-fat foods dense in calories Sedentary kids more likely to gain weight Inactive Soft drinks, candy, and desserts high in sugar/calories leisure activities

Genetics Overweight family and child may be genetically predisposed to put on excess weight Environment Physical of high-calorie foods activity may not be encouraged

Heredity and Genes 80% of children with two overweight parents will become overweight 40% of children with one overweight parent will become overweight 7– 9% of children with no overweight parents will become overweight http: //www. surgeongeneral. gov/topics/obesity/calltoaction/fact_adolescents. htm

Psychological Some eat to cope with problems or deal with emotions; stress or boredom Parents may have similar tendencies

Environmental and Media: Temptation at Every Turn Screen time may displace more activities Advertising of junk food and fast food increases children's requests for those particular foods and products Snacking increases while watching TV or movies Late-night screen time may interfere with getting adequate amounts of sleep, which is a known risk factor for obesity

Behavioral and Socio-cultural Sedentary lifestyles Calorie-dense foods Large portion sizes Excessive screen time low energy expenditure Parent modeling - eating and exercise behaviors

Adverse Childhood Experiences and Obesity The ACE Study had its origins in an obesity clinic located in San Diego. The 50 -percent dropout rate in the clinic that Felitti started in 1980 was driving him crazy especially because they’d all been losing weight when they left the program, not gaining. Turned into a 25 -year quest involving researchers from the Centers for Disease Control and Prevention and more than 17, 000 members of Kaiser Permanente’s San Diego care program. Results revealed adverse experiences in childhood were very common and that these experiences are linked to every major chronic illness and social problem that the United States grapples with – and spends billions of dollars on, including obesity.

Consequences of Obesity Physical, Psychological, Emotional, Social, Economical
 Abnormal triglyceride")
Cardiovascular Disease Hypertension Elevated insulin levels Dyslipidemia Elevated low density lipoprotein (LDL) Abnormal triglyceride levels

Psychosocial • Quality of Life ⁻ Depression and Anxiety ⁻ Negative self-esteem and poor body image ⁻ Feelings of chronic rejection, withdrawal from interaction with peers, and behavioral problems ⁻ Decreased endurance and/or participation ⁻ Social, academic and discrimination (bullying/teasing) www. cdc. gov

Other Health Consequences Sleep apnea Asthma Risk for Kidney problem Orthopedic disorders Skin fungal infections Gastrointestinal fatty liver disease elevated enzymes liver gallstones and cholecystitis gastroesophag eal reflux constipation

Other Health Consequences Cancer Esophageal Kidney Breast Gall Endometrial Thyroid Colon/rectal Pancreas Bladder

Other Health Consequences Endocrine disorders T 2 DM – Acanthosis Nigricans Polycystic Early Ovary Syndrome sexual maturation Clearly, the growth in the treatment of type 2 diabetes could signal the beginning of a multitude of long-term healthcare needs for many of these children

Acanthosis nigricans type III associated with obesity, insulin-resistant states and endocrinopathy Acanthosis nigricans is a disorder that may begin at any age Velvety thickening Gray to brown to black in body creases Neck, armpits, groin Darker skinned people have darker lesions http: //www. aocd. org/skin/dermatologi c_diseases/acanthosis_nigrica. html (James, et al 2005)

Typical Acanthosis Nigricans of the Neck

Typical Acanthosis Nigricans of the Axillae

Economic Burden of Obesity The Economic Estimates of the impact of obesity are astronomical: Obesity is the No. 1 driver of increasing health care costs in the US today Estimated by 2030 obesity-related medical costs alone could rise by $48 to $66 billion a year in the U. S. Childhood obesity alone is estimated to cost $14 billion annually in direct health expenses Children covered by Medicaid are nearly six times more likely to be treated for a diagnosis of obesity than children covered by private insurance.

Obesity and Absenteeism While there are many causes of school absenteeism, a study analyzing the attendance patterns of fourth-, fifth and sixth-graders in Philadelphia found obese children are absent significantly more than average-weight children. Such absenteeism hurts students’ learning, causes parents or guardians to miss work, and is costly to school systems. Among the study population, obese children missed an average of 12. 2 days of school per year, while average-weight children missed 10. 1 days, on average. Geier, A. B. , Foster, G. D. , Womble, L. G. , Mc. Laughlin, J. , Borradaile, K. E. , Nachmani, J. , Sherman, S. , Kumanyika, S. and Shults, J. (2007), The Relationship Between Relative Weight and School Attendance Among Elementary Schoolchildren. Obesity, 15: 2157 -2161. doi: 10. 1038/oby. 2007. 256

Result of a Number of Trends in the US Nutritious foods are more expensive than caloriedense, less nutritious foods Parks & recreational spaces are not considered safe or well maintained in many communities Americans walk less and drive more -- even for trips of Children engage in less than one mile physical activity in school Adults often work longer ↑ screen time hours & commute farther (convenience food) Portion sizes Lack of availability (F as in Fat, 2009)

Arkansas Initiative and Recommendation for BMI in Schools The State’s Response to this Rising Epidemic

AR Preventive Nutrition and Physical Activity Summit Purpose: to develop specific strategies to control the obesity epidemic in Arkansas Occurred: March 8, 2003 Funded by: National Institute of Health Nutrition Academic Award Support from: UAMS, ADH, ACHI, ACH, others State-wide summit

Act 1220 of 2003 Creates an Arkansas Child Health Advisory Committee Limits access to food/beverage vending machines Reports ALL money received from food and beverage contracts. Convenes an advisory committee in each school district Incorporates nutrition/physical activity goals into annual plans

Act 1220 of 2003 States: “Require schools to include as part of the Student Health report to parents an annual body mass index percentile by age for each student; and require schools to annually provide parents with an explanation of the possible health effects of body mass index, nutrition, and physical activity. ” (in a confidential, private and accurate manner)

Act 201 of 2007 Individual students will participate in BMI assessments in kindergarten and in grades 2, 4, 6, 8, and 10. BMI measurements will be eliminated for students in grades 11 and 12. Parents can provide written notice to the school if they choose to exclude their children from BMI assessments. Community Health Nurses will work with schools to assure that proper protocol is followed during the BMI assessments.

UAMS College of Public Health Evaluation of Act 1220: Year 7 Parents are maintaining their awareness of shortand long-term health problems associated with childhood obesity 90% of parents said that obesity is a serious problem for the state 79% of parents indicated that they believe schools play an important role in combating childhood obesity

UAMS College of Public Health Evaluation of Act 1220: Year 7 The percentage of parents preferring that students take PE 3 or more times per week has increased since 2009 Schools are more frequently offering nutritional information for students. No significant evidence of a negative impact on students

American Academy of Pediatrics Recommendation Accurately weigh and measure to monitor growth Calculate and plot BMI once a year in all children and adolescents Use changes in BMI to identify rate of excessive weight gain relative to linear growth (AAP, 2003, reaffirmed in 2007)

Childhood BMI is gender & age specific CHILDREN BMI – body mass index Underweight BMI-for-age < 5 th percentile Overweight / at risk BMI-for-age 85 th to 94 th for obesity percentile Obese BMI-for-age ≥ 95 th percentile Normal BMI-for-age: 5 th percentile - < 85 th percentile (CDC, 2009) http: //www. cdc. gov/nccdphp/dnpa/obesity/childhood/defining. htm

BMI for Age and Gender: Used for children and teens because of their rate of growth and development Provides a reference for adolescents that can track body size throughout life Compares well to laboratory measures of body fat (Barlow, 2007)

What BMI is NOT: An inexpensive, effective, easy-to-perform screening tool using height and weight Not intended to be used as the sole diagnostic measure

Perspectives About the Use of BMI Measurement Identify referrals and resources for children and parents Promote policies that access to healthful foods and daily physical activity

Clinical Instruction for BMI Assessment What to Do and How to Do it Correctly

Prior to Assessment Contact school administration and teachers Determine assessment team Screener Recorder Determine date and place and which students to be assessed May be helpful to list required screenings in your district/school policy book written refusal from the parent is necessary if the parent wishes for child not to participate

Day of Assessment Equipment Calibration of scales Station set up Preparation of child Data collection forms

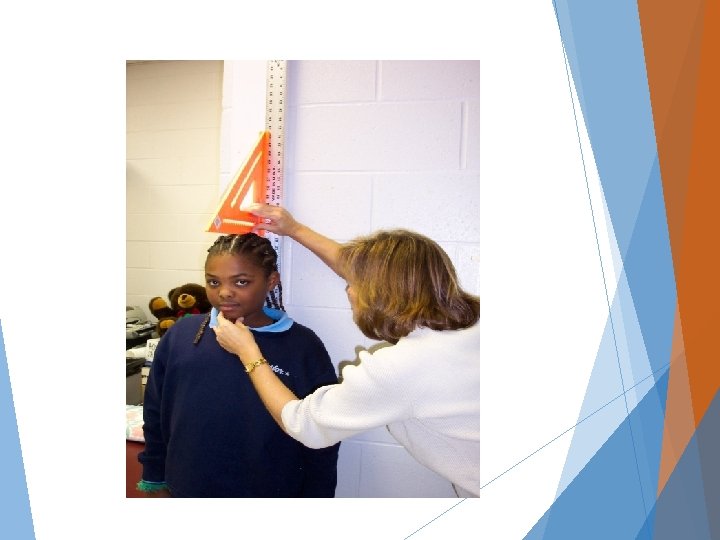
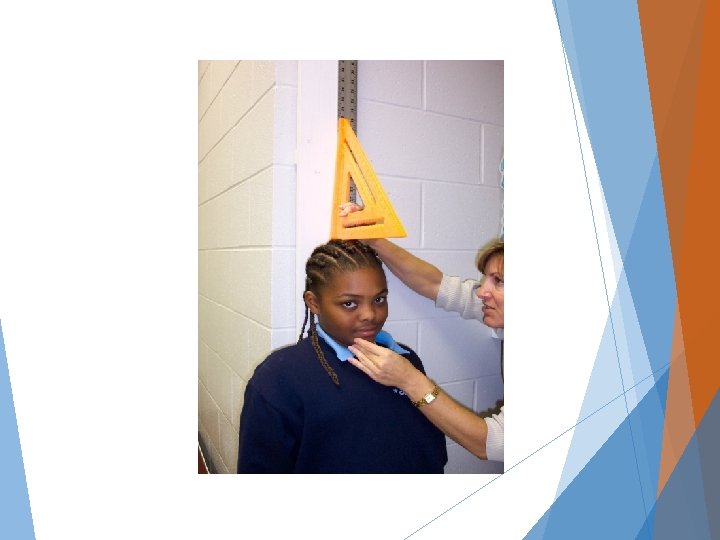
Recommended Equipment Stadiometer Measures height Portable or permanently affixed to wall Provided by ACHI Tape wood board to wall for stability Carpenter’s triangle for headpiece

Scales Tanita HD-314 Portable Measures up to 330 lbs Digital -out read Tanita HD-351 Portable Measure lbs Digital read-out Previous visible up to 440 weight is

Recommended Equipment Step Stool- Height measurements to ensure measurement line is read at eye level Batteries (Check type & number required) Name Tags – children and staff Office Supplies Container for personal items

Recommended Equipment Standard Weight A standard weight should be used to test the scale for accuracy (NOTE: do not use non-standard weight such as bag of sugar) If the readout is more than ½ pound off then change the batteries in the scale If the readout is still more than ½ pound off DO NOT use the scale

Assessment Team Screener Performs heights and weights Recorder Records data on forms pulled from Cognos in e. School May have multiple screening stations

Measurement Procedure Child should: remove as much outerwear as possible remove shoes (barefoot or wearing socks) empty pockets; remove jewelry and other objects remove eyeglasses (to visualize Frankfort remove hair barrettes, ties or rubber bands Plane)

Measurement Order Measurements 1 st height Weight 2 nd height in rotational order:

Height Measurement Child stands with back or other body part touching the board with body straight Legs are together and body weight is evenly distributed on feet Arms hang freely by side, palms facing thighs Position should be verified from FRONT and LEFT of body Position head in Frankfort Horizontal Plane

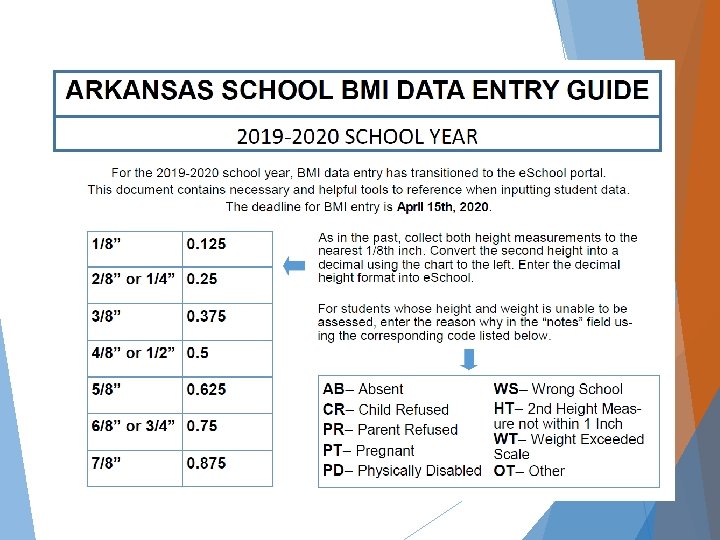
Height Measurement Child inhales deeply and holds breath WITHOUT moving head or body Movable headpiece is brought to superior point on head with hair compressed Height is recorded to the nearest 1/8 th inch Greater than one inch difference between two height measurements requires remeasurement


Frankfort Plane

Recording Process Measurer takes first height Recorder calls number back to measurer Recorder records number in space indicated for “ 1 st Height”

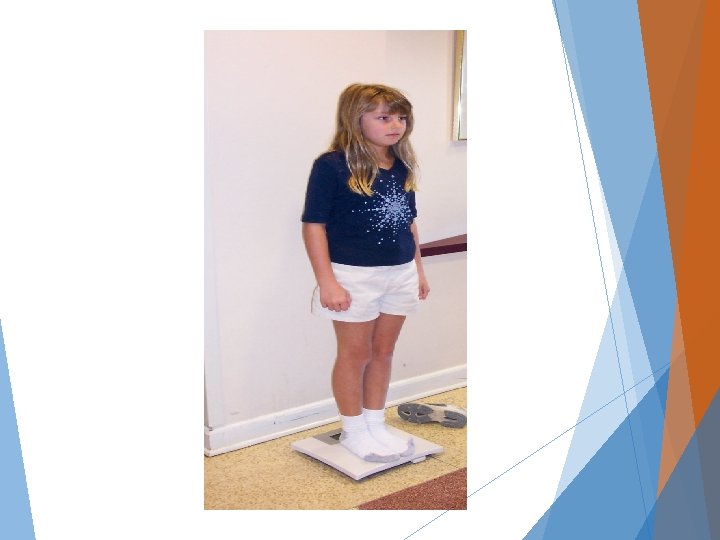
Weight Measurement “Zero” the scale if digital Measurer has child step up on the center of the scale and stands facing the back of the scale (confidentiality) and indicates to recorder that child is “ready” Body weight is evenly distributed on feet Head is up and facing straight ahead

Recording Process Recorder obtains read-out number on scale and records number in space indicated for “Weight” Weight is recorded to nearest 0. 2 pounds (or appropriate unit for the scale) NOTE: The reading for weight measurement is NOT called out by the measurer or recorder to ensure CONFIDENTIALITY.

Recording Process Measurer re-measures 2 nd height Recorder checks two sets of height measurements to ensure they are within one-inch of each other The second height will be the one converted to a decimal form and entered into e. School

Height Remeasurement Recorder should place single line through entries for first set of measurements if greater than one inch difference, initial the line, and record second set of height measurements for “ 3 rd” Height and “ 4 th” Height If after two trials, two height measurements within the one-inch criteria cannot be achieved, then the child’s assessment is considered “Unable to be Assessed” Use the reason code “HT” in the notes field to indicate this result

Paper Forms ACHI Calibration Log Height and Weight Data Collection Form used during the screening to record statistics Available in Cognos Data Entry Guide Card

Scale Accuracy/Testing Log Required to verify the accuracy of each scale Scales verified day of scheduled measurement Scales should be placed in exact location where measurements will take place prior to being verified Once verified, do not move scales Verification with at least one know weight important to minimize misreporting of child’s BMI due to faulty equipment

Scale Accuracy/Testing Log Verification Steps: “Zero” the scale, if digital model Place standard or known weight in center of scale Record scale reading in appropriate column for known weight used

Scale Accuracy/Testing Log

BMI Data Collection Form by Grade

e. School Data Entry How to get to the Data Entry Page: 1. Go to the student that you want to enter data for 2. Click Menu 3. Click Medical Tab 4. Click Exams 5. Scroll down to Growth 6. Click the + sign to the right of the Growth Bar 7. Put in the Date and Hit Enter 8. You can go to the next student by clicking the grey arrow on the top right of the screen

e. School Data Entry

Unable to Assess Reasons include absent, parent refused, child refused, pregnant, physical disability, wrong school, student is pregnant, could not get two height measurements within 1 inch, weight exceeded scale’s limit, and other Indicate why the student data cannot be obtained by entering the corresponding code into the “notes” field in e. School. Failure to do so will impact (skew) school data

Student Health Report Schools are required to make available to parents a student health report that will include the data and results from the Growth screening as well as other screenings the student received throughout the year. To print the Health Report Go to Cognos Click Student Management Click Medical Click General Student Medical Folder

References ACHI http: //www. achi. net Arkansas Dept of Health http: //www. healthy. arkansas. gov ADE Coordinated School Health Website http: //www. arkansascsh. org

Other Resources Let’s Move www. letsmove. gov Alliance for Healthier Generation www. healthiergeneration. org Action for Healthy Kids www. actionforhealthykids. org Arkansas Coalition for Childhood Obesity Prevention http: //www. arkansasobesity. org/
- Slides: 85