Obesity Or Underweight Energy input Energy output Food


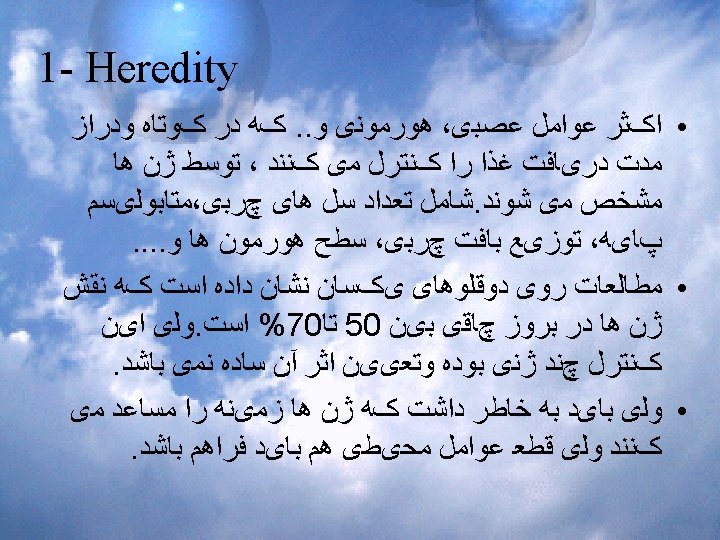
Obesity

Or Underweight

Energy input = Energy output Food پﺮﻭﺗﺌ یﻦ؟ چﺮﺑ ی؟ BM + PA + PPT + Growth ﻗﻨﺪ؟ Total calorie is more important than source of calorie but source also have some effects


Obesity Trends* Among U. S. Adults BRFSS, 1985 (*BMI ≥ 30, or ~ 30 lbs. overweight for 5’ 4” person) No Data <10% 10%– 14%

Obesity Trends* Among U. S. Adults BRFSS, 1986 (*BMI ≥ 30, or ~ 30 lbs. overweight for 5’ 4” person) No Data <10% 10%– 14%

Obesity Trends* Among U. S. Adults BRFSS, 1987 No Data (*BMI ≥ 30, or ~ 30 lbs. overweight for 5’ 4” person) <10% 10%– 14%

Obesity Trends* Among U. S. Adults BRFSS, 1988 (*BMI ≥ 30, or ~ 30 lbs. overweight for 5’ 4” person) No Data <10% 10%– 14%

Obesity Trends* Among U. S. Adults BRFSS, 1989 (*BMI ≥ 30, or ~ 30 lbs. overweight for 5’ 4” person) No Data <10% 10%– 14%

Obesity Trends* Among U. S. Adults BRFSS, 1990 (*BMI ≥ 30, or ~ 30 lbs. overweight for 5’ 4” person) No Data <10% 10%– 14%

Obesity Trends* Among U. S. Adults BRFSS, 1991 (*BMI ≥ 30, or ~ 30 lbs. overweight for 5’ 4” person) No Data <10% 10%– 14% 15%– 19%

Obesity Trends* Among U. S. Adults BRFSS, 1992 o Data (*BMI ≥ 30, or ~ 30 lbs. overweight for 5’ 4” person) <10% 10%– 14% 15%– 19%

a Obesity Trends* Among U. S. Adults BRFSS, 1993 (*BMI ≥ 30, or ~ 30 lbs. overweight for 5’ 4” person) <10% 10%– 14% 15%– 19%

Obesity Trends* Among U. S. Adults BRFSS, 1994 ata (*BMI ≥ 30, or ~ 30 lbs. overweight for 5’ 4” person) <10% 10%– 14% 15%– 19%

Obesity Trends* Among U. S. Adults BRFSS, 1995 (*BMI ≥ 30, or ~ 30 lbs. overweight for 5’ 4” person) <10% 10%– 14% 15%– 19%

Obesity Trends* Among U. S. Adults BRFSS, 1996 (*BMI ≥ 30, or ~ 30 lbs. overweight for 5’ 4” person) <10% 10%– 14% 15%– 19%

Obesity Trends* Among U. S. Adults BRFSS, 1997 (*BMI ≥ 30, or ~ 30 lbs. overweight for 5’ 4” person) No Data <10% 10%– 14% 15%– 19% ≥ 20%

Obesity Trends* Among U. S. Adults BRFSS, 1998 (*BMI ≥ 30, or ~ 30 lbs. overweight for 5’ 4” person) <10% 10%– 14% 15%– 19% ≥ 20%

Obesity Trends* Among U. S. Adults BRFSS, 1999 (*BMI ≥ 30, or ~ 30 lbs. overweight for 5’ 4” person) <10% 10%– 14% 15%– 19% ≥ 20%

Obesity Trends* Among U. S. Adults BRFSS, 2000 (*BMI ≥ 30, or ~ 30 lbs. overweight for 5’ 4” person) <10% 10%– 14% 15%– 19% ≥ 20%

Obesity Trends* Among U. S. Adults BRFSS, 2001 10% (*BMI ≥ 30, or ~ 30 lbs. overweight for 5’ 4” person) 10%– 14% 15%– 19% 20%– 24% ≥ 25%

Obesity Trends* Among U. S. Adults BRFSS, 2002 (*BMI ≥ 30, or ~ 30 lbs. overweight for 5’ 4” person) No Data <10% 10%– 14% 15%– 19% 20%–

Obesity Trends* Among U. S. Adults BRFSS, 2003 (*BMI ≥ 30, or ~ 30 lbs. overweight for 5’ 4” person) No Data <10% 10%– 14% 15%– 19% 20%– 24% ≥ 25%

Obesity Trends* Among U. S. Adults BRFSS, 2004 (*BMI ≥ 30, or ~ 30 lbs. overweight for 5’ 4” person) No Data <10% 10%– 14% 15%– 19% 24% 20%– ≥ 25%

Obesity Trends* Among U. S. Adults BRFSS, 2005 No Data (*BMI ≥ 30, or ~ 30 lbs. overweight for 5’ 4” person) <10% 10%– 14% 15%– 19% 20%– 24% 29% 25%– ≥ 30%

Obesity Trends* Among U. S. Adults BRFSS, 2006 o Data (*BMI ≥ 30, or ~ 30 lbs. overweight for 5’ 4” person) <10% 10%– 14% 15%– 19% 20%– 24% 29% 25%– ≥ 30%

Obesity Trends* Among U. S. Adults BRFSS, 2007 No Data (*BMI ≥ 30, or ~ 30 lbs. overweight for 5’ 4” person) <10% 10%– 14% 15%– 19% 20%– 24% 29% 25%– ≥ 30%

Obesity Trends* Among U. S. Adults BRFSS, 2008 o Data (*BMI ≥ 30, or ~ 30 lbs. overweight for 5’ 4” person) <10% 10%– 14% 15%– 19% 20%– 24% 29% 25%– ≥ 30%

Obesity Trends* Among U. S. Adults BRFSS, 2009 (*BMI ≥ 30, or ~ 30 lbs. overweight for 5’ 4” person) No Data <10% 10%– 14% 15%– 19% 20%– 24% 25%– 29% ≥ 30%

2013

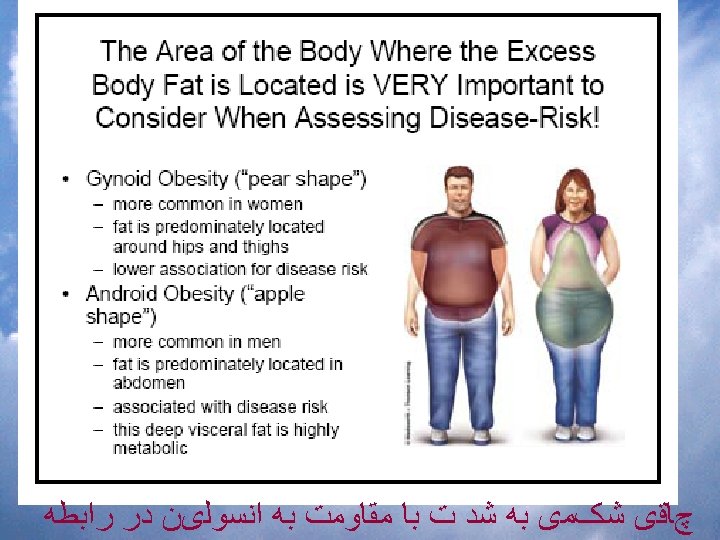
 as a percentage of body weight")
Total body fat (essential fat plus storage fat) as a percentage of body weight that is associated with optimal health is 10% to 25% in men and 18% to 30% in women,

Regulation of Body Weight

1 - Short Term Regulation 2 - Long Term Regulation
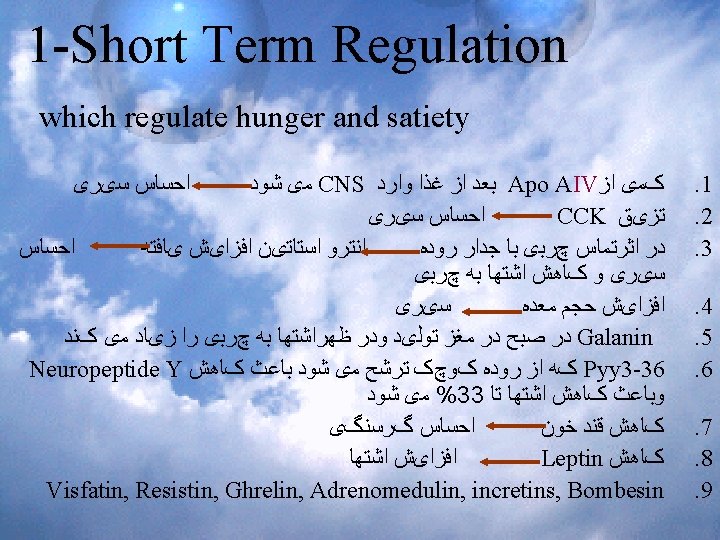

Regulation of Food Intake Brain Central Signals Stimulate Inibit NPY Orexin-A AGRP dynorphin galanin α-MSH CART CRH/UCN NE GLP-I 5 -HT Peripheral signals Glucose CCK, GLP-1, Apo-A-IV Vagal afferents Ghrelin Emotions Food characteristics Lifestyle behaviors Environmental cues Peripheral organs Gastrointestinal tract Food Intake Insulin + + External factors Leptin Adipose tissue Cortisol Adrenal glands


Physical triggers for hunger are much stronger than those for satiety, and it is easier to override the signals for satiety (Blundell et al, 1993).
")
2 - Long Term Regulation 1. Set point theory 2. Thermogenesis (TEF, BMR)

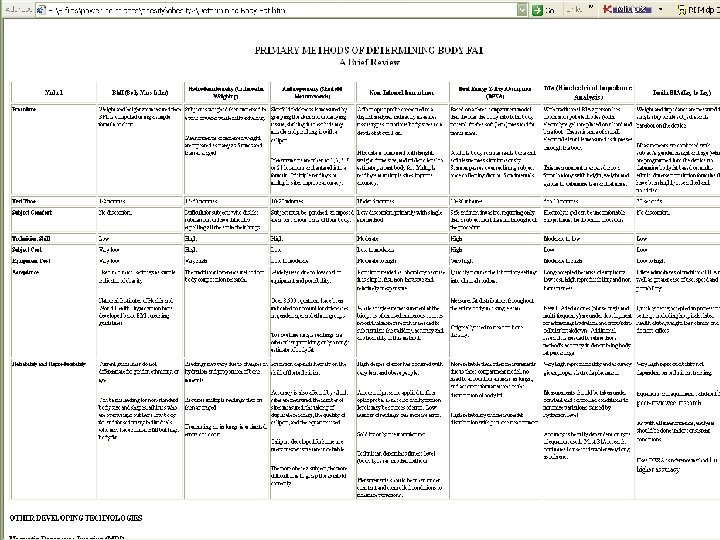
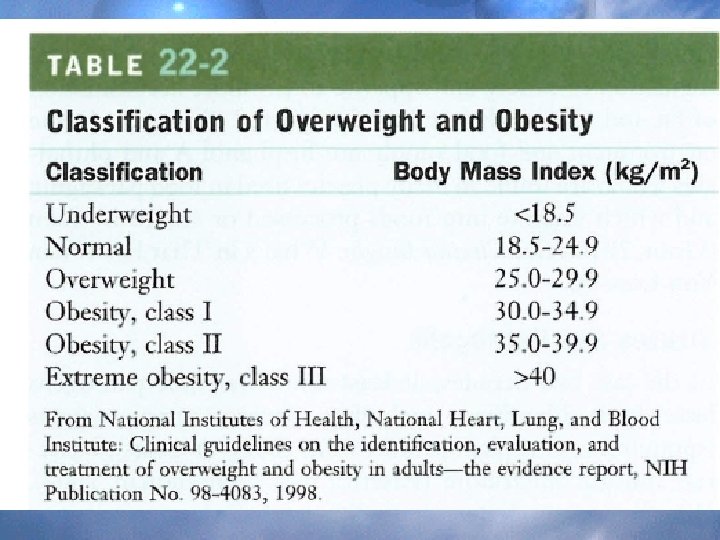
Assesment of Obesity
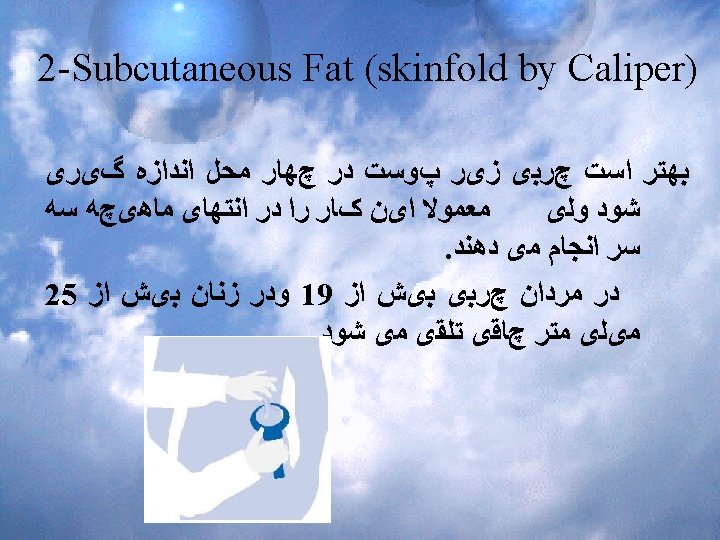
 چﺮﺑی ﺯیﺮ پﻮﺳﺖ (88 ﻭ")
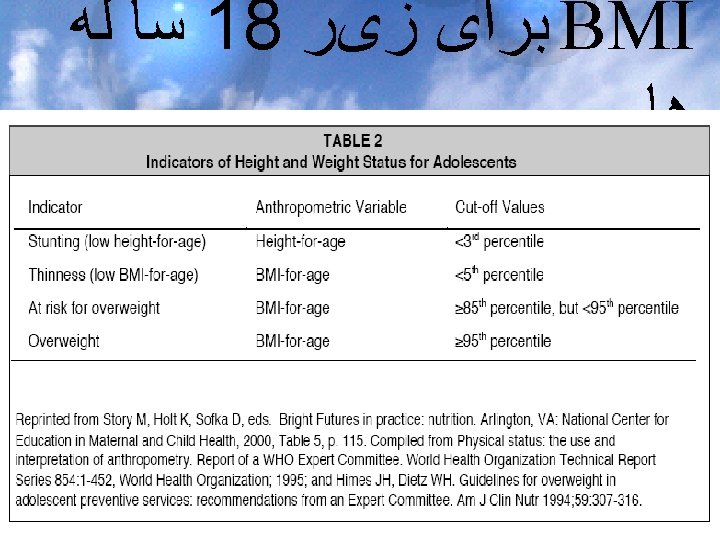
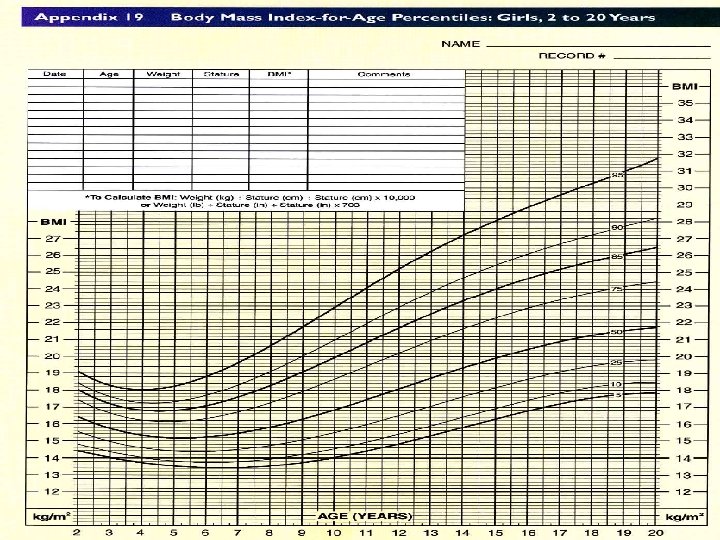
ﺷﺎﺧﺺ ﻫﺎی ﺗﺸﺨیﺺ چﺎﻗی BMI (19 ﻭ 25) چﺮﺑی ﺯیﺮ پﻮﺳﺖ (88 ﻭ 102) ﺩﻭﺭ کﻤﺮ (. 90 and. 80) WHR ( ﺩﺍﻧﺴیﺘﻪ ﺑﺪﻥ)ﻭﺯﻥ ﺯیﺮ آﺐ Bioelectrical impedance analysis (BIA) Near infrared reactance Bod pod CT Total Body Electrical Conductivity (TOBEC) MRI DEXA Metropolitan Life insurance Tables Whole Body Gamma Counter (WBD) . 1. 2. 3. 4. 5. 6. 7. 8. 9. 10. 11. 12. 13. 14

1 -BMI
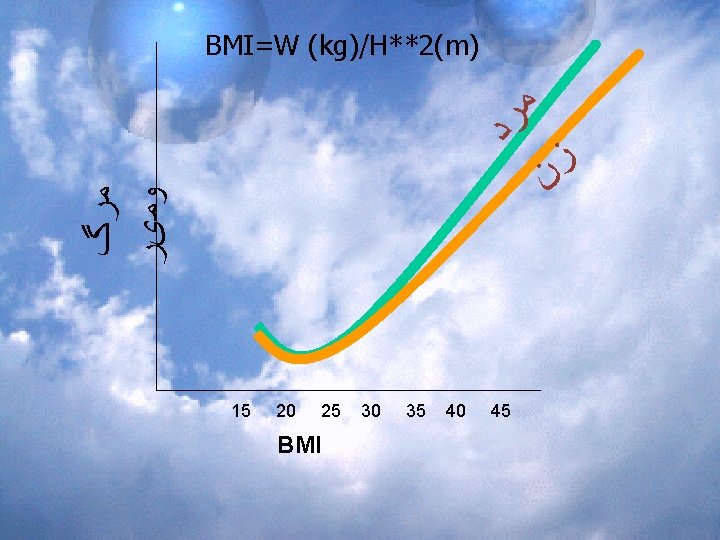

BMI 18. 5 -21 21 -23 23 -25

3 -Waist Circumference

 Human body fat has a density of 0. 918")
5 -Body Density (underwater weighing) Human body fat has a density of 0. 918 gm/cc. Siri formula (4. 95/(body density) - 4. 50) *100 which gives a percentage number that is claimed to be the Bodyfat Percentage Brozek formula

6 -Bioelectrical impedance ﺩﺭ ﺍیﻦ ﺭﻭﺵ ﺩﺭ ﻭﺍﻗﻊ ﺭﺳﺎﻧﺎیی ﺑﺪﻥ ﺍﻧﺪﺍﺯﻩ گیﺮی ﻣی ﺷﻮﺩ ﺑﺎ . ﺍیﻦ پیﺶ ﻓﺮﺽ کﻪ ﺑﺎﻓﺖ چﺮﺑی کﻤﺘﺮ ﺭﺳﺎﻧﺎﻣی ﺑﺎﺷﺪ ﺍﻟکﺘﺮﻭﻟیﺖ ﻫﺎی ، ﻭﻟی ﻋﻮﺍﻣﻞ ﺩیگﺮی ﻫﻤچﻮﻥ چﺮﺑی پﻮﺳﺖ ﺩﺭ ﺍیﻦ ﺍﻣﺮ ﺩﺧﺎﻟﺖ کﺮﺩﻩ ﻭ ﺩﻗﺖ آﻨﺮﺍ کﺎﻫﺶ ﻣی. . . ﺑﺪﻥ ﻭ ، ﺩﻫﻨﺪ . ﺑﺎﺷﺪ گﺮﺍﻥ ﻫﻢ ﺍیﻦ ﺭﻭﺵ The following rules must be followed to give any ﻣی credence to the tests: * Abstain from eating and drinking within 4 hours of the test * Avoid exercising within 12 hours of the test * Void (urinate) completely prior to testing * Do not drink alcohol within 48 hours of the test * Avoid taking diuretics prior to testing unless instructed by your physician

7 – Near Infrared Reactance • Near Infrared Near infrared uses light to measure fat through reflection. A device is pressed against your arm, and a single reading estimates your body fat. This method of assessing body fat is based on the principles of light absorption, reflectance, and near infrared spectroscopy. A computerized spectrophotometer that has a scan and probe are used. The probe is placed onto the biceps; it emits an infrared light which passes through both fat and muscle and is reflected back to the probe. Subject data such as height, weight, sex, age, frame size and activity level are taken into consideration. Density measurements are obtained and incorporated into the manufacturers proprietary prediction equations. There is currently one NIR device on the market. There are few studies on this device. The best known showed Near Infrared testing to be reasonably accurate for the norm and very consistent from test to test. It is also probably the easiest and fastest of all. The study did show NIR to be consistently inaccurate for the two ends of the weight spectrum, the lean and the obese. In test, immediate re-test comparisons using several technicians on the same subject, it is observed that technique is very important in getting a consistent reading. This requirement for high technician skill level makes this method less than reliable in anything other than a clinical environment
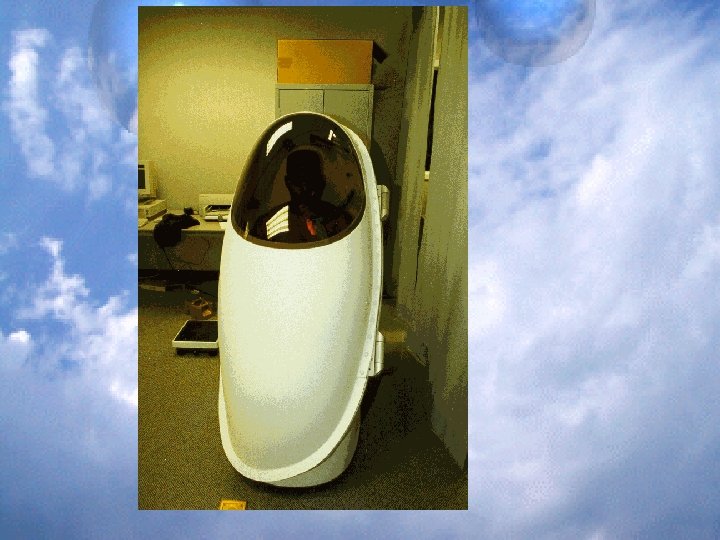
 (The Bod Pod) is very")
8 – BOD POD • Air Displacement Plethysmography (ADP) (The Bod Pod) is very similar to hydrostatic weighing, except it uses air displacement instead of water. It is a very close second to hydrostatic testing when available, and when a controlled environment. It is pretty fast and easy to perform. It, too, is usually expensive. In field comparisons we have found a good deal of discrepancy between the body pod and UWW. We assume it is because of the humidity and barometric pressure variations found in the field that is not found in the clinical environment. Most of the studies that we have found that show a very similar degree of accuracy as UWW, was funded by the company that manufactures the Bod Pod. Most independent studies show it to be off in both ends of the spectrum, but very consistent in conclusion, albeit inaccurate.
 - CT produces crosssectional scans of the")
9 – CT • Computed Tomography (CT) - CT produces crosssectional scans of the body. An x-ray tube sends a beam of photons toward a detector. As the beam rotates around a person, data is collected, stored, and applied to complex algorithms to build images that determine body composition. CT is particularly useful in giving a ratio of intra-abdominal fat to extra-abdominal fat. It is noninvasive, but potential is limited by exposure to radiation and high equipment cost.
 • The Total Body Electrical Conductivity (TOBEC)")
10 – Total Body Electrical Conductivity (TOBEC) • The Total Body Electrical Conductivity (TOBEC) machine consists of a cylinder that is open at both ends. It generates a very weak magnetic field produced with electric energy. As a subject passes through the cylinder, the strength of the magnetic field is altered in relation to the electrolytes found in the body water. Body water is a constant proportion of lean tissue, so this reading enables scientists to estimate lean body mass.
 - An x-ray based method in")
11 – MRI • Magnetic Resonance Imaging (MRI) - An x-ray based method in which a magnetic field "excites" water and fat molecules in the body, producing a measurable signal. A person lies within the magnet as a computer scans the body. High-quality images show the amount of fat and where it is distributed. MRI takes about 30 minutes and is very safe as it uses no ionizing radiation, but use is limited due to the high cost of equipment and analysis.
 is very accurate and")
12 – DEXA • DEXA testing (Dual Energy X-Ray Absorptiometry) is very accurate and fast but very expensive. It does provide more accurate measurements of It is often combined with hydrostatic to get clinical accuracy. It tends to be very expensive, has low availability, and usually requires a licensed medical technician to operate. The test is very quick, under 20 minutes, but getting an appointment and time-slot can take weeks. Also, since this method requires a whole body x-ray a physician's referral is needed
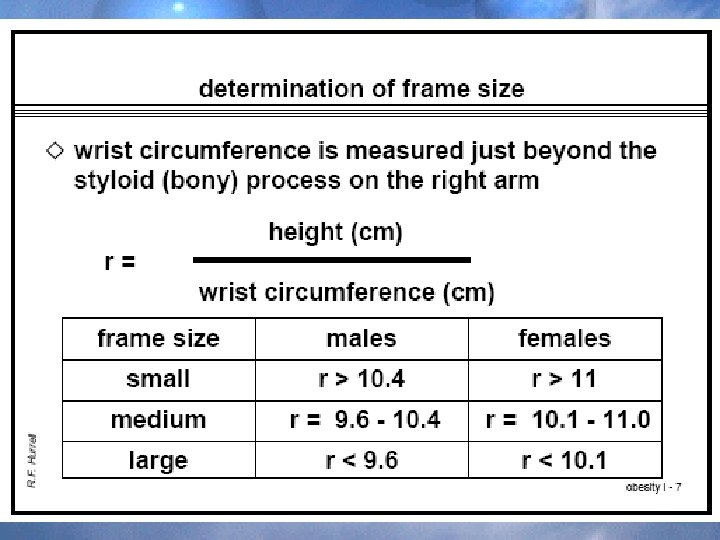
+ FRAME 158 58.")
13 -Metropolitan Life insurance Tables HEIGHT SMALL MEDIUM LARGE (In Shoes)+ FRAME 158 58. 3 - 61. 0 59. 6 - 64. 2 62. 8 - 68. 3 159 58. 6 - 61. 3 59. 9 - 64. 5 63. 1 - 68. 8 160 59. 0 - 61. 7 60. 3 - 64. 9 63. 5 - 69. 4 161 59. 3 - 62. 0 60. 6 - 65. 2 63. 8 - 69. 9 162 59. 7 - 62. 4 61. 0 - 65. 6 64. 2 - 70. 5 163 60. 0 - 62. 7 61. 3 - 66. 0 64. 5 - 71. 1 164 60. 4 - 63. 1 61. 7 - 66. 5 64. 9 - 71. 8 165 60. 8 - 63. 5 62. 1 - 67. 0 65. 3 - 72. 5 166 61. 1 - 63. 8 62. 4 - 67. 6 65. 6 - 73. 2 167 61. 5 - 64. 2 62. 8 - 68. 2 66. 0 - 74. 0 168 61. 8 - 64. 6 63. 2 - 68. 7 66. 4 - 74. 7 169 62. 2 - 65. 2 63. 8 - 69. 3 67. 0 - 75. 4 170 62. 5 - 65. 7 64. 3 - 69. 8 67. 5 - 76. 1 171 62. 9 - 66. 2 64. 8 - 70. 3 68. 0 - 76. 8 172 63. 2 - 66. 7 65. 4 - 70. 8 68. 5 - 77. 5 173 63. 6 - 67. 3 65. 9 - 71. 4 69. 1 - 78. 2 174 63. 9 - 67. 8 66. 4 - 71. 9 69. 6 - 78. 9 175 64. 3 - 68. 3 66. 9 - 72. 4 70. 1 - 79. 6 176 64. 7 - 68. 9 67. 5 - 73. 0 70. 7 - 80. 3 177 65. 0 - 69. 5 68. 1 - 73. 5 71. 3 - 81. 0 178 65. 4 - 70. 0 68. 6 - 74. 0 71. 8 - 81. 8 179 65. 7 - 70. 5 69. 2 - 74. 6 72. 3 - 82. 5 180 66. 1 - 71. 0 69. 7 - 75. 1 72. 8 - 83. 3 181 66. 6 - 71. 6 70. 2 - 75. 8 73. 4 - 84. 0 182 67. 1 - 72. 1 70. 7 - 76. 5 73. 9 - 84. 7 183 67. 7 - 72. 7 71. 3 - 77. 2 74. 5 - 85. 4 184 68. 2 - 73. 4 71. 8 - 77. 9 75. 2 - 86. 1 185 68. 7 - 74. 1 72. 4 - 78. 6 75. 9 - 86. 8 186 69. 2 - 74. 8 73. 0 - 79. 3 76. 6 - 87. 6 187 69. 8 - 75. 5 73. 7 - 80. 0 77. 3 - 88. 5 188 70. 3 - 76. 2 74. 4 - 80. 7 78. 0 - 89. 4 189 70. 9 - 76. 9 74. 9 - 81. 5 78. 7 - 90. 3 190 71. 4 - 77. 6 75. 4 - 82. 2 79. 4 - 91. 2 191 72. 1 - 78. 4 76. 1 - 83. 0 80. 3 - 92. 1 192 72. 8 - 79. 1 76. 8 - 83. 9 81. 2 - 93. 0 193 73. 5 - 79. 8 77. 6 - 84. 8 82. 1 - 93. 9 Centimeters
 • Whole Body Gamma Counter (WBD) combined with")
14 -Whole Body Gamma Counter (WBD) • Whole Body Gamma Counter (WBD) combined with In Vivo Neutron Activation Analysis (IVNAA) uses very complex lab equipment to capture gamma rays emitted by a subject. The gammas come from a naturally occurring isotope of potassium found in the human body. Total body potassium is an accurate index of the mass of metabolically active tissues in the body, and can be used with DEXA to continue refining the ability to accurately account for variations in fat free mass.
 are")
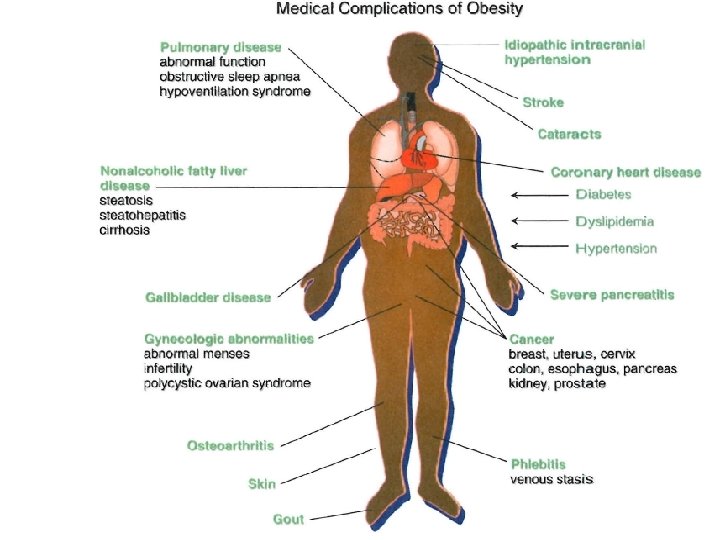
Health Risks of Obesity oerweight and obese individuals (BMI of 25 and above) are at increased risk for : • High blood pressure, hypertension • High blood cholesterol, dyslipidemia • Type 2 (non-insulin dependent) diabetes • Insulin resistance, glucose intolerance • Hyperinsulinemia • Coronary heart disease • Angina pectoris • Congestive heart failure • Stroke To be continued

• • Gallstones • Cholescystitis and cholelithiasis • Gout • Osteoarthritis • Obstructive sleep apnea and respiratory problems • Some types of cancer (such as endometrial, breast, prostate, and colon) • Complications of pregnancy • Poor female reproductive health (such as menstrual irregularities, infertility, irregular ovulation) • Bladder control problems (such as stress incontinence) • Uric acid nephrolithiasis • Psychological disorders (such as depression, eating disorders, distorted body image, and low self esteem). • . . .

Complications of obesity

Ethiology

Genetic factors alone, rare diseases such as Prader-Willi syndrome, and endocrine disorders can only explain a minority of the present obesity prevalence seen among children, though common genetic allelic variants may set the stage for obesity within an obesogenic environment.

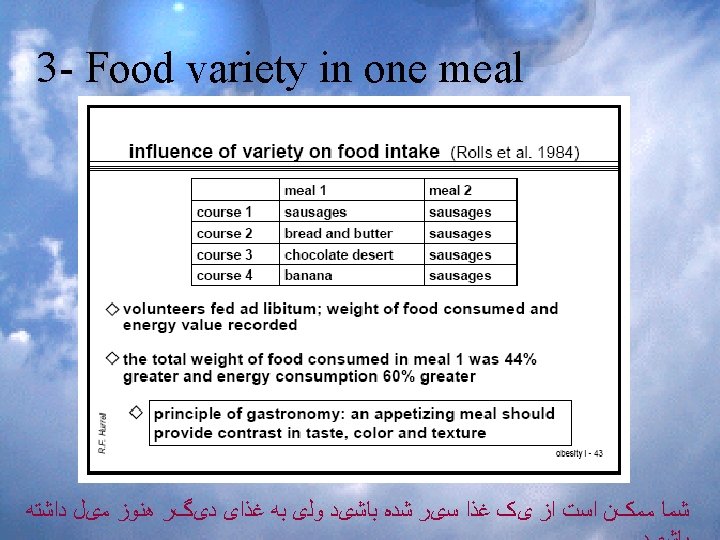

4 - Inactivity: 5 – light 6 – sleep 7 – stress 8 – portion size 9 - Obesogens (bisphenol, phthalates) 10 – Calcium 11_ Hypothyroidism 12 - Environmental pollutants 13 – Bacteria and antibiotics 14 – artificial sweeteners 15 – air conditioners 16 – odors 17 - deficiencies for example vitamin D

"Animals learn to use taste to predict caloric consequences, and in nature, sweetness is almost always an indicator of calories. " When we experience a sweet taste with no accompanying caloric intake, it confuses that calibration tool. Repeating that experience, as in drinking a diet soda every afternoon, might actually deprogram your calorie-counting mechanism for good. (In the rats, effects were seen in as few as 10 days. )

Treatment of Obesity

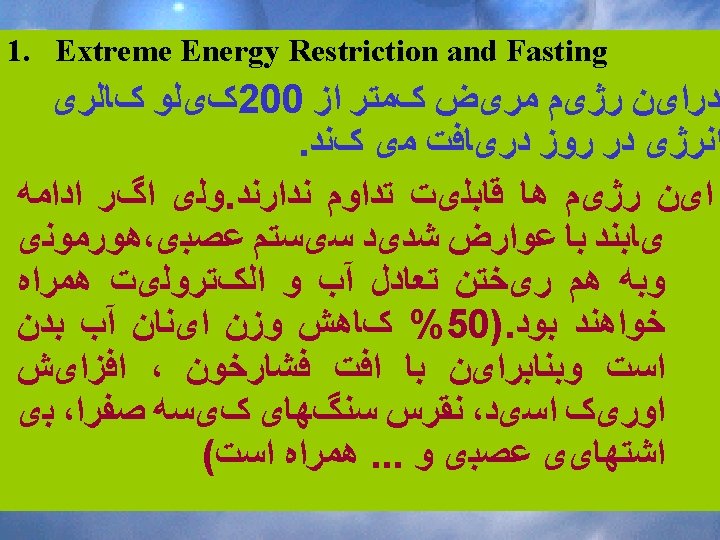
Metabolic aberrations that occur during starvation cause a host of negative effects, including bradycardia, hypotension, dry skin and hair, easy fatigue, constipation, nervous system abnormalities, depression, and death


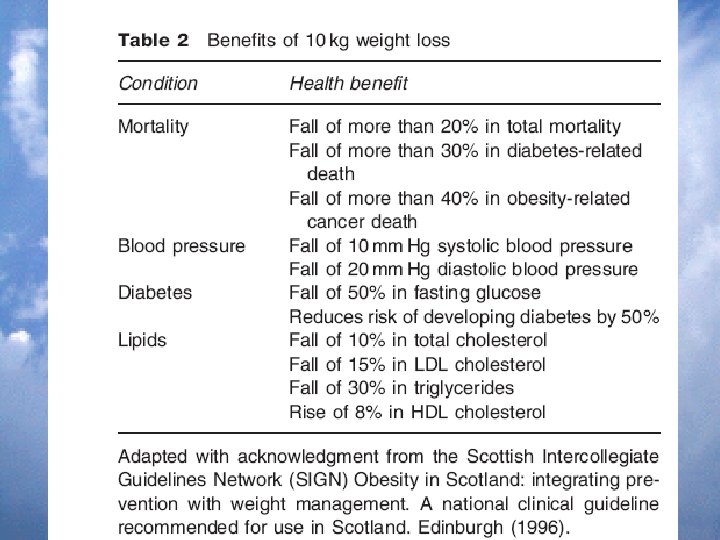
Benefits of Modest Weight Loss: Serum Lipid Profile A Loss of 10 lb (4. 5 kg) is associated with: ---Total Cholesterol 16% ---LDL Cholesterol 12% ---HDL Cholesterol 18%

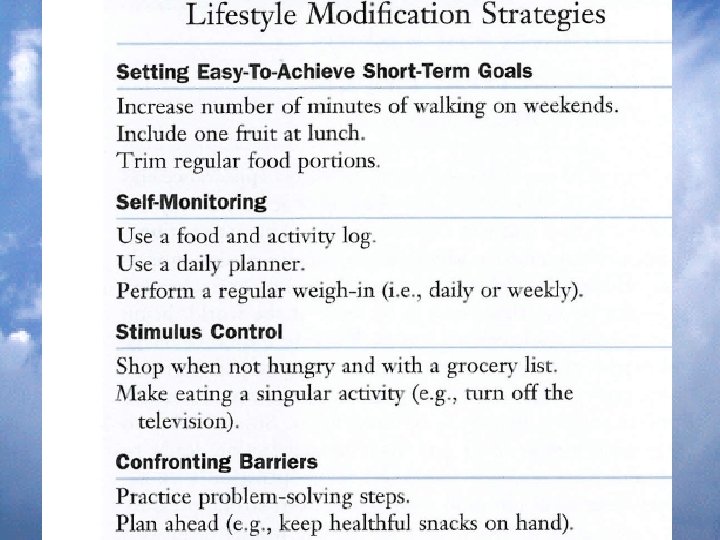
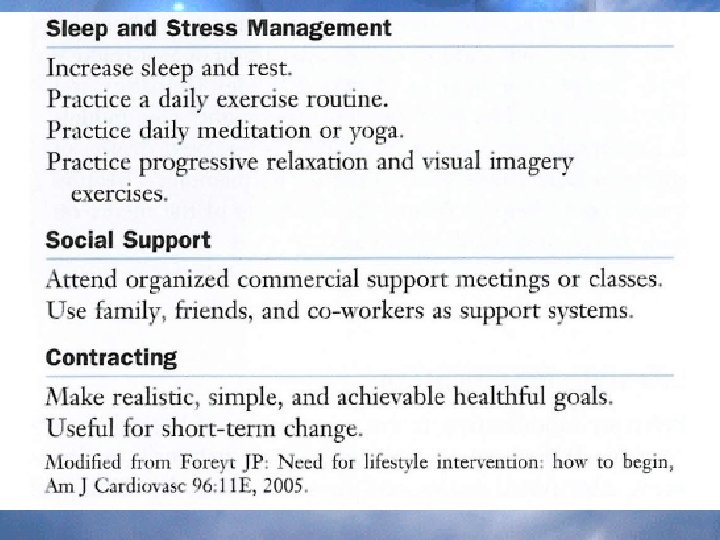
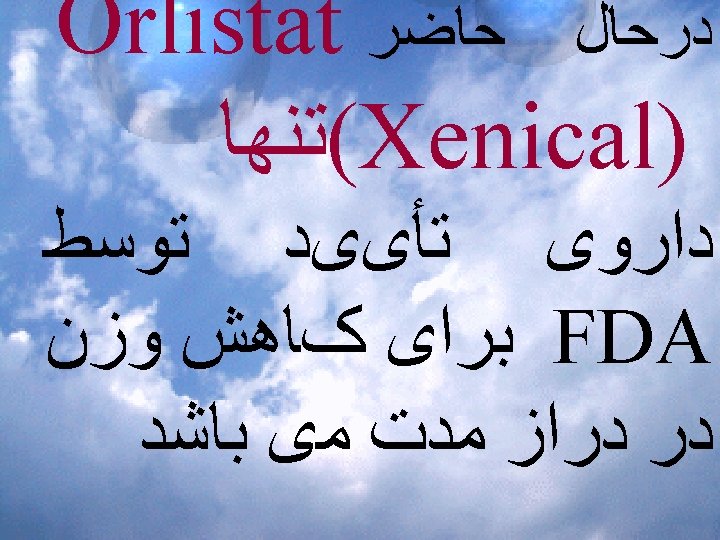
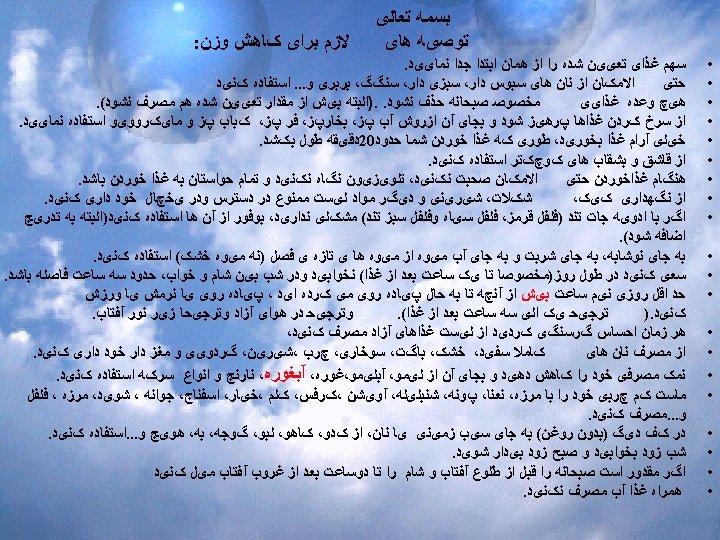
ﺭﻭﺵ ﻫﺎی کﺎﻫﺶ ﻭﺯﻥ 1. Dietary Modification 2. Exercise 3. Lifestyle Modification 4. 5. 6. 7. 8. } ���� ���� Pharmaceutical Management Surgical Procedures Jaw wiring (Maxillomandibular Fixation) Liposuction. . .

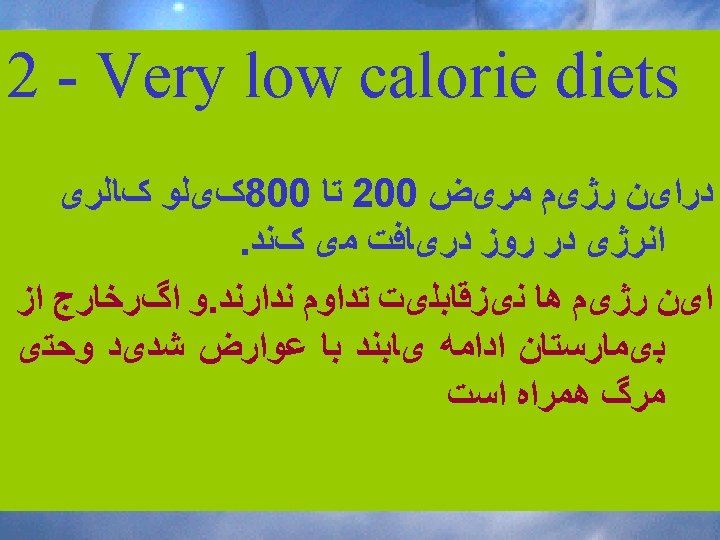
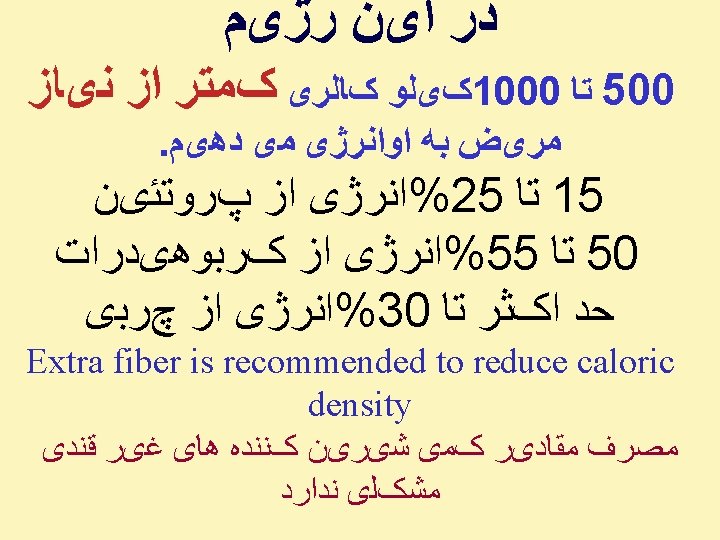
Dietary Modification 1. Starvation 2. Very low calorie diets 3. Balanced energy restricted diet (LCD) . ﻣی ﺑﺎﺷﺪ 3 ﺗﻨﻬﺎ ﺭﻭﺵ ﺑﻪ ﻣﻌﻨی ﻭﺍﻗﻌی ﻫﻤﺎﻥ ﺭﻭﺵ


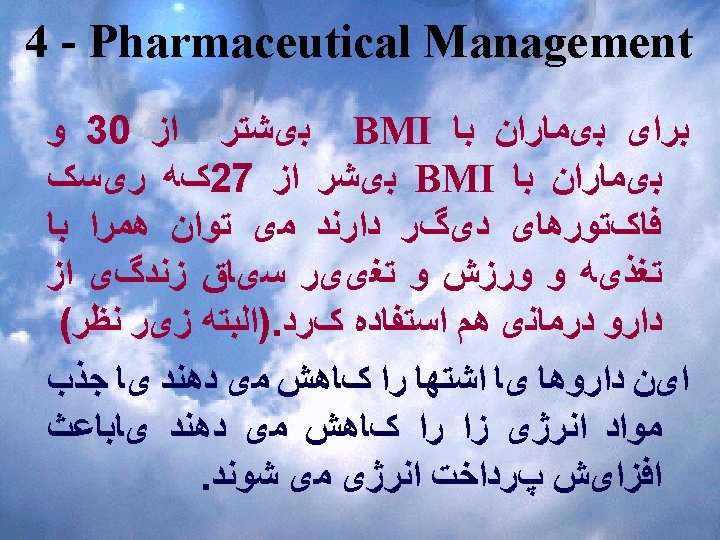

Medications currently available can be categorized as CNS acting agents and non CNS acting agents. The CNS acting agents fall into the categories of catecholaminergic agents, serotoninergic agents, and combination catecholaminergicmtoninergic agents. Common side effects of CNS acting agents are dry mouth, headache, insomnia, and constipation
, surgical intervention")
5 - Surgical Procedures For morbid obesity (BMI of 40 or greater), surgical intervention may be required.
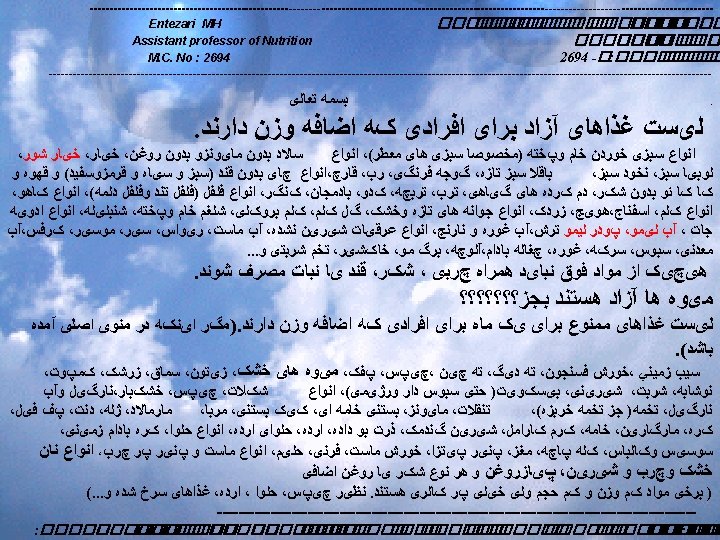

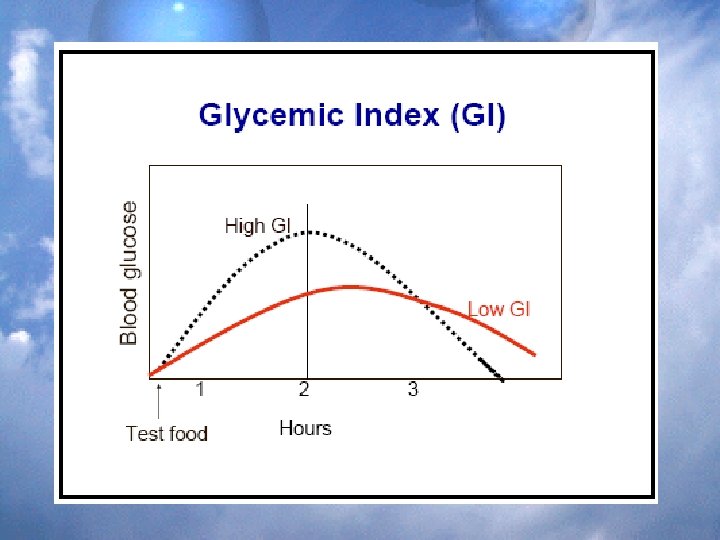
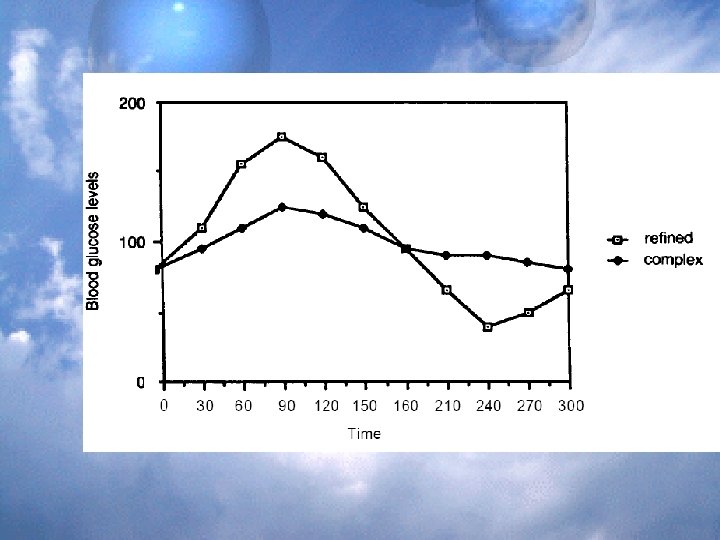
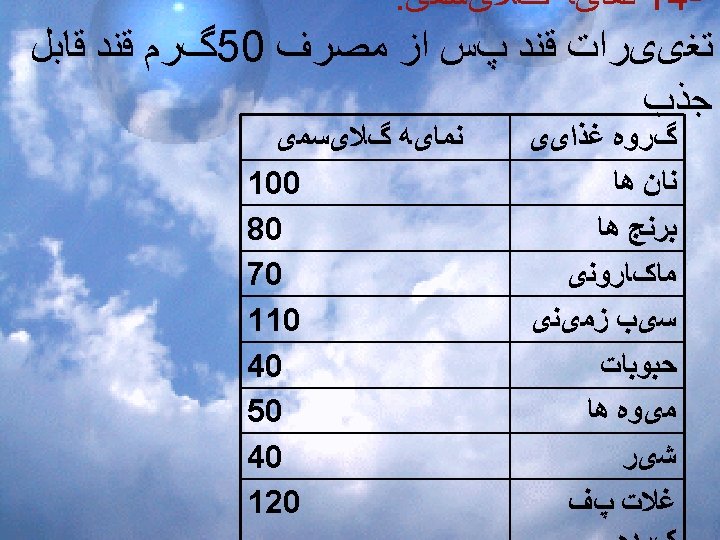
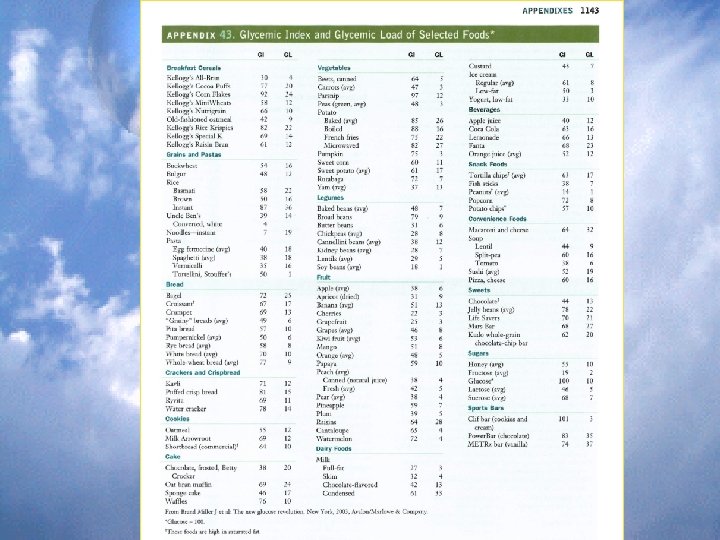
SELECT LOW GLYCEMIC LOW FAT FOODS


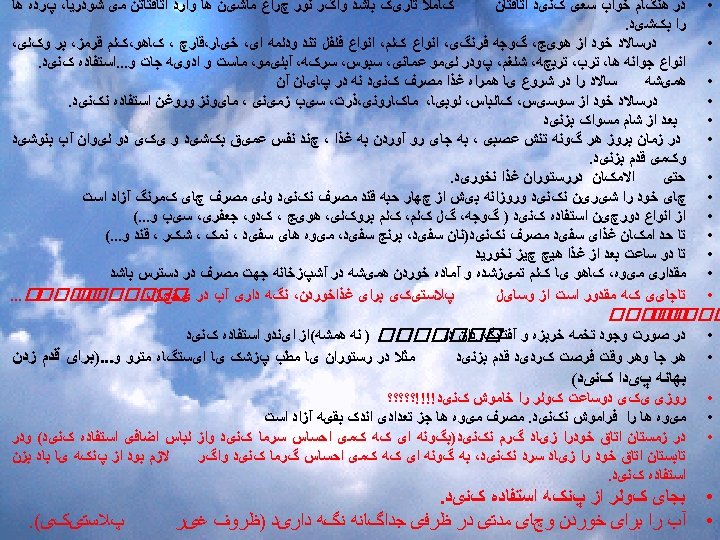


WEIGHT CYCLING


Physical triggers for hunger are much stronger than those for satiety, and it is easier to override the signals for satiety.

Examples of suspected obesogens in the environment and food supply are bisphenol A and phthalates which are found in many plastics used in food packaging and which migrate into foods processed or stored in them

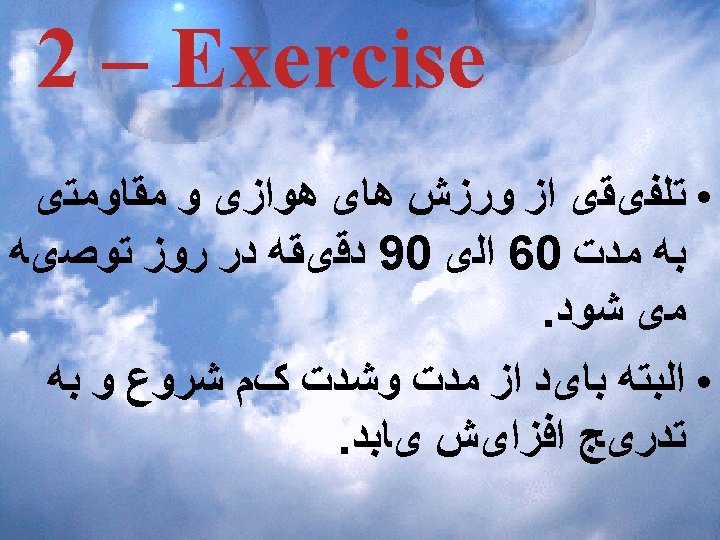
Adequate levels of physical activity appear to be 60 to 90 minutes daily, as recommended by the
- Slides: 143