
Obesity is a chronic disease Dr Majid Valizadeh
Obesity is a chronic disease Dr. Majid Valizadeh Endocrinnologist Prevention and Treatment Obesity research center

Outlines: • Definition • Epidemiology • Complications • Etiology • Treatment
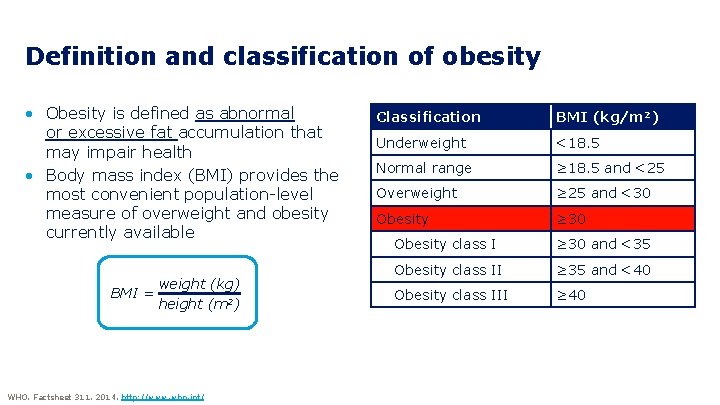
Definition and classification of obesity • Obesity is defined as abnormal or excessive fat accumulation that may impair health • Body mass index (BMI) provides the most convenient population-level measure of overweight and obesity currently available BMI = weight (kg) height (m 2) WHO. Factsheet 311. 2014. http: //www. who. int/ Classification BMI (kg/m 2) Underweight <18. 5 Normal range ≥ 18. 5 and <25 Overweight ≥ 25 and <30 Obesity ≥ 30 Obesity class I ≥ 30 and <35 Obesity class II ≥ 35 and <40 Obesity class III ≥ 40
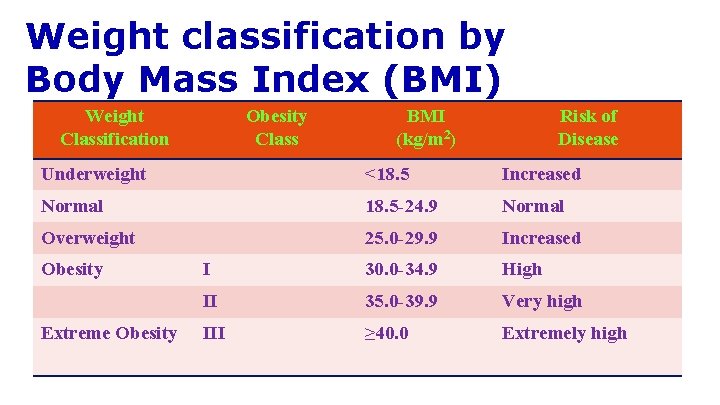
Weight classification by Body Mass Index (BMI) Weight Classification Obesity Class BMI (kg/m 2) Risk of Disease Underweight <18. 5 Increased Normal 18. 5 -24. 9 Normal Overweight 25. 0 -29. 9 Increased I 30. 0 -34. 9 High II 35. 0 -39. 9 Very high III ≥ 40. 0 Extremely high Obesity Extreme Obesity
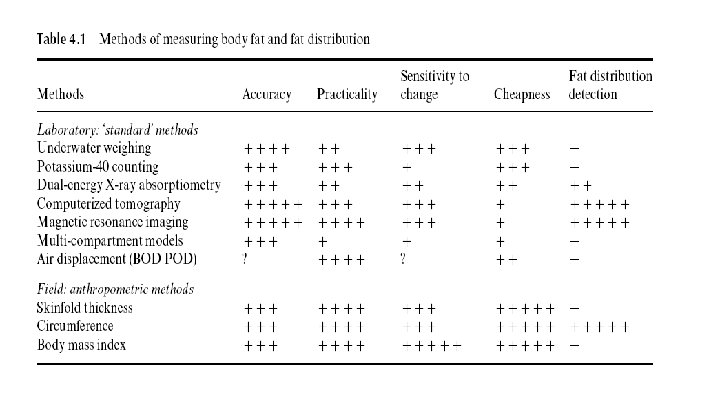
ADVANTAGES OF ANTHROPOMETRY • Objective with high specificity & sensitivity • Readings are numerical & gradable on standard growth charts • Readings are reproducible. • Non-expensive & need minimal training
Limitations of Anthropometry v. Inter-observers errors in measurement v. Problems with reference standards, i. e. local versus international standards. v. Arbitrary statistical cut-off levels for what considered as abnormal values.
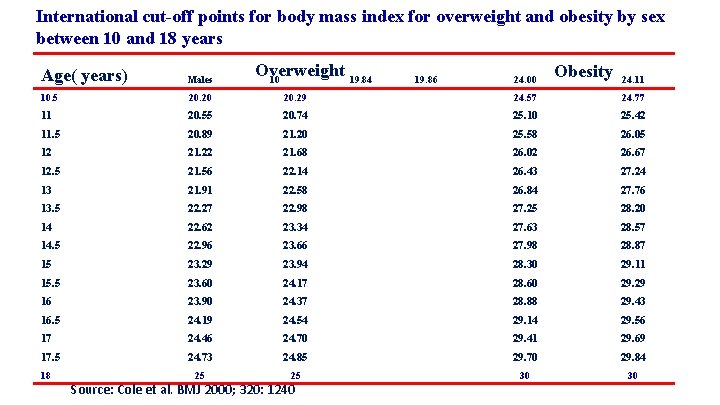
International cut-off points for body mass index for overweight and obesity by sex between 10 and 18 years Overweight 10 19. 84 Obesity Age( years) Males 10. 5 20. 20 20. 29 24. 57 24. 77 11 20. 55 20. 74 25. 10 25. 42 11. 5 20. 89 21. 20 25. 58 26. 05 12 21. 22 21. 68 26. 02 26. 67 12. 5 21. 56 22. 14 26. 43 27. 24 13 21. 91 22. 58 26. 84 27. 76 13. 5 22. 27 22. 98 27. 25 28. 20 14 22. 62 23. 34 27. 63 28. 57 14. 5 22. 96 23. 66 27. 98 28. 87 15 23. 29 23. 94 28. 30 29. 11 15. 5 23. 60 24. 17 28. 60 29. 29 16 23. 90 24. 37 28. 88 29. 43 16. 5 24. 19 24. 54 29. 14 29. 56 17 24. 46 24. 70 29. 41 29. 69 17. 5 24. 73 24. 85 29. 70 29. 84 25 25 30 30 18 Source: Cole et al. BMJ 2000; 320: 1240 19. 86 24. 00 24. 11
THE GLOBAL EPIDEMIC OF OBESITY
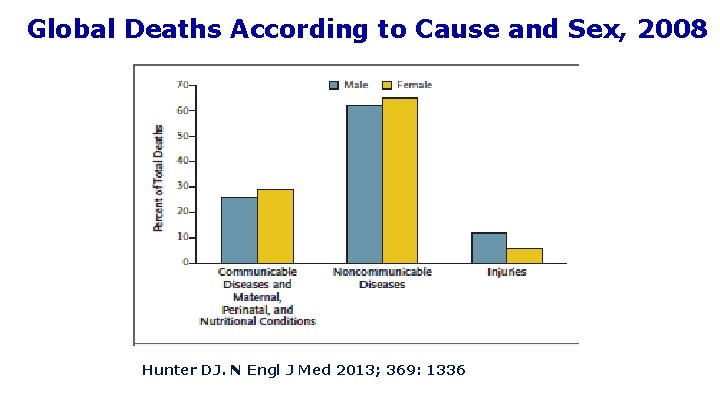
Global Deaths According to Cause and Sex, 2008 Hunter DJ. N Engl J Med 2013; 369: 1336
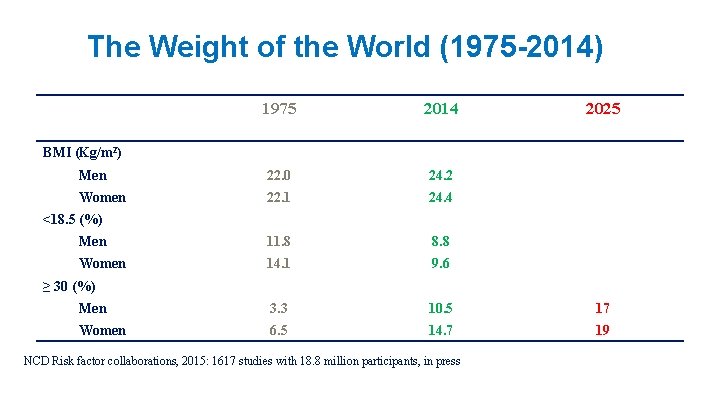
The Weight of the World (1975 -2014) 1975 2014 2025 Men 22. 0 24. 2 Women 22. 1 24. 4 Men 11. 8 8. 8 Women 14. 1 9. 6 Men 3. 3 10. 5 17 Women 6. 5 14. 7 19 BMI (Kg/m 2) <18. 5 (%) ≥ 30 (%) NCD Risk factor collaborations, 2015: 1617 studies with 18. 8 million participants, in press
Global issues of obesity In 2010, elevated BMI accounted for about 2· 8 million deaths each year, and diet-related risk factors (eg, low fruit consumption and high sodium intake) and physical inactivity accounted for 10% of global disability-adjusted life-years. Roberto CA, et al. Patchy progress on obesity prevention: emerging examples, entrenched barriers, and new thinking. The Lancet. 2015; 385: 2400.
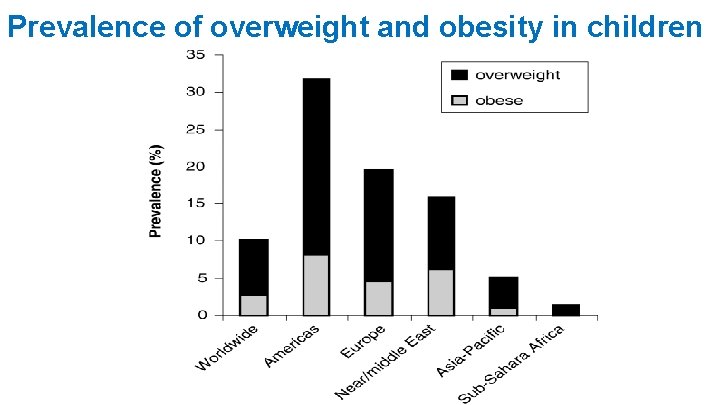
Prevalence of overweight and obesity in children
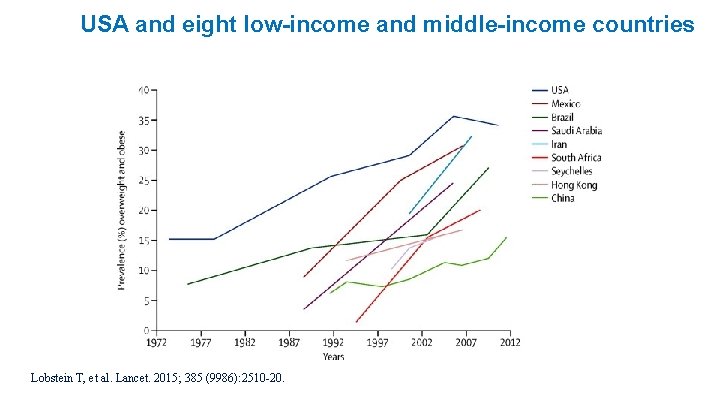
USA and eight low-income and middle-income countries Lobstein T, et al. Lancet. 2015; 385 (9986): 2510 -20.
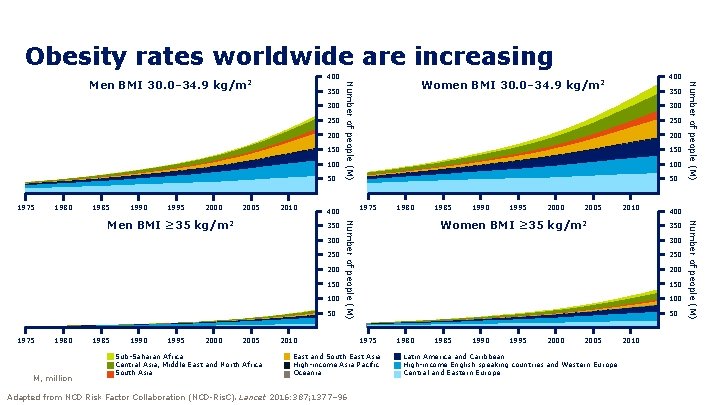
Obesity rates worldwide are increasing 400 300 250 200 150 100 50 1975 1980 1985 1990 1995 2005 2010 300 250 200 150 100 50 1975 1980 M, million 1985 1990 1995 2000 2005 Sub-Saharan Africa Central Asia, Middle East and North Africa South Asia 200 150 100 50 1975 400 350 250 1980 2010 1995 Women BMI ≥ 35 2000 2005 2010 kg/m 2 400 350 300 250 200 150 100 50 1975 East and South East Asia High-income Asia Pacific Oceania Adapted from NCD Risk Factor Collaboration (NCD-Ris. C). Lancet 2016: 387; 1377– 96 1985 1980 1985 1990 1995 2000 2005 Latin America and Caribbean High-income English speaking countries and Western Europe Central and Eastern Europe 2010 Number of people (M) kg/m 2 300 Number of people (M) Men BMI ≥ 35 2000 350 Number of people (M) 350 400 Women BMI 30. 0– 34. 9 kg/m 2 Number of people (M) Men BMI 30. 0– 34. 9 kg/m 2
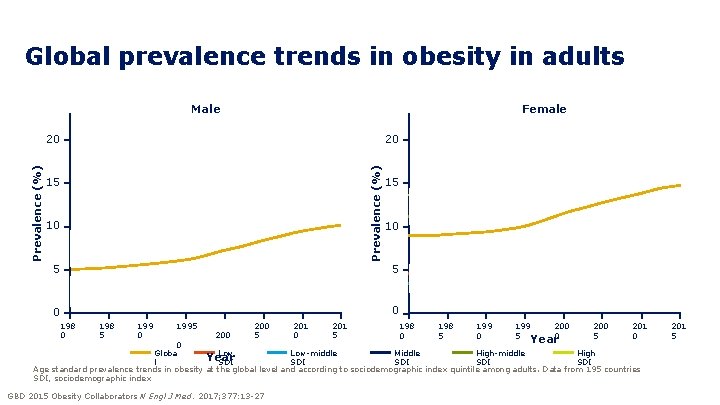
Global prevalence trends in obesity in adults Male Female 20 Prevalence (%) 20 15 10 5 0 0 198 5 199 0 1995 200 5 201 0 201 5 198 0 198 5 199 0 199 5 200 Year 0 200 5 201 0 0 Globa Low-middle Middle High-middle High Year l SDI SDI SDI Age standard prevalence trends in obesity at the global level and according to sociodemographic index quintile among adults. Data from 195 countries SDI, sociodemographic index GBD 2015 Obesity Collaborators N Engl J Med. 2017; 377: 13 -27 201 5
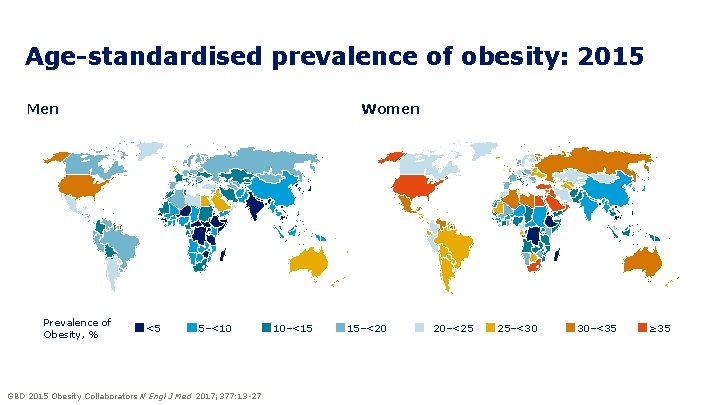
Age-standardised prevalence of obesity: 2015 Men Prevalence of Obesity, % Women <5 5–<10 GBD 2015 Obesity Collaborators N Engl J Med 2017; 377: 13 -27 10–<15 15–<20 20–<25 25–<30 30–<35 ≥ 35
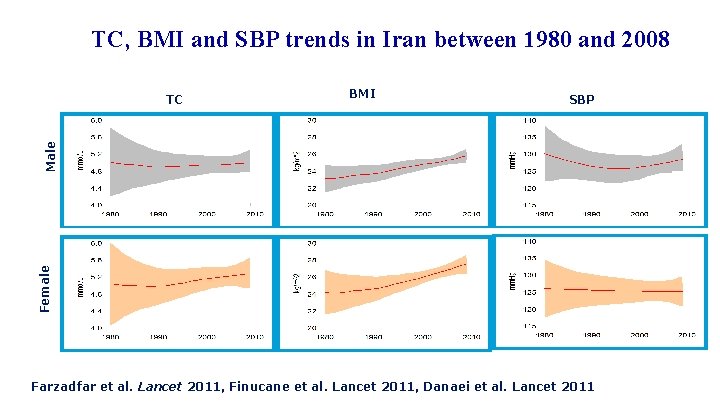
TC, BMI and SBP trends in Iran between 1980 and 2008 BMI SBP Female Male TC Farzadfar et al. Lancet 2011, Finucane et al. Lancet 2011, Danaei et al. Lancet 2011
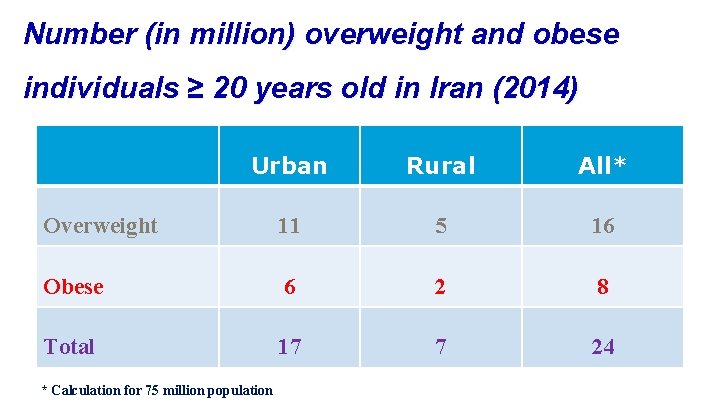
Number (in million) overweight and obese individuals ≥ 20 years old in Iran (2014) Urban Rural All* Overweight 11 5 16 Obese 6 2 8 Total 17 7 24 * Calculation for 75 million population
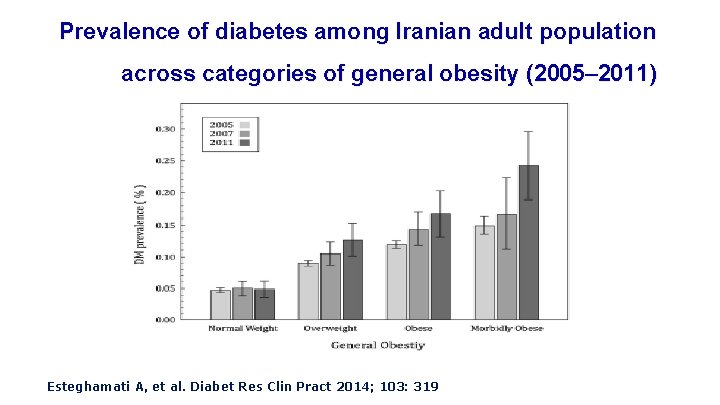
Prevalence of diabetes among Iranian adult population across categories of general obesity (2005– 2011) Esteghamati A, et al. Diabet Res Clin Pract 2014; 103: 319
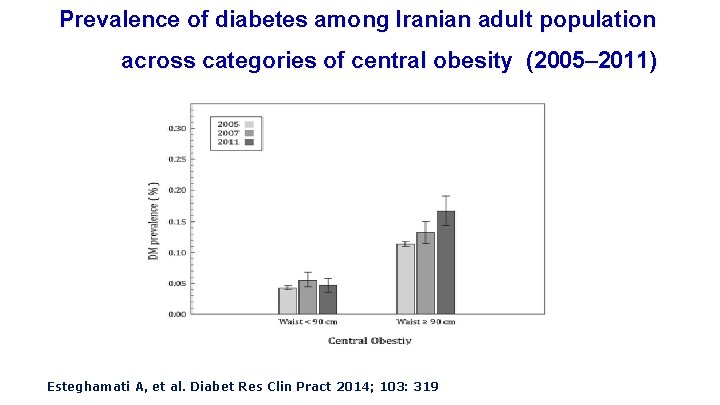
Prevalence of diabetes among Iranian adult population across categories of central obesity (2005– 2011) Esteghamati A, et al. Diabet Res Clin Pract 2014; 103: 319
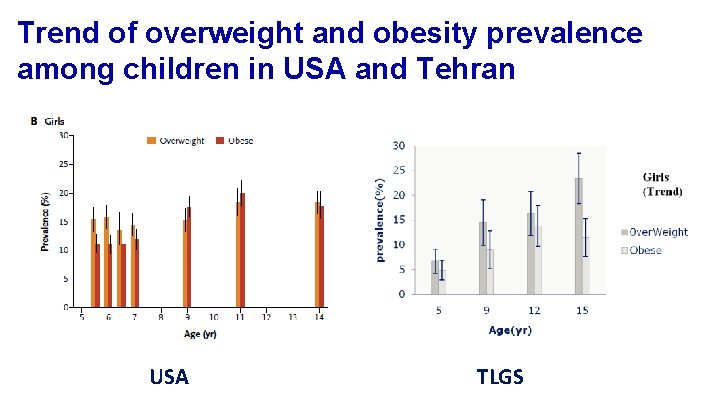
Trend of overweight and obesity prevalence among children in USA and Tehran USA TLGS
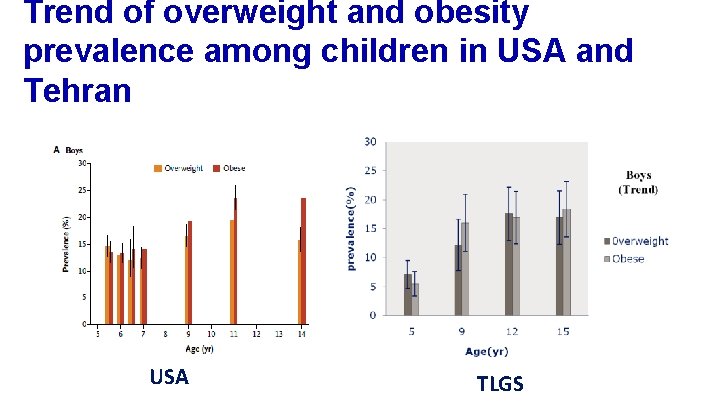
Trend of overweight and obesity prevalence among children in USA and Tehran USA TLGS
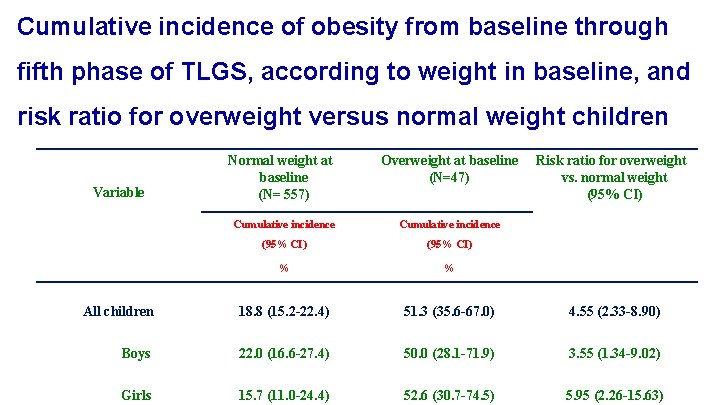
Cumulative incidence of obesity from baseline through fifth phase of TLGS, according to weight in baseline, and risk ratio for overweight versus normal weight children Variable Normal weight at baseline (N= 557) Overweight at baseline (N=47) Risk ratio for overweight vs. normal weight (95% CI) Cumulative incidence (95% CI) % % All children 18. 8 (15. 2 -22. 4) 51. 3 (35. 6 -67. 0) 4. 55 (2. 33 -8. 90) Boys 22. 0 (16. 6 -27. 4) 50. 0 (28. 1 -71. 9) 3. 55 (1. 34 -9. 02) Girls 15. 7 (11. 0 -24. 4) 52. 6 (30. 7 -74. 5) 5. 95 (2. 26 -15. 63)
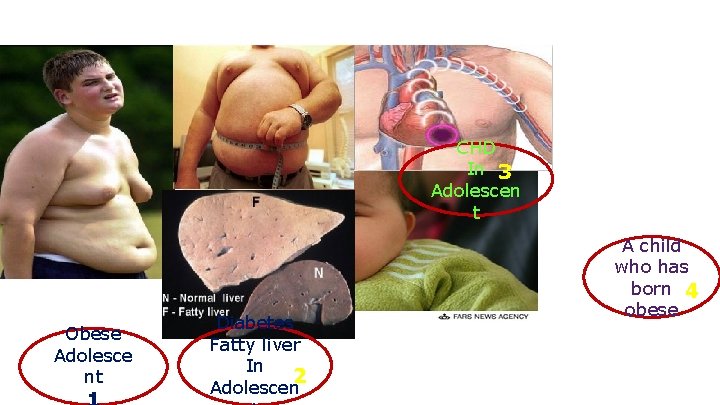
CHD In 3 Adolescen t Obese Adolesce nt Diabetes Fatty liver In 2 Adolescen A child who has born 4 obese
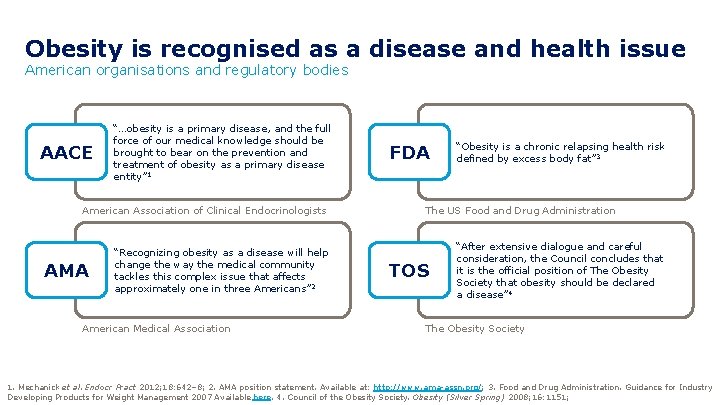
Obesity is recognised as a disease and health issue American organisations and regulatory bodies AACE “…obesity is a primary disease, and the full force of our medical knowledge should be brought to bear on the prevention and treatment of obesity as a primary disease entity” 1 American Association of Clinical Endocrinologists AMA “Recognizing obesity as a disease will help change the way the medical community tackles this complex issue that affects approximately one in three Americans” 2 American Medical Association FDA “Obesity is a chronic relapsing health risk defined by excess body fat” 3 The US Food and Drug Administration TOS “After extensive dialogue and careful consideration, the Council concludes that it is the official position of The Obesity Society that obesity should be declared a disease” 4 The Obesity Society 1. Mechanick et al. Endocr Pract 2012; 18: 642– 8; 2. AMA position statement. Available at: http: //www. ama-assn. org/; 3. Food and Drug Administration. Guidance for Industry Developing Products for Weight Management 2007 Available here. 4. Council of the Obesity Society. Obesity (Silver Spring) 2008; 16: 1151;
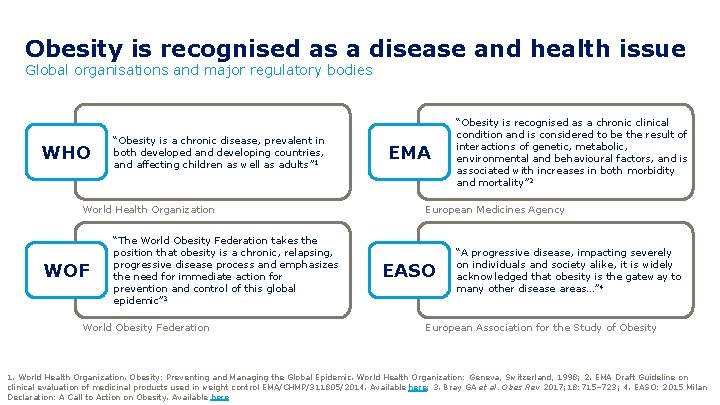
Obesity is recognised as a disease and health issue Global organisations and major regulatory bodies WHO “Obesity is a chronic disease, prevalent in both developed and developing countries, and affecting children as well as adults” 1 World Health Organization WOF “The World Obesity Federation takes the position that obesity is a chronic, relapsing, progressive disease process and emphasizes the need for immediate action for prevention and control of this global epidemic” 3 World Obesity Federation EMA “Obesity is recognised as a chronic clinical condition and is considered to be the result of interactions of genetic, metabolic, environmental and behavioural factors, and is associated with increases in both morbidity and mortality” 2 European Medicines Agency EASO “A progressive disease, impacting severely on individuals and society alike, it is widely acknowledged that obesity is the gateway to many other disease areas…” 4 European Association for the Study of Obesity 1. World Health Organization. Obesity: Preventing and Managing the Global Epidemic. World Health Organization: Geneva, Switzerland, 1998; 2. EMA Draft Guideline on clinical evaluation of medicinal products used in weight control EMA/CHMP/311805/2014. Available here; 3. Bray GA et al. Obes Rev 2017; 18: 715– 723; 4. EASO: 2015 Milan Declaration: A Call to Action on Obesity. Available here
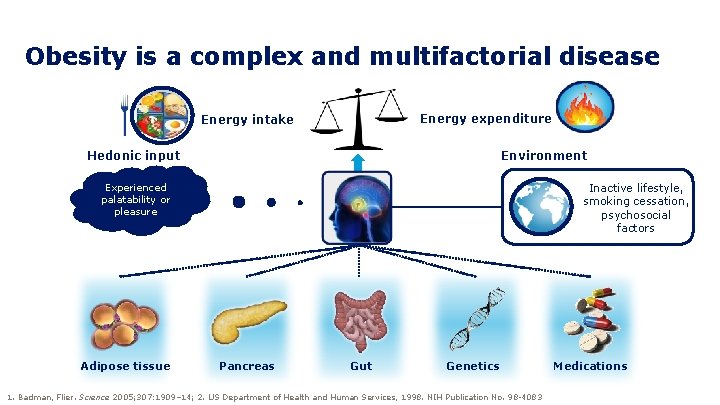
Obesity is a complex and multifactorial disease Energy expenditure Energy intake Environment Hedonic input Experienced palatability or pleasure Adipose tissue Inactive lifestyle, smoking cessation, psychosocial factors Pancreas Gut Genetics 1. Badman, Flier. Science 2005; 307: 1909– 14; 2. US Department of Health and Human Services, 1998. NIH Publication No. 98 -4083 Medications
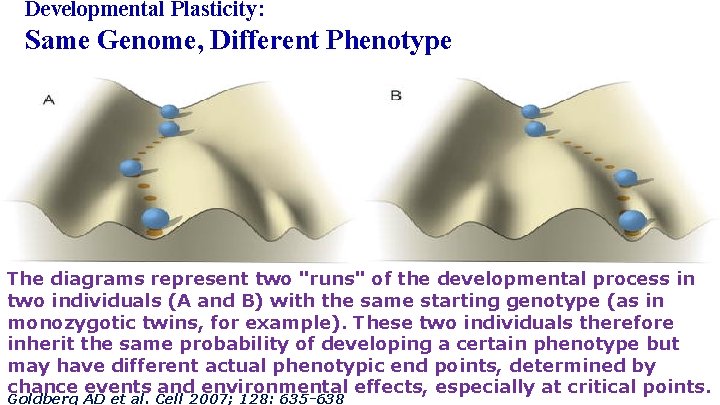
Developmental Plasticity: Same Genome, Different Phenotype The diagrams represent two "runs" of the developmental process in two individuals (A and B) with the same starting genotype (as in monozygotic twins, for example). These two individuals therefore inherit the same probability of developing a certain phenotype but may have different actual phenotypic end points, determined by chance events and environmental effects, especially at critical points. Goldberg AD et al. Cell 2007; 128: 635 -638
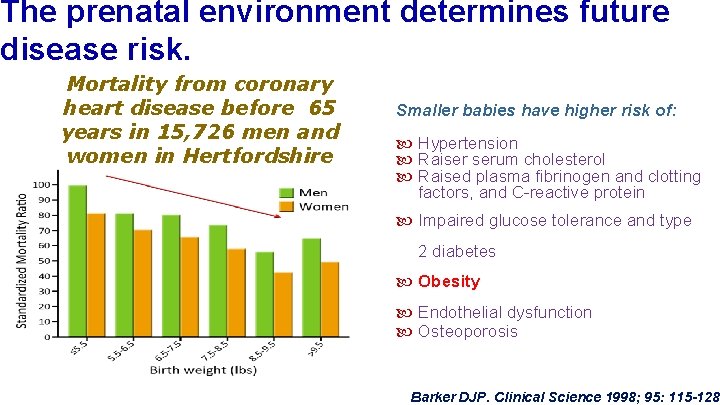
The prenatal environment determines future disease risk. Mortality from coronary heart disease before 65 years in 15, 726 men and women in Hertfordshire Smaller babies have higher risk of: Hypertension Raiser serum cholesterol Raised plasma fibrinogen and clotting factors, and C-reactive protein Impaired glucose tolerance and type 2 diabetes Obesity Endothelial dysfunction Osteoporosis Barker DJP. Clinical Science 1998; 95: 115 -128.
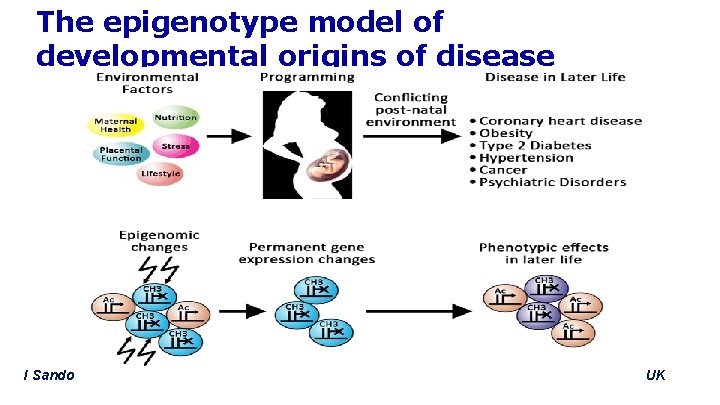
The epigenotype model of developmental origins of disease I Sandovici et al. Epigenetics 2008, Horizon Scientific Press/Caister Academic Press, Norfolk, UK
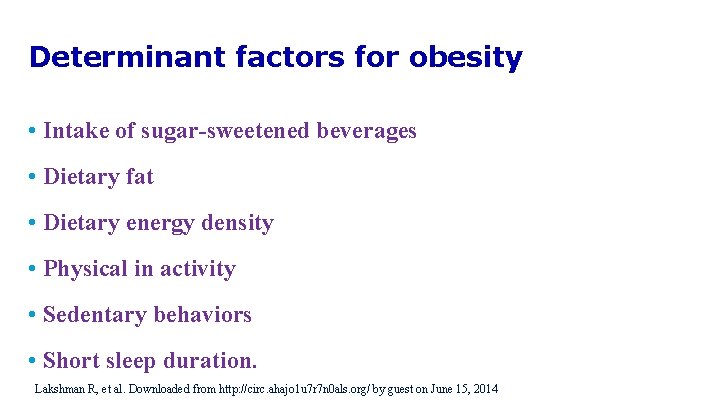
Determinant factors for obesity • Intake of sugar-sweetened beverages • Dietary fat • Dietary energy density • Physical in activity • Sedentary behaviors • Short sleep duration. Lakshman R, et al. Downloaded from http: //circ. ahajo 1 u 7 r 7 n 0 als. org/ by guest on June 15, 2014
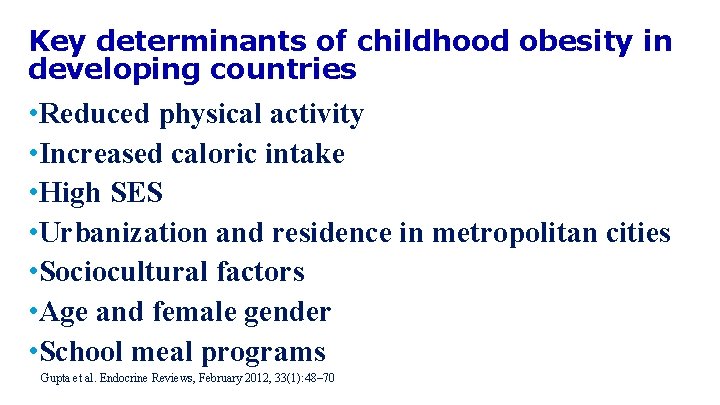
Key determinants of childhood obesity in developing countries • Reduced physical activity • Increased caloric intake • High SES • Urbanization and residence in metropolitan cities • Sociocultural factors • Age and female gender • School meal programs Gupta et al. Endocrine Reviews, February 2012, 33(1): 48– 70
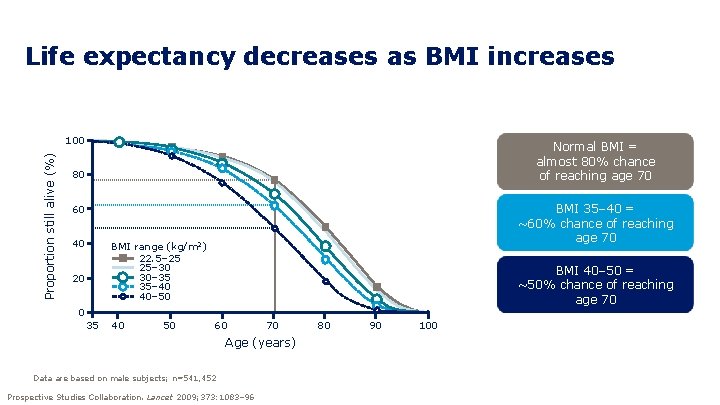
Life expectancy decreases as BMI increases Proportion still alive (%) 100 Normal BMI = almost 80% chance of reaching age 70 80 BMI 35– 40 = ~60% chance of reaching age 70 60 40 BMI range (kg/m 2) 22. 5– 25 25– 30 30– 35 35– 40 40– 50 20 BMI 40– 50 = ~50% chance of reaching age 70 0 35 40 50 60 70 Age (years) Data are based on male subjects; n=541, 452 Prospective Studies Collaboration. Lancet 2009; 373: 1083– 96 80 90 100
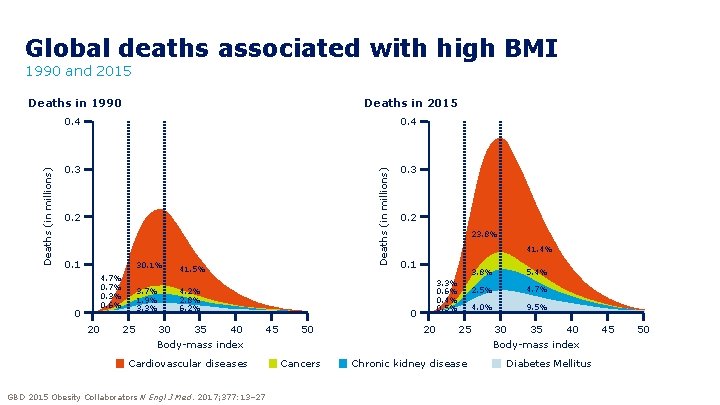
Global deaths associated with high BMI 1990 and 2015 0. 4 0. 3 Deaths (in millions) Deaths in 2015 Deaths (in millions) Deaths in 1990 0. 2 0. 1 30. 1% 4. 7% 0. 3% 0. 6% 0 20 3. 7% 1. 9% 3. 3% 25 41. 5% 4. 2% 2. 8% 6. 2% 30 35 40 Body-mass index 0. 2 23. 8% 41. 4% 0. 1 3. 3% 0. 6% 0. 4% 0. 5% 0 45 Cardiovascular diseases GBD 2015 Obesity Collaborators N Engl J Med. 2017; 377: 13– 27 50 Cancers 20 25 Chronic kidney disease 3. 8% 5. 4% 2. 5% 4. 7% 4. 0% 9. 5% 30 35 40 Body-mass index Diabetes Mellitus 45 50
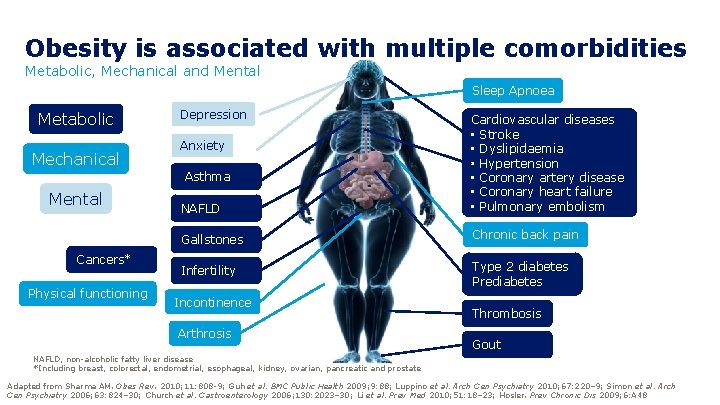
Obesity is associated with multiple comorbidities Metabolic, Mechanical and Mental Sleep Apnoea Metabolic Mechanical Depression NAFLD Cardiovascular diseases • Stroke • Dyslipidaemia • Hypertension • Coronary artery disease • Coronary heart failure • Pulmonary embolism Gallstones Chronic back pain Infertility Type 2 diabetes Prediabetes Anxiety Asthma Mental Cancers* Physical functioning Incontinence Arthrosis Thrombosis Gout NAFLD, non-alcoholic fatty liver disease *Including breast, colorectal, endometrial, esophageal, kidney, ovarian, pancreatic and prostate Adapted from Sharma AM. Obes Rev. 2010; 11: 808 -9; Guh et al. BMC Public Health 2009; 9: 88; Luppino et al. Arch Gen Psychiatry 2010; 67: 220– 9; Simon et al. Arch Gen Psychiatry 2006; 63: 824– 30; Church et al. Gastroenterology 2006; 130: 2023– 30; Li et al. Prev Med 2010; 51: 18– 23; Hosler. Prev Chronic Dis 2009; 6: A 48
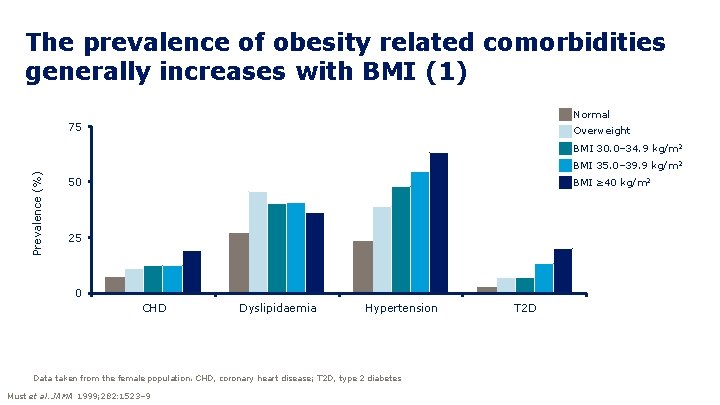
The prevalence of obesity related comorbidities generally increases with BMI (1) Normal 75 Overweight Prevalence (%) BMI 30. 0– 34. 9 kg/m 2 BMI 35. 0– 39. 9 kg/m 2 50 BMI ≥ 40 kg/m 2 25 0 CHD Dyslipidaemia Hypertension Data taken from the female population. CHD, coronary heart disease; T 2 D, type 2 diabetes Must et al. JAMA 1999; 282: 1523– 9 T 2 D
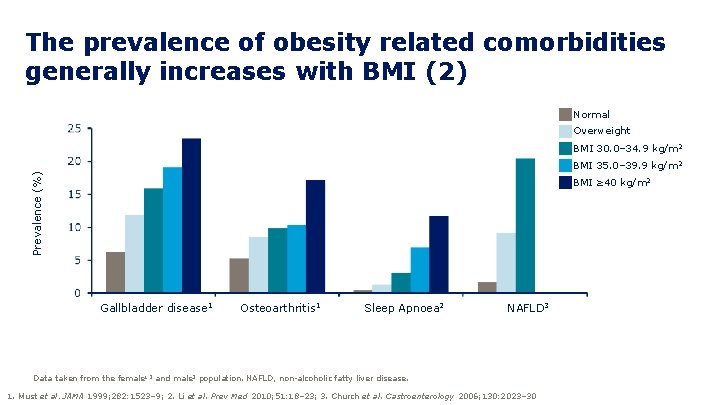
The prevalence of obesity related comorbidities generally increases with BMI (2) Normal Overweight BMI 30. 0– 34. 9 kg/m 2 Prevalence (%) BMI 35. 0– 39. 9 kg/m 2 BMI ≥ 40 kg/m 2 Gallbladder disease 1 Osteoarthritis 1 Sleep Apnoea 2 NAFLD 3 Data taken from the female 1, 2 and male 3 population. NAFLD, non-alcoholic fatty liver disease. 1. Must et al. JAMA 1999; 282: 1523– 9; 2. Li et al. Prev Med 2010; 51: 18– 23; 3. Church et al. Gastroenterology 2006; 130: 2023– 30
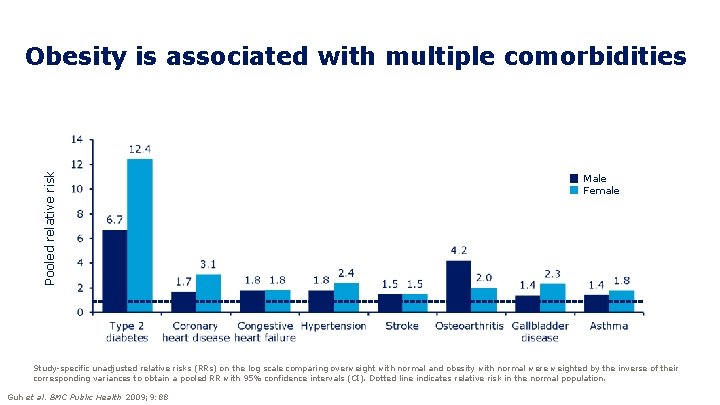
Pooled relative risk Obesity is associated with multiple comorbidities Male Female Study-specific unadjusted relative risks (RRs) on the log scale comparing overweight with normal and obesity with normal were weighted by the inverse of their corresponding variances to obtain a pooled RR with 95% confidence intervals (CI). Dotted line indicates relative risk in the normal population. Guh et al. BMC Public Health 2009; 9: 88
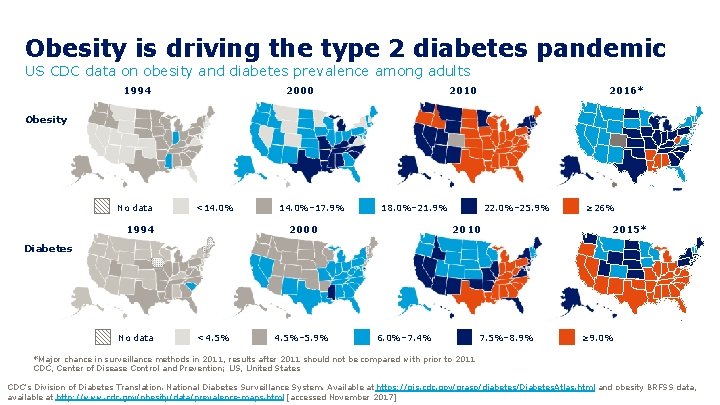
Obesity is driving the type 2 diabetes pandemic US CDC data on obesity and diabetes prevalence among adults 1994 2000 2016* Obesity No data <14. 0% 1994 14. 0%– 17. 9% 18. 0%– 21. 9% 2000 22. 0%– 25. 9% 2010 ≥ 26% 2015* Diabetes No data <4. 5%– 5. 9% 6. 0%– 7. 4% 7. 5%– 8. 9% ≥ 9. 0% *Major chance in surveillance methods in 2011, results after 2011 should not be compared with prior to 2011 CDC, Center of Disease Control and Prevention; US, United States CDC’s Division of Diabetes Translation. National Diabetes Surveillance System. Available at https: //gis. cdc. gov/grasp/diabetes/Diabetes. Atlas. html and obesity BRFSS data, available at http: //www. cdc. gov/obesity/data/prevalence-maps. html [accessed November 2017]
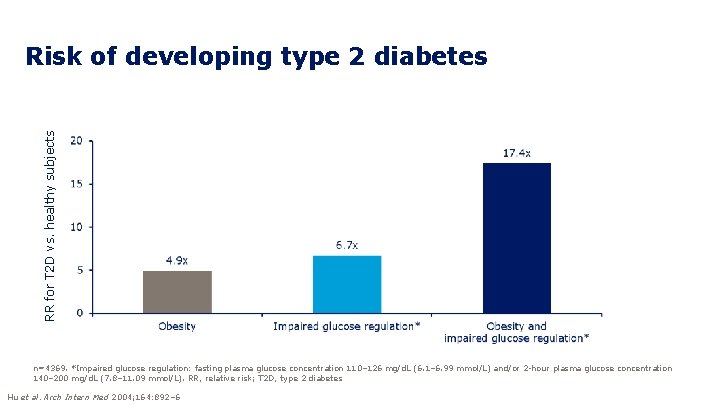
RR for T 2 D vs. healthy subjects Risk of developing type 2 diabetes n=4369. *Impaired glucose regulation: fasting plasma glucose concentration 110– 126 mg/d. L (6. 1– 6. 99 mmol/L) and/or 2 -hour plasma glucose concentration 140– 200 mg/d. L (7. 8– 11. 09 mmol/L). RR, relative risk; T 2 D, type 2 diabetes Hu et al. Arch Intern Med 2004; 164: 892– 6
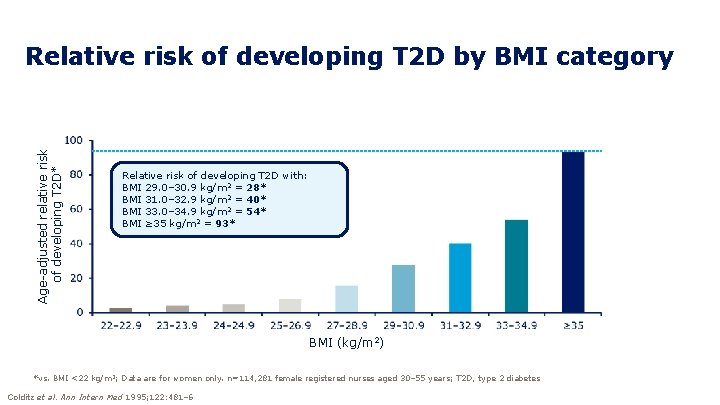
Age-adjusted relative risk of developing T 2 D* Relative risk of developing T 2 D by BMI category Relative risk of developing T 2 D with: BMI 29. 0– 30. 9 kg/m 2 = 28* BMI 31. 0– 32. 9 kg/m 2 = 40* BMI 33. 0– 34. 9 kg/m 2 = 54* BMI ≥ 35 kg/m 2 = 93* BMI (kg/m 2) *vs. BMI <22 kg/m 2; Data are for women only. n=114, 281 female registered nurses aged 30– 55 years; T 2 D, type 2 diabetes Colditz et al. Ann Intern Med 1995; 122: 481– 6
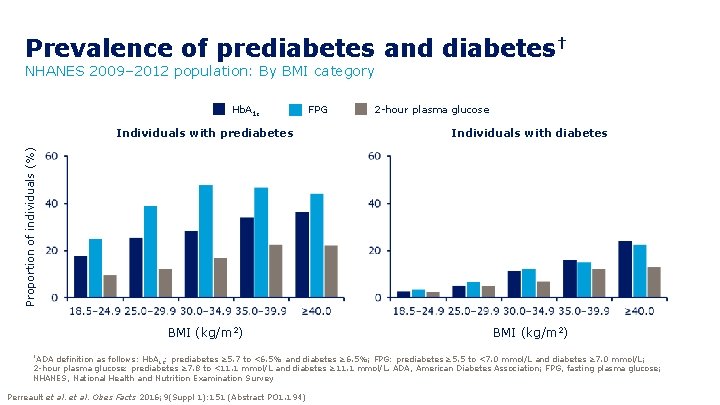
Prevalence of prediabetes and diabetes† NHANES 2009– 2012 population: By BMI category Hb. A 1 c FPG 2 -hour plasma glucose Individuals with diabetes BMI (kg/m 2) Proportion of individuals (%) Individuals with prediabetes †ADA definition as follows: Hb. A 1 c: prediabetes ≥ 5. 7 to <6. 5% and diabetes ≥ 6. 5%; FPG: prediabetes ≥ 5. 5 to <7. 0 mmol/L and diabetes ≥ 7. 0 mmol/L; 2 -hour plasma glucose: prediabetes ≥ 7. 8 to <11. 1 mmol/L and diabetes ≥ 11. 1 mmol/L. ADA, American Diabetes Association; FPG, fasting plasma glucose; NHANES, National Health and Nutrition Examination Survey Perreault et al. Obes Facts 2016; 9(Suppl 1): 151 (Abstract PO 1. 194)
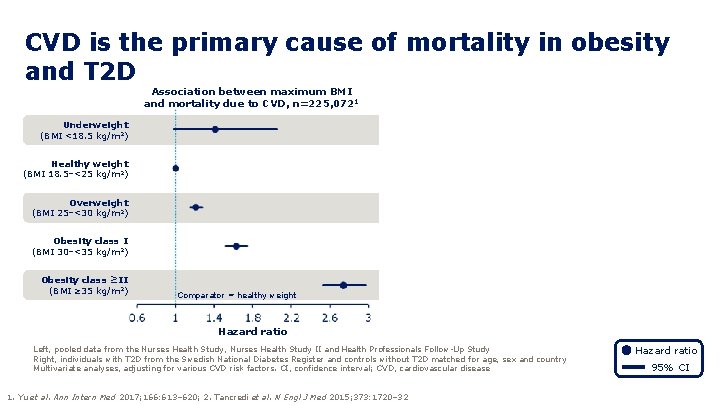
CVD is the primary cause of mortality in obesity and T 2 D Association between maximum BMI and mortality due to CVD, n=225, 0721 Association between T 2 D and mortality due to CVD (<65 years), n=435, 3692 Underweight (BMI <18. 5 kg/m 2) Hb. A 1 c ≤ 6. 9% Healthy weight (BMI 18. 5–<25 kg/m 2) Hb. A 1 c 7. 0– 7. 8% Overweight (BMI 25–<30 kg/m 2) Hb. A 1 c 7. 9– 8. 7% Obesity class I (BMI 30–<35 kg/m 2) Hb. A 1 c 8. 8– 9. 6% Obesity class ≥II (BMI ≥ 35 kg/m 2) Hb. A 1 c ≥ 9. 7% Comparator = healthy weight Hazard ratio Comparator = control population without T 2 D Hazard ratio Left, pooled data from the Nurses Health Study, Nurses Health Study II and Health Professionals Follow-Up Study Right, individuals with T 2 D from the Swedish National Diabetes Register and controls without T 2 D matched for age, sex and country Multivariate analyses, adjusting for various CVD risk factors. CI, confidence interval; CVD, cardiovascular disease 1. Yu et al. Ann Intern Med 2017; 166: 613– 620; 2. Tancredi et al. N Engl J Med 2015; 373: 1720– 32 Hazard ratio 95% CI
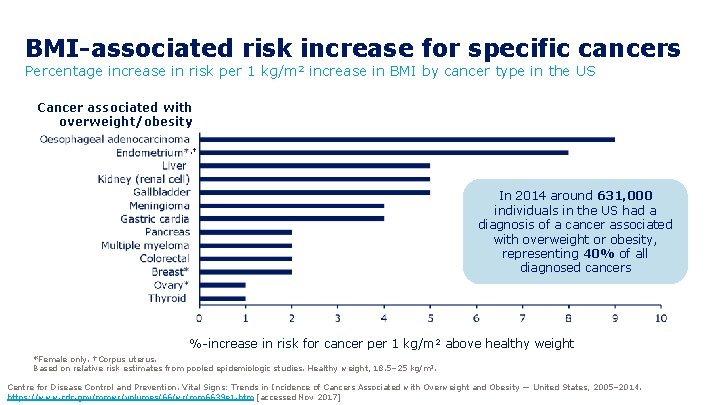
BMI-associated risk increase for specific cancers Percentage increase in risk per 1 kg/m 2 increase in BMI by cancer type in the US Cancer associated with overweight/obesity , † In 2014 around 631, 000 individuals in the US had a diagnosis of a cancer associated with overweight or obesity, representing 40% of all diagnosed cancers %-increase in risk for cancer per 1 kg/m 2 above healthy weight *Female only. †Corpus uterus. Based on relative risk estimates from pooled epidemiologic studies. Healthy weight, 18. 5– 25 kg/m 2. Centre for Disease Control and Prevention. Vital Signs: Trends in Incidence of Cancers Associated with Overweight and Obesity — United States, 2005– 2014. https: //www. cdc. gov/mmwr/volumes/66/wr/mm 6639 e 1. htm [accessed Nov 2017]
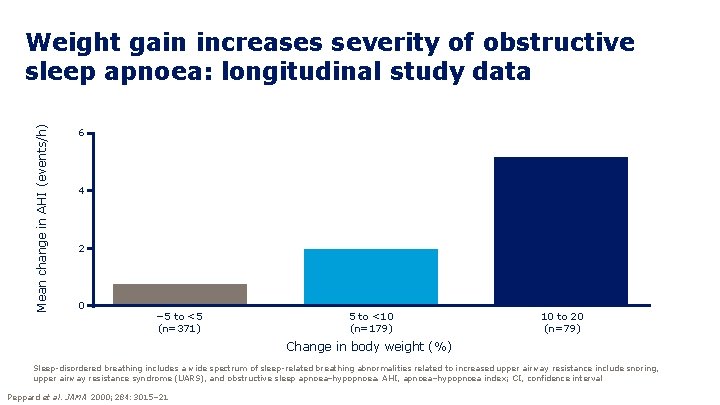
Mean change in AHI (events/h) Weight gain increases severity of obstructive sleep apnoea: longitudinal study data 6 4 2 0 − 5 to <5 (n=371) 5 to <10 (n=179) 10 to 20 (n=79) Change in body weight (%) Sleep-disordered breathing includes a wide spectrum of sleep-related breathing abnormalities related to increased upper airway resistance include snoring, upper airway resistance syndrome (UARS), and obstructive sleep apnoea–hypopnoea. AHI, apnoea–hypopnoea index; CI, confidence interval Peppard et al. JAMA 2000; 284: 3015– 21
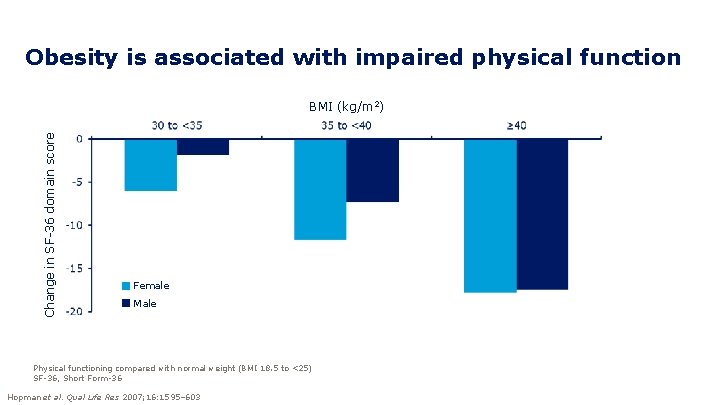
Obesity is associated with impaired physical function Change in SF-36 domain score BMI (kg/m 2) Female Male Physical functioning compared with normal weight (BMI 18. 5 to <25) SF-36, Short Form-36 Hopman et al. Qual Life Res 2007; 16: 1595– 603
Benefits of weight loss
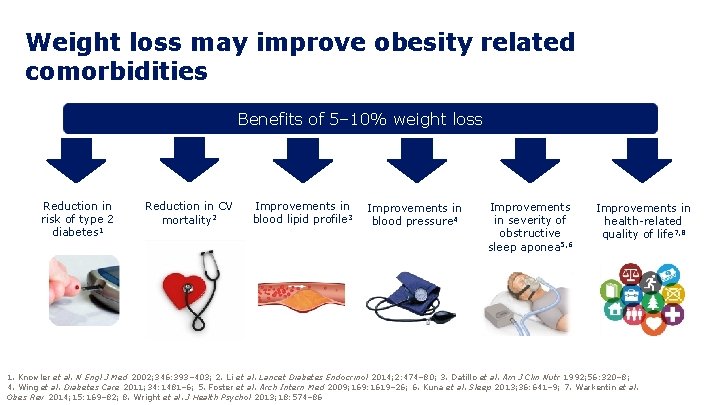
Weight loss may improve obesity related comorbidities Benefits of 5– 10% weight loss Reduction in risk of type 2 diabetes 1 Reduction in CV mortality 2 Improvements in blood lipid profile 3 Improvements in blood pressure 4 Improvements in severity of obstructive sleep aponea 5, 6 Improvements in health-related quality of life 7, 8 1. Knowler et al. N Engl J Med 2002; 346: 393– 403; 2. Li et al. Lancet Diabetes Endocrinol 2014; 2: 474– 80; 3. Datillo et al. Am J Clin Nutr 1992; 56: 320– 8; 4. Wing et al. Diabetes Care 2011; 34: 1481– 6; 5. Foster et al. Arch Intern Med 2009; 169: 1619– 26; 6. Kuna et al. Sleep 2013; 36: 641– 9; 7. Warkentin et al. Obes Rev 2014; 15: 169– 82; 8. Wright et al. J Health Psychol 2013; 18: 574– 86
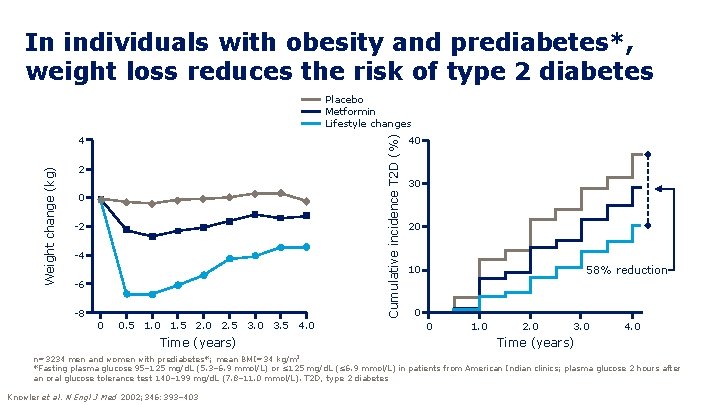
In individuals with obesity and prediabetes*, weight loss reduces the risk of type 2 diabetes Placebo Metformin Lifestyle changes Cumulative incidence T 2 D (%) Weight change (kg) 4 2 0 -2 -4 -6 -8 0 0. 5 1. 0 1. 5 2. 0 2. 5 3. 0 3. 5 4. 0 Time (years) 40 30 20 10 58% reduction 0 0 1. 0 2. 0 3. 0 4. 0 Time (years) kg/m 2 n=3234 men and women with prediabetes*; mean BMI=34 *Fasting plasma glucose 95– 125 mg/d. L (5. 3– 6. 9 mmol/L) or ≤ 125 mg/d. L (≤ 6. 9 mmol/L) in patients from American Indian clinics; plasma glucose 2 hours after an oral glucose tolerance test 140– 199 mg/d. L (7. 8– 11. 0 mmol/L). T 2 D, type 2 diabetes Knowler et al. N Engl J Med 2002; 346: 393– 403
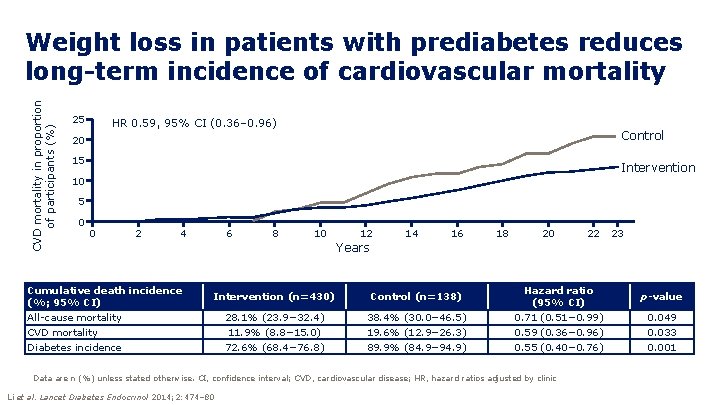
CVD mortality in proportion of participants (%) Weight loss in patients with prediabetes reduces long-term incidence of cardiovascular mortality 25 HR 0. 59, 95% CI (0. 36– 0. 96) Control 20 15 Intervention 10 5 0 0 2 4 Cumulative death incidence (%; 95% CI) All-cause mortality CVD mortality Diabetes incidence 6 8 10 12 14 16 18 20 22 23 Years Intervention (n=430) Control (n=138) 28. 1% (23. 9− 32. 4) 11. 9% (8. 8− 15. 0) 72. 6% (68. 4− 76. 8) 38. 4% (30. 0− 46. 5) 19. 6% (12. 9− 26. 3) 89. 9% (84. 9− 94. 9) Hazard ratio (95% CI) 0. 71 (0. 51− 0. 99) 0. 59 (0. 36− 0. 96) 0. 55 (0. 40− 0. 76) Data are n (%) unless stated otherwise. CI, confidence interval; CVD, cardiovascular disease; HR, hazard ratios adjusted by clinic Li et al. Lancet Diabetes Endocrinol 2014; 2: 474– 80 p-value 0. 049 0. 033 0. 001
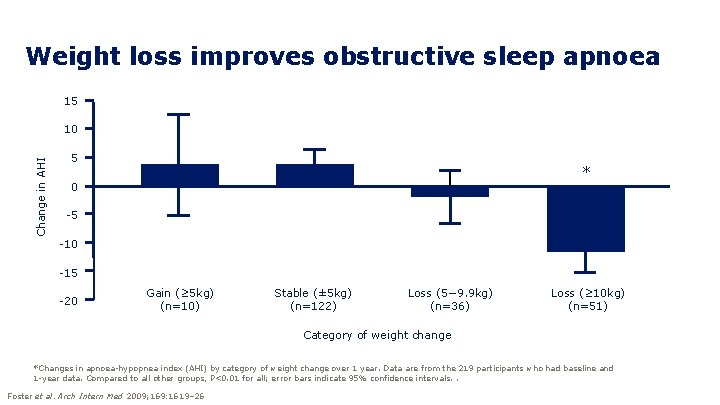
Weight loss improves obstructive sleep apnoea 15 Change in AHI 10 5 * 0 -5 -10 -15 -20 Gain (≥ 5 kg) (n=10) Stable (± 5 kg) (n=122) Loss (5− 9. 9 kg) (n=36) Loss (≥ 10 kg) (n=51) Category of weight change *Changes in apnoea-hypopnea index (AHI) by category of weight change over 1 year. Data are from the 219 participants who had baseline and 1 -year data. Compared to all other groups, P<0. 01 for all; error bars indicate 95% confidence intervals. . Foster et al. Arch Intern Med 2009; 169: 1619– 26
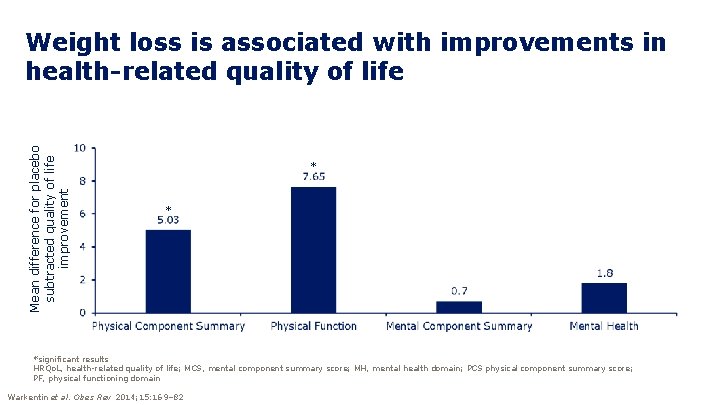
Mean difference for placebo subtracted quality of life improvement Weight loss is associated with improvements in health-related quality of life * * *significant results HRQo. L, health-related quality of life; MCS, mental component summary score; MH, mental health domain; PCS physical component summary score; PF, physical functioning domain Warkentin et al. Obes Rev 2014; 15: 169– 82
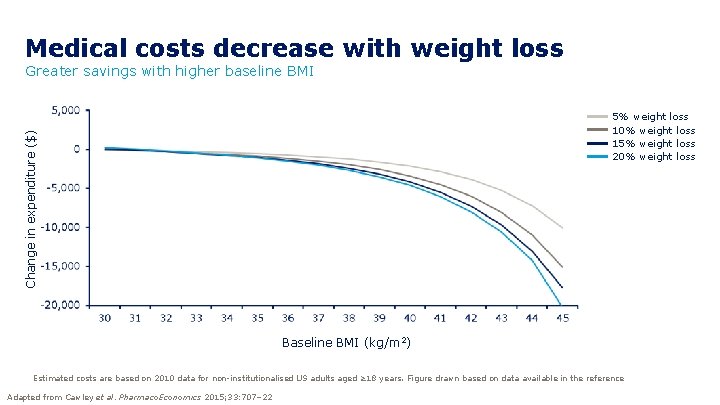
Medical costs decrease with weight loss Greater savings with higher baseline BMI Change in expenditure ($) 5% weight loss 10% weight loss 15% weight loss 20% weight loss Baseline BMI (kg/m 2) Estimated costs are based on 2010 data for non-institutionalised US adults aged ≥ 18 years. Figure drawn based on data available in the reference Adapted from Cawley et al. Pharmaco. Economics 2015; 33: 707– 22

Clinical management of obesity
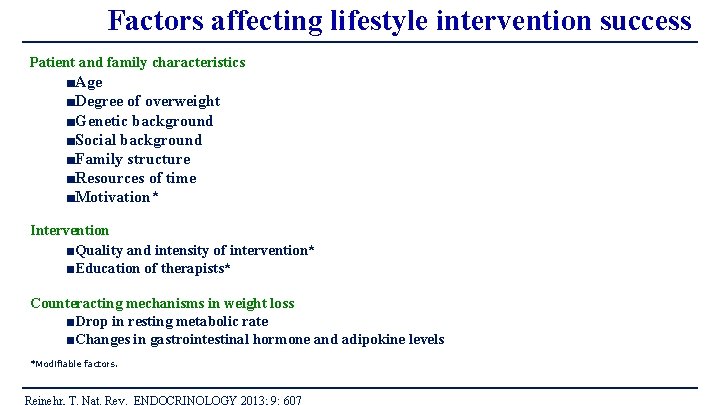
Factors affecting lifestyle intervention success Patient and family characteristics ■Age ■Degree of overweight ■Genetic background ■Social background ■Family structure ■Resources of time ■Motivation* Intervention ■Quality and intensity of intervention* ■Education of therapists* Counteracting mechanisms in weight loss ■Drop in resting metabolic rate ■Changes in gastrointestinal hormone and adipokine levels *Modifiable factors. Reinehr, T. Nat. Rev. ENDOCRINOLOGY 2013; 9: 607
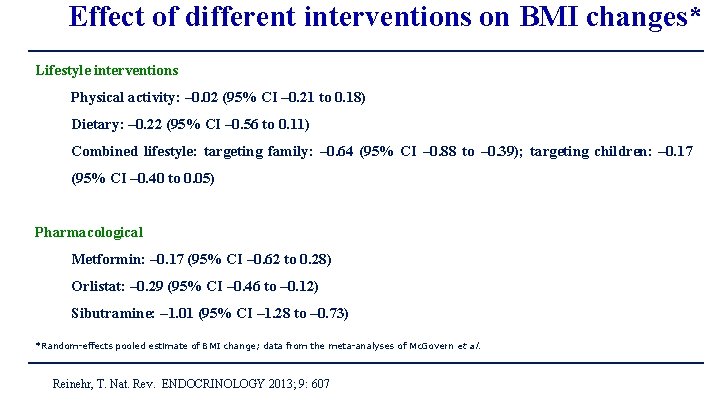
Effect of different interventions on BMI changes* Lifestyle interventions Physical activity: – 0. 02 (95% CI – 0. 21 to 0. 18) Dietary: – 0. 22 (95% CI – 0. 56 to 0. 11) Combined lifestyle: targeting family: – 0. 64 (95% CI – 0. 88 to – 0. 39); targeting children: – 0. 17 (95% CI – 0. 40 to 0. 05) Pharmacological Metformin: – 0. 17 (95% CI – 0. 62 to 0. 28) Orlistat: – 0. 29 (95% CI – 0. 46 to – 0. 12) Sibutramine: – 1. 01 (95% CI – 1. 28 to – 0. 73) *Random-effects pooled estimate of BMI change; data from the meta-analyses of Mc. Govern et al. Reinehr, T. Nat. Rev. ENDOCRINOLOGY 2013; 9: 607
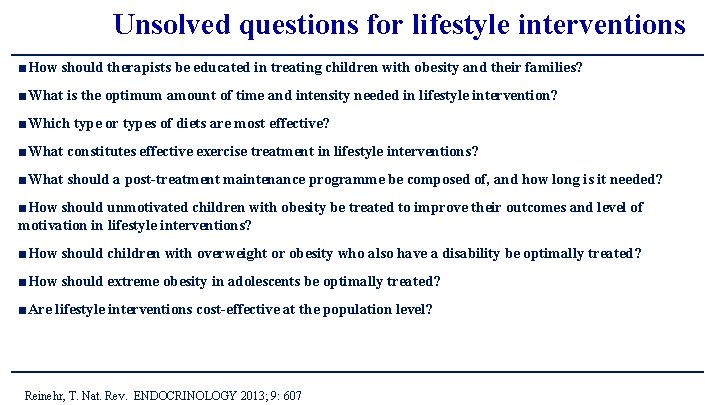
Unsolved questions for lifestyle interventions ■How should therapists be educated in treating children with obesity and their families? ■What is the optimum amount of time and intensity needed in lifestyle intervention? ■Which type or types of diets are most effective? ■What constitutes effective exercise treatment in lifestyle interventions? ■What should a post-treatment maintenance programme be composed of, and how long is it needed? ■How should unmotivated children with obesity be treated to improve their outcomes and level of motivation in lifestyle interventions? ■How should children with overweight or obesity who also have a disability be optimally treated? ■How should extreme obesity in adolescents be optimally treated? ■Are lifestyle interventions cost-effective at the population level? Reinehr, T. Nat. Rev. ENDOCRINOLOGY 2013; 9: 607
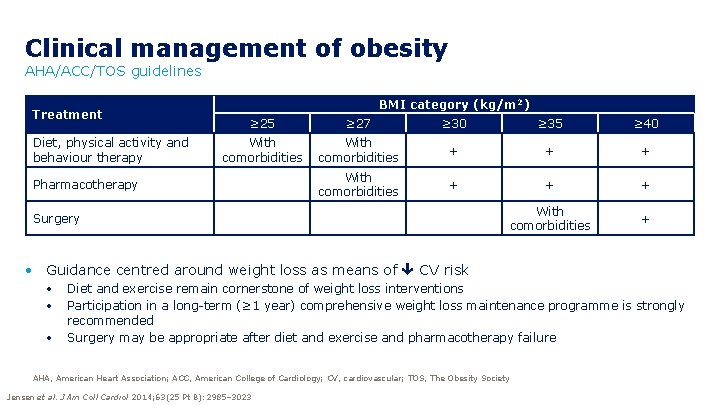
Clinical management of obesity AHA/ACC/TOS guidelines Treatment Diet, physical activity and behaviour therapy BMI category (kg/m 2) ≥ 25 ≥ 27 ≥ 30 ≥ 35 ≥ 40 With comorbidities + + + With comorbidities + Pharmacotherapy Surgery • Guidance centred around weight loss as means of CV risk • • • Diet and exercise remain cornerstone of weight loss interventions Participation in a long-term (≥ 1 year) comprehensive weight loss maintenance programme is strongly recommended Surgery may be appropriate after diet and exercise and pharmacotherapy failure AHA, American Heart Association; ACC, American College of Cardiology; CV, cardiovascular; TOS, The Obesity Society Jensen et al. J Am Coll Cardiol 2014; 63(25 Pt B): 2985– 3023

Edmonton Obesity Staging System (EOSS) Stage 0 Stage 1 Stage 2 Stage 3 Stage 4 No sign of obesityrelated risk factors No physical symptoms No psychological symptoms No functional limitations Patient has obesityrelated subclinical risk factors OR Mild physical symptoms – patients currently not requiring medical treatment for comorbidities OR Mild obesity-related psychology and/or mild impairment of wellbeing Patient has an established obesityrelated comorbidity requiring medical intervention OR Moderate obesityrelated psychological symptoms OR Moderate functional limitations in daily activities Patient has significant obesityrelated end-organ damage OR Significant obesityrelated psychological symptoms OR Significant impairment of wellbeing Severe (potential end stage) from obesityrelated chronic disease OR Severe disabling psychological symptoms OR Severe functional limitations Sharma, Kushner. Int J Obes (Lond) 2009; 33: 289– 95
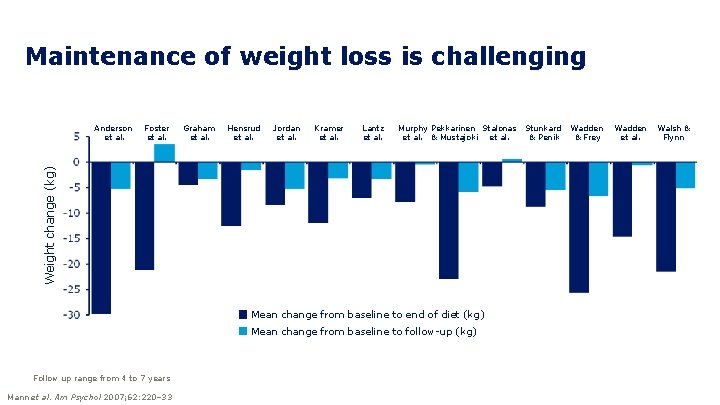
Maintenance of weight loss is challenging Foster et al. Graham et al. Hensrud et al. Jordan et al. Kramer et al. Lantz et al. Murphy Pekkarinen Stalonas et al. & Mustajoki et al. Weight change (kg) Anderson et al. Mean change from baseline to end of diet (kg) Mean change from baseline to follow-up (kg) Follow up range from 4 to 7 years Mann et al. Am Psychol 2007; 62: 220– 33 Stunkard & Penik Wadden & Frey Wadden et al. Walsh & Flynn
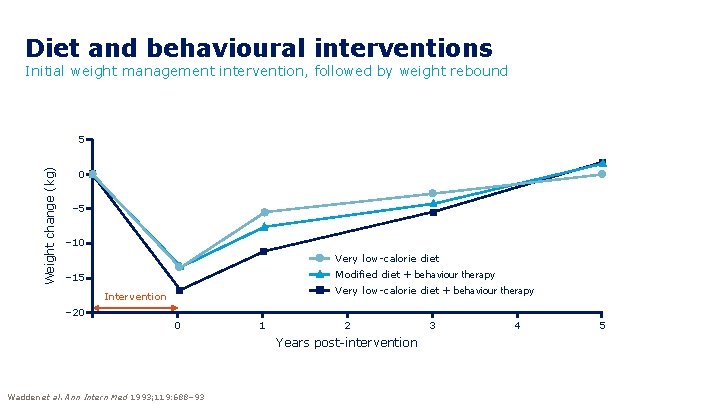
Diet and behavioural interventions Initial weight management intervention, followed by weight rebound Weight change (kg) 5 0 – 5 – 10 Very low-calorie diet Modified diet + behaviour therapy – 15 Very low-calorie diet + behaviour therapy Intervention – 20 0 1 2 Years post-intervention Wadden et al. Ann Intern Med 1993; 119: 688– 93 3 4 5
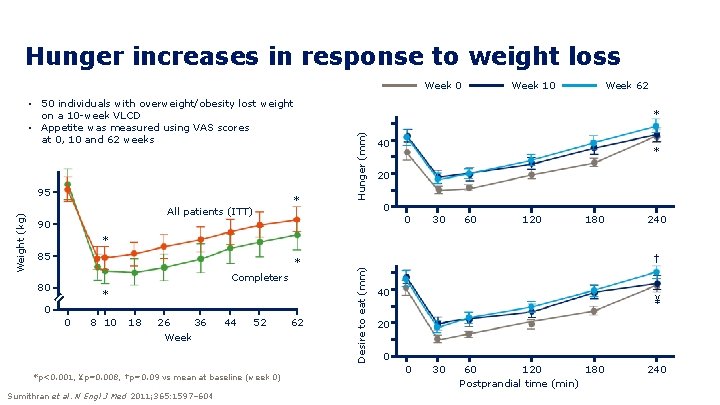
Hunger increases in response to weight loss Week 0 • 50 individuals with overweight/obesity lost weight on a 10 -week VLCD • Appetite was measured using VAS scores at 0, 10 and 62 weeks Hunger (mm) * All patients (ITT) Week 62 * 40 * 20 0 0 90 30 60 120 180 240 * 85 * Completers 80 * 0 0 8 10 18 26 36 Week 44 52 *p<0. 001, ¥p=0. 008, †p=0. 09 vs mean at baseline (week 0) Sumithran et al. N Engl J Med 2011; 365: 1597– 604 62 † Desire to eat (mm) Weight (kg) 95 Week 10 40 ¥ 20 0 0 30 60 120 180 Postprandial time (min) 240
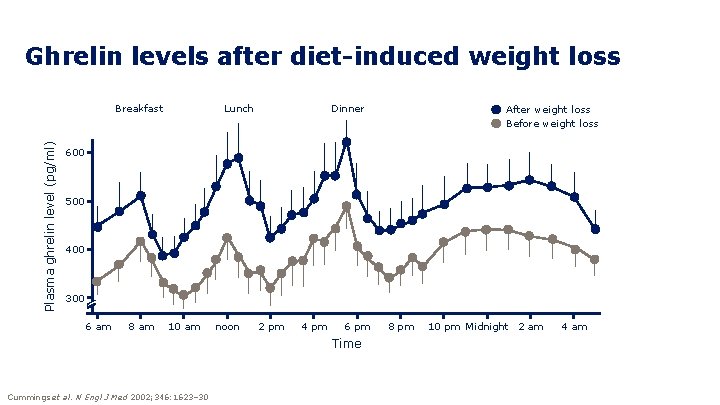
Ghrelin levels after diet-induced weight loss Plasma ghrelin level (pg/ml) Breakfast Lunch Dinner After weight loss Before weight loss 600 500 400 300 6 am 8 am 10 am noon 2 pm 4 pm 6 pm Time Cummings et al. N Engl J Med 2002; 346: 1623– 30 8 pm 10 pm Midnight 2 am 4 am
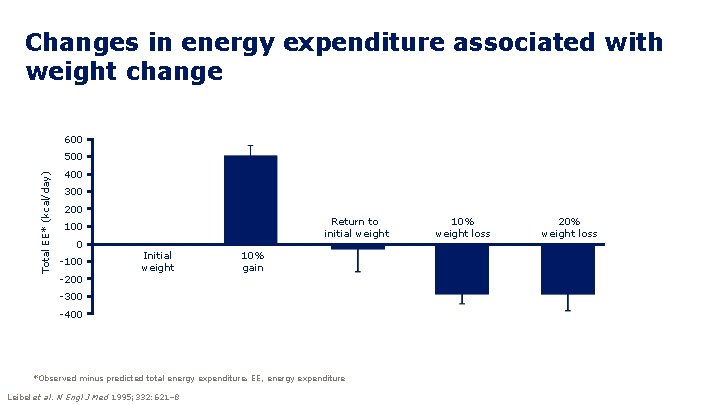
Changes in energy expenditure associated with weight change 600 Total EE* (kcal/day) 500 400 300 200 Return to initial weight 100 0 -100 -200 Initial weight 10% gain -300 -400 *Observed minus predicted total energy expenditure. EE, energy expenditure Leibel et al. N Engl J Med 1995; 332: 621– 8 10% weight loss 20% weight loss
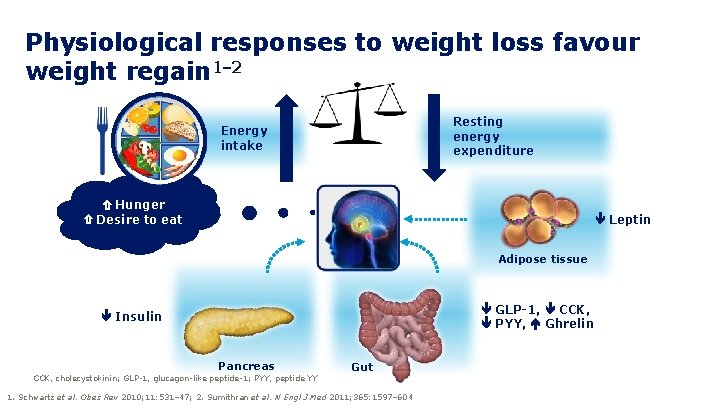
Physiological responses to weight loss favour weight regain 1– 2 Resting energy expenditure Energy intake Hunger Desire to eat Leptin Adipose tissue GLP-1, CCK, PYY, Ghrelin Insulin Pancreas CCK, cholecystokinin; GLP-1, glucagon-like peptide-1; PYY, peptide YY Gut 1. Schwartz et al. Obes Rev 2010; 11: 531– 47; 2. Sumithran et al. N Engl J Med 2011; 365: 1597– 604
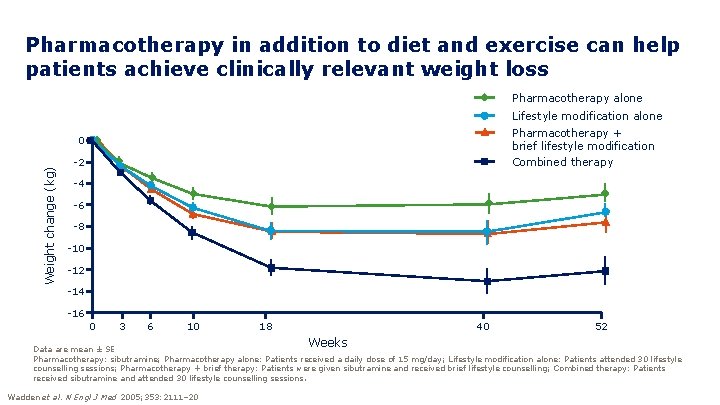
Pharmacotherapy in addition to diet and exercise can help patients achieve clinically relevant weight loss Pharmacotherapy alone Lifestyle modification alone Pharmacotherapy + brief lifestyle modification Combined therapy Weight change (kg) 0 -2 -4 -6 -8 -10 -12 -14 -16 0 3 6 10 18 40 Weeks 52 Data are mean ± SE Pharmacotherapy: sibutramine; Pharmacotherapy alone: Patients received a daily dose of 15 mg/day; Lifestyle modification alone: Patients attended 30 lifestyle counselling sessions; Pharmacotherapy + brief therapy: Patients were given sibutramine and received brief lifestyle counselling; Combined therapy: Patients received sibutramine and attended 30 lifestyle counselling sessions. Wadden et al. N Engl J Med 2005; 353: 2111– 20
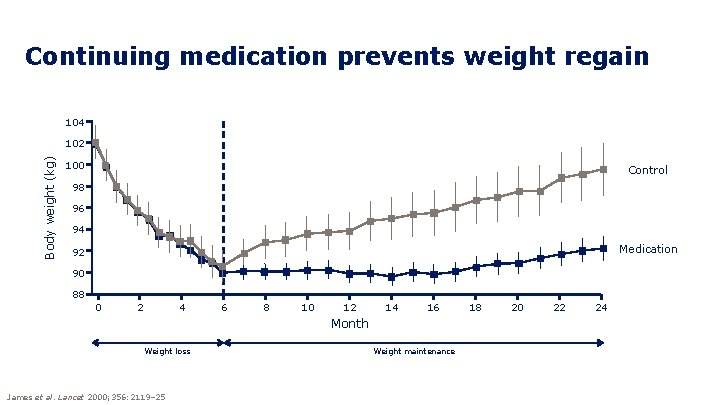
Continuing medication prevents weight regain 104 Body weight (kg) 102 100 Control 98 96 94 Medication 92 90 88 0 2 4 6 8 10 12 14 16 Month Weight loss James et al. Lancet 2000; 356: 2119– 25 Weight maintenance 18 20 22 24
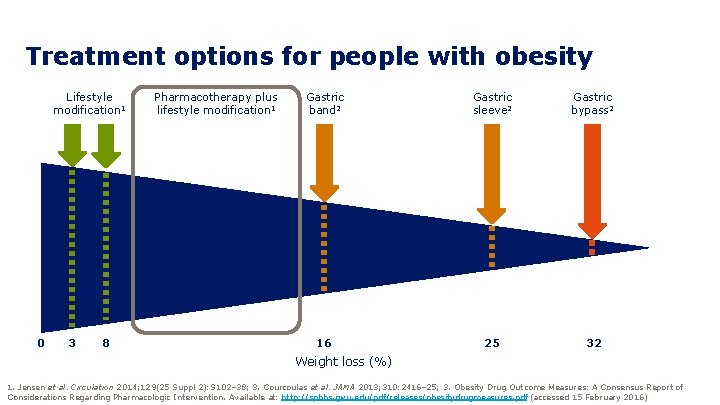
Treatment options for people with obesity Lifestyle modification 1 0 3 8 Pharmacotherapy plus lifestyle modification 1 Gastric band 2 Gastric sleeve 2 Gastric bypass 2 16 25 32 Weight loss (%) 1. Jensen et al. Circulation 2014; 129(25 Suppl 2): S 102– 38; 3. Courcoulas et al. JAMA 2013; 310: 2416– 25; 3. Obesity Drug Outcome Measures: A Consensus Report of Considerations Regarding Pharmacologic Intervention. Available at: http: //sphhs. gwu. edu/pdf/releases/obesitydrugmeasures. pdf (accessed 15 February 2016)
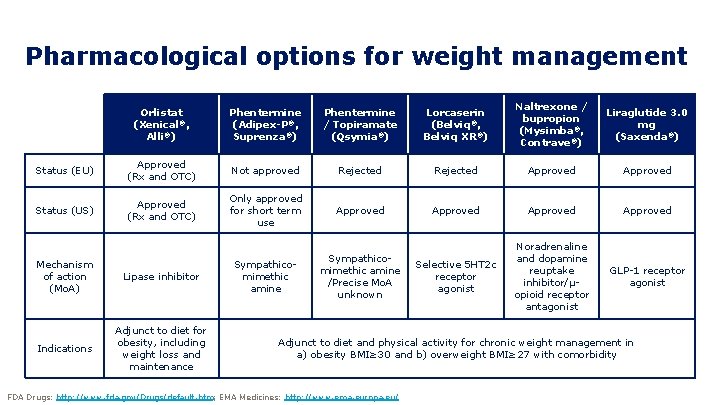
Pharmacological options for weight management Orlistat (Xenical®, Alli®) Phentermine (Adipex-P®, Suprenza®) Phentermine / Topiramate (Qsymia®) Lorcaserin (Belviq®, Belviq XR®) Naltrexone / bupropion (Mysimba®, Contrave®) Liraglutide 3. 0 mg (Saxenda®) Status (EU) Approved (Rx and OTC) Not approved Rejected Approved Status (US) Approved (Rx and OTC) Only approved for short term use Approved Sympathicomimethic amine /Precise Mo. A unknown Selective 5 HT 2 c receptor agonist Noradrenaline and dopamine reuptake inhibitor/µopioid receptor antagonist GLP-1 receptor agonist Mechanism of action (Mo. A) Lipase inhibitor Indications Adjunct to diet for obesity, including weight loss and maintenance Adjunct to diet and physical activity for chronic weight management in a) obesity BMI≥ 30 and b) overweight BMI≥ 27 with comorbidity FDA Drugs: http: //www. fda. gov/Drugs/default. htm; EMA Medicines: http: //www. ema. europa. eu/
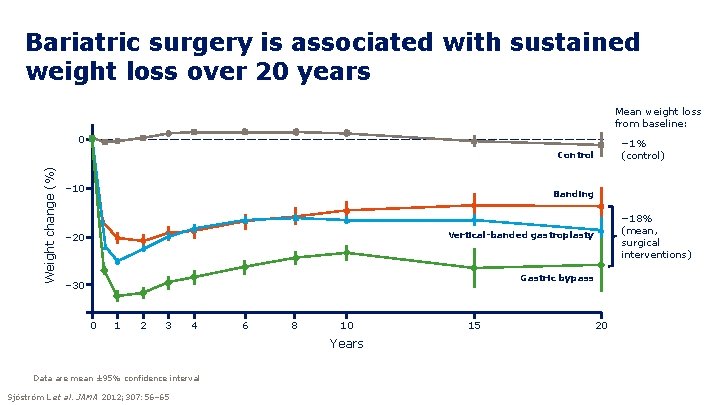
Bariatric surgery is associated with sustained weight loss over 20 years Mean weight loss from baseline: 0 − 1% (control) Weight change (%) Control – 10 Banding − 18% (mean, surgical interventions) Vertical-banded gastroplasty – 20 Gastric bypass – 30 0 1 2 3 4 6 8 10 Years Data are mean ± 95% confidence interval Sjöström L et al. JAMA 2012; 307: 56– 65 15 20
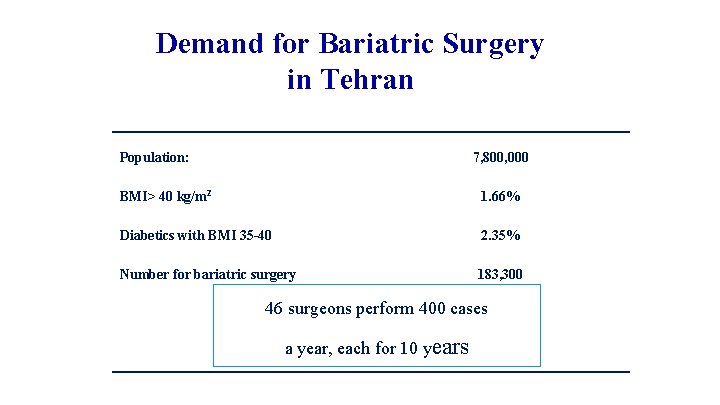
Demand for Bariatric Surgery in Tehran Population: 7, 800, 000 BMI> 40 kg/m 2 1. 66% Diabetics with BMI 35 -40 2. 35% Number for bariatric surgery 183, 300 46 surgeons perform 400 cases a year, each for 10 years

Prevention
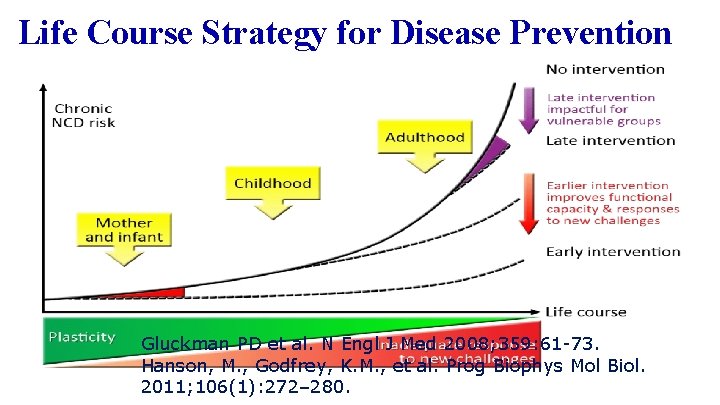
Life Course Strategy for Disease Prevention Gluckman PD et al. N Engl J Med 2008; 359: 61 -73. Hanson, M. , Godfrey, K. M. , et al. Prog Biophys Mol Biol. 2011; 106(1): 272– 280.
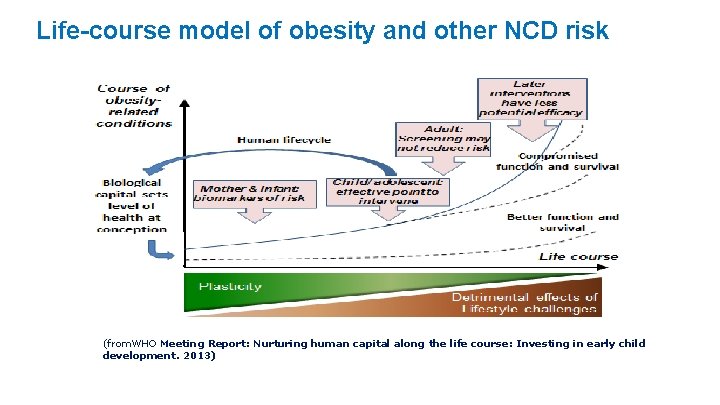
Life-course model of obesity and other NCD risk (from. WHO Meeting Report: Nurturing human capital along the life course: Investing in early child development. 2013)

Thank you for your attention
- Slides: 77