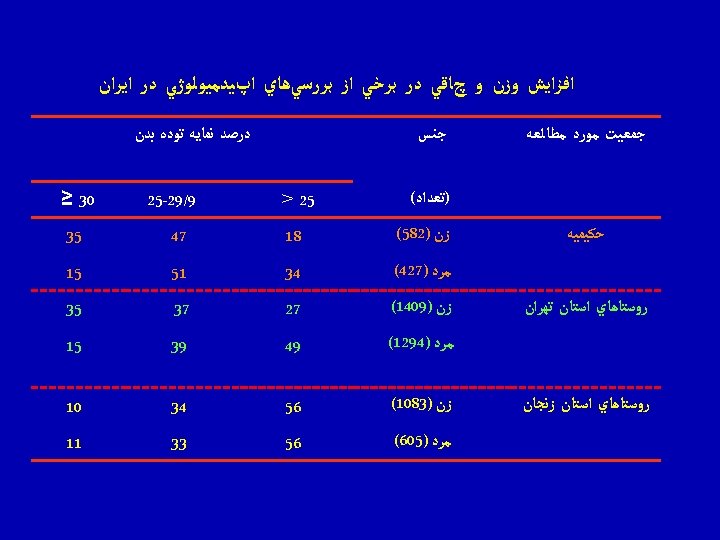
Obesity Definition History Etiology and pathogenesis Prevalence Global


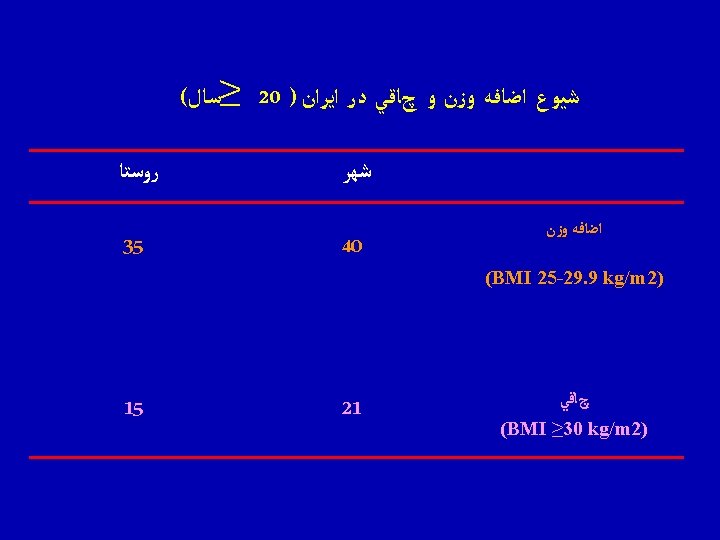
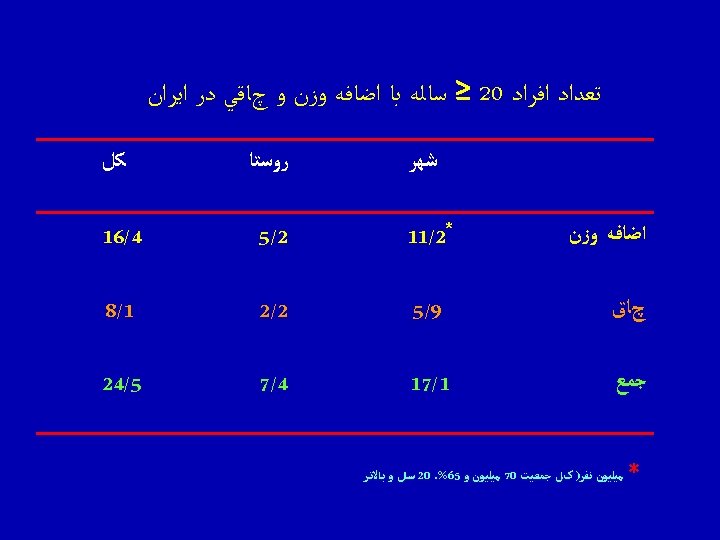
Obesity • Definition & History • Etiology and pathogenesis • Prevalence: - Global, regional, national - Childhood and adolescent - Trends; epidemy • Complications and comorbid conditions • Prevention


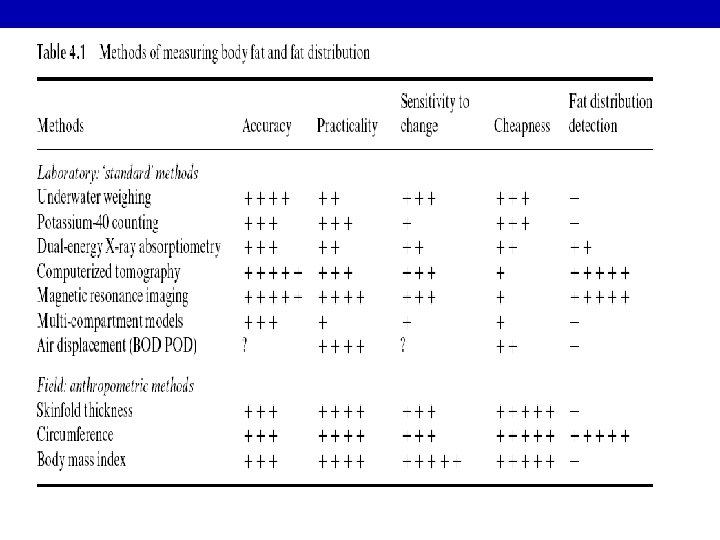

ADVANTAGES OF ANTHROPOMETRY • Objective with high specificity & sensitivity • Readings are numerical & gradable on standard growth charts • Readings are reproducible. • Non-expensive & need minimal training

Limitations of Anthropometry v. Inter-observers errors in measurement v. Problems with reference standards, i. e. local versus international standards. v. Arbitrary statistical cut-off levels for what considered as abnormal values.

International cut-off points for body mass index for overweight and obesity by sex between 10 and 18 years Obesity Overweight Age( years) Males Females 10 19. 84 19. 86 24. 00 24. 11 10. 5 20. 20 20. 29 24. 57 24. 77 11 20. 55 20. 74 25. 10 25. 42 11. 5 20. 89 21. 20 25. 58 26. 05 12 21. 22 21. 68 26. 02 26. 67 12. 5 21. 56 22. 14 26. 43 27. 24 13 21. 91 22. 58 26. 84 27. 76 13. 5 22. 27 22. 98 27. 25 28. 20 14 22. 62 23. 34 27. 63 28. 57 14. 5 22. 96 23. 66 27. 98 28. 87 15 23. 29 23. 94 28. 30 29. 11 15. 5 23. 60 24. 17 28. 60 29. 29 16 23. 90 24. 37 28. 88 29. 43 16. 5 24. 19 24. 54 29. 14 29. 56 17 24. 46 24. 70 29. 41 29. 69 17. 5 24. 73 24. 85 29. 70 29. 84 25 25 30 30 18 Source: Cole et al. BMJ 2000; 320: 1240

Risk factors and influences

Etiology of Obesity Energy Expenditure Sedentary lifestyle Energy Intake High fat, high-calorie diet Genetic Predisposition

Health threat from abdominal obesity is largely due to intra-abdominal obesity Increased Cardiometabolic Risk Dyslipidemia Hypertension Abdominal Obesity Intra-Abdominal Adiposity Adapted from Eckel et al 2005 Glucose Intolerance Insulin Resistance

 Men Women USA (NCEP")
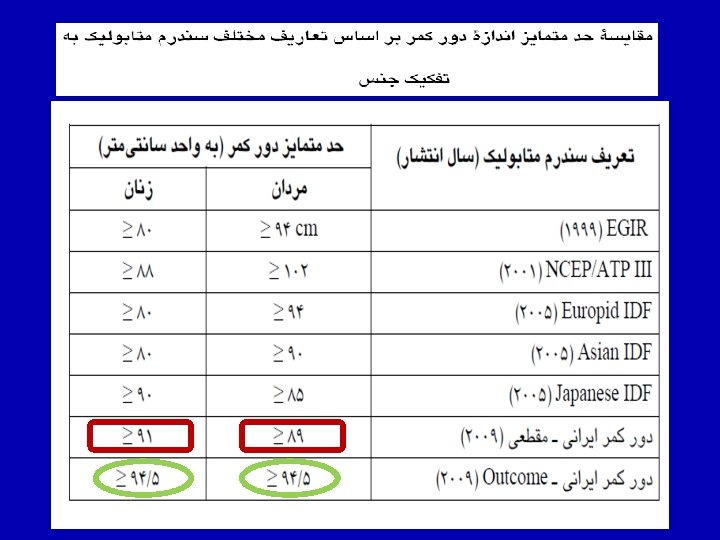
Various Criteria for Metabolic Syndrome Population Group Waist Circumference (cm) Men Women USA (NCEP ATP III) >102 >88 European >94 >80 South Asian/ Chinese >90 >80 Japanese >90 >85

 Prevalence")
Global Prevalence of Underweight and Obesity in Adults (by level of development, 2000) Prevalence (%) BMI = Body Mass Index Source: WHO, SDE/NHD, 2000

OBESITY RATES COULD DOUBLE IN 30 YEARS 50 % of population BMI >30 40 20 0 USA l England n Australia 30 10 n o Mauritius u Brazil n n l t n n ul u 1960 1970 n 1980 l o l u l l o 1990 Year 2000 Adapted from International Obesity Task Force Web site. Available at: http: //www. rri. sari. ac. uk/iotf/slides/ graph 12. gif. Accessed August 11, 1998. 2010 2020 2030

Prevalence of overweight and obesity in children
 and prevalence of overweight (B) and obesity (C) in Tehranian")
Changes in BMI (A) and prevalence of overweight (B) and obesity (C) in Tehranian population during 6. 6 years: TLGS, 1999 -2011 A 40 B 25 20 Male 15 Female 10 5 45 40 35 30 25 20 15 10 5 0 Male Female I 0 I II III Study Phases BMI Prevalence (%) Kg/m 2 30 Prevalence (%) 35 IV II III Study Phases Obesity C 50 45 40 35 30 25 20 15 10 5 0 Male Female I II III Study Phases Overweight IV IV
, WHR (B) and prevalence of abdominal obesity (C ) in Tehranian")
Changes in WC(A), WHR (B) and prevalence of abdominal obesity (C ) in Tehranian population during 6. 6 years: TLGS, 1999 -2011 B 120 1. 2 100 1 80 0. 8 60 0. 6 Male 40 Female 20 Male 0. 4 Female 0. 2 0 0 I II IV I Study Phases WC II III Study Phases WHR C 70 60 Prevalance (%) cm A 50 40 30 Male 20 Female 10 0 I II III Study Phases Abdominal Obesity IV IV

BMI Men 10% 8% 6% 4% 2% 0% -2% Women Overweight Men Total ≥ 70 60 -69 50 -59 40 -49 30 -39 20 -29 Total ≥ 70 60 -69 50 -59 40 -49 30 -39 BMI (phase I to III) 20 -29 (%) Percent changes in BMI, Overweight and Obesity in various age group of Tehranian adults during 6. 6 years: TLGS, 1999 -2008 Women (%) 35% %Overweight (phase I to III) Total ≥ 70 60 -69 50 -59 40 -49 30 -39 20 -29 -15% Women Men Total ≥ 70 60 -69 50 -59 40 -49 30 -39 20 -29 Total ≥ 70 60 -69 50 -59 40 -49 %Obesity (phase I to III) 30 -39 230% 180% 130% 80% 30% -20% -70% 20 -29 (%) Obesity

Percent changes in WC and abdominal obesity in various age group of Tehranian adults during 6. 6 years: TLGS, 1999 -2008 WC 15% Men 13% Women (%) 11% 9% WC (phase I to III) 7% 5% 3% Total ≥ 70 60 -69 50 -59 40 -49 30 -39 20 -29 1% Abdominal obesity Women Men 250% 100% %Abdominal obesity (phase I to III) 50% Total ≥ 70 60 -69 50 -59 40 -49 30 -39 20 -29 Total ≥ 70 60 -69 50 -59 40 -49 30 -39 0% 20 -29 (%) 200%

35 Iranian cutoff 30 25 20 15 10 5 0 30 IOTF cutoff Prevalence of overweight (%) Prevalence of at risk for overweight (%) Adjusted prevalence and trend of at risk for overweight and overweight in adolescent girls, according to Iranian BMI (body mass index) percentiles and IOTF (International Obesity Task Force) cutoffs in 2 age groups during 4 time periods (1999– 2011). 1999 - 2002 - 2005 - 20082001 2005 2008 2011 10 -14 year 1999 - 2002 - 2005 - 20082001 2005 2008 2011 15 -19 year Iranian Cutoff IOTF Cutoff 25 20 15 10 5 0 1999 - 2002 - 2005 - 20082001 2005 2008 2011 10 -14 year 1999 - 2002 - 2005 - 20082001 2005 2008 2011 15 -19 year Hosseini-Esfahani F, Mousavi Nasl Khameneh A, Mirmiran P, Ghanbarian A, Azizi F. Trends in Cardiovascular Disease Risk Factors among Adolescents: Tehran Lipid and Glucose Study, 1999 -2008. J Epidemiol 2011; 21(5): 319 -28.

Adjusted prevalence and trend of at risk for overweight and overweight in adolescent boys, according to Iranian BMI (body mass index) percentiles and IOTF (International Obesity Task Force) cutoffs in 2 age groups during 4 time periods (1999– 2011). Iranian Cutoff 30 IOTF Cutoff Prevalence of overweight (%) Prevalence of at risk for overweight (%) 30 25 20 15 10 5 Iranian Cutoff IOTF Cutoff 25 20 15 10 5 0 0 1999 - 2002 - 2005 - 20082001 2005 2008 2011 10 -14 year 1999 - 2002 - 2005 - 20082001 2005 2008 2011 15 -19 year Hosseini-Esfahani F, Mousavi Nasl Khameneh A, Mirmiran P, Ghanbarian A, Azizi F. Trends in Cardiovascular Disease Risk Factors among Adolescents: Tehran Lipid and Glucose Study, 1999 -2008. J Epidemiol 2011; 21(5): 319 -28.

Mean age-standardized levels of metabolic risk factors in relation to per-capita gross domestic product (GDP) Danaei G, et al. (Global Burden of Metabolic Risk Factors of Chronic Diseases Collaborating Group), In press.

Mean age-standardized SBP, TC, and FPG in relation to mean age-standardized BMI Danaei G, et al. (Global Burden of Metabolic Risk Factors of Chronic Diseases Collaborating Group), In press.

Mean age-standardized levels of metabolic risk factors in relation to western diet. See Methods for how percentiles were calculated Danaei G, et al. (Global Burden of Metabolic Risk Factors of Chronic Diseases Collaborating Group), In press.

Mean age-standardized levels of metabolic risk factors in relation to the proportion of a country’s population that lived in urban areas Danaei G, et al. (Global Burden of Metabolic Risk Factors of Chronic Diseases Collaborating Group), In press.

Comorbid Conditions and BMI Patients With BMI 27 No Comorbidity 35% Comorbidity 65% • Comorbid conditions that increase as BMI increases – Hypertension (56%) – Dyslipidemia (47%) – Type 2 diabetes (70%)

Relation Between BMI and Co morbidities Women Relative Risk Men 6 6 5 5 4 4 3 3 2 2 1 1 0 <21 22 Type 2 diabetes Cholelithiasis Hypertension Coronary heart disease 23 24 25 26 27 BMI (kg/m 2) 28 29 30 0 <21 22 23 24 25 26 27 BMI (kg/m 2) 28 29 30

Obesity and Mortality Risk 2. 5 2. 0 Mortality 1. 5 Ratio 1. 0 Men Women 0 Very Low 20 Low 25 Moderate 30 BMI 35 Very High 40

Annual per-person medical costs, survival adjusted


Complications of Childhood Obesity Psychosocial Poor self-esteem Anxiety Depression Eating disorders Social isolation Lower educational attainment Neurologic Pseudotumor cerebri Endocrine Insulin resistance Type 2 diabetes Precocious puberty Polycystic ovaries (girls) Hypogonadism (boys) Cardiovascular Dyslipidemia Hypertension Coagulopathy Chronic inflammation Endothelial dysfunction

Complications of Childhood Obesity Pulmonary Sleep apnea Asthma Exercise intolerance Gastrointestinal Gastroesophageal reflux Steatohepatitis Gallstones Constipation Renal Glomerulosclerosis Musculoskeletal Slipped capital femoral epiphysis Blount’s disease* Forearm fracture Back pain Flat feet * Blount’s disease is a growth disorder of the tibia that causes the lower leg to angle inward (tibia vara).

 Associated with Three Projections of Future Adult Obesity.")
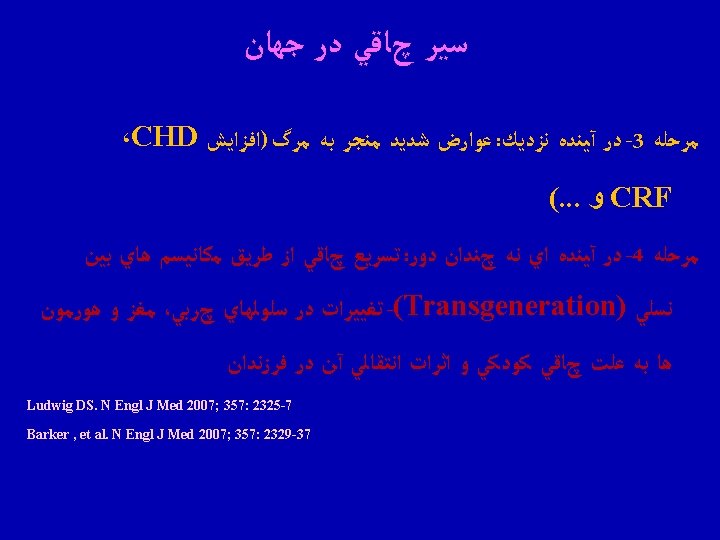
Prevalence of Coronary Heart Disease (CHD) Associated with Three Projections of Future Adult Obesity. High rates of current adolescent overweight are expected to increase the excess prevalence of CHD (Panel A) and to increase the overall population prevalence of CHD (Panel B). Bibbins-Domingo K, et al. N Engl J Med 2007; 357: 2371

CHD 3 In Adolescent A child who has born obese 4 Obese Adolescent 1 Diabetes Fatty liver 2 In Adolescent


Overall summary of meta-analyses results of randomized trials of treatments for pediatric obesity. Plot shows metaanalytic point estimates (f) and 95% CI (horizontal lines). SMD, Standardized mean differences. Mc. Govern L, et al. J Clin Endocrinol Metab 2008; 93: 4600– 4605.
 Weight Loss at One Year in the Combined-Therapy Group and the Group")
Mean (±SE) Weight Loss at One Year in the Combined-Therapy Group and the Group Treated by Lifestyle Modification Alone among Subjects in the Lowest and Highest Thirds of Adherence for Completing Food-Intake Records during the First 18 Weeks

Change in bodyweight Astrup A, et al. Lancet 2009; 379: 1606

The main task of country programs must focus on the primary prevention with structured programs of lifestyle modifications. Parents must take responsibility for their children’s health by modifying their own lifestyle and ensuring healthy lifestyles for their children, encouraging more physical activity and less television and computer viewing. These family efforts should be accompanied by the initiation of government and private sectors to provide high -quality food in the market and to curtail everincreasing manufacturers of fast or junk foods. Without serious and adequate interventions, a catastrophe looms ahead. Azizi F, et al. AIM 2008; 11: 242 -4


- Slides: 54